 Submit a Paper
 Propose a Special lssue
 Open Access
ARTICLE
Real Time Vehicle Status Monitoring under Moving Conditions Using a Low Power IoT System
1 Institute of Communication and Computer Systems, Athens, Greece
2 AIMEN Centre Technologic, Pontevedra, Spain
* Corresponding Author: M. Vlachos. Email:
Journal on Internet of Things 2022, 4(4), 235-261. https://doi.org/10.32604/jiot.2022.040820
Received 31 March 2023; Accepted 19 May 2023; Issue published 18 July 2023
 View Full Text
 Download PDF
Abstract
In the era of the Internet of Things (IoT), the ever-increasing number of devices connected to the IoT networks also increases the energy consumption on the edge. This is prohibitive since the devices living on the edge are generally resource constrained devices in terms of energy consumption and computational power. Thus, trying to tackle this issue, in this paper, a fully automated end-to-end IoT system for real time monitoring of the status of a moving vehicle is proposed. The IoT system consists mainly of three components: (1) the ultra-low power consumption Wireless Sensor Node (WSN), (2) the IoT gateway and (3) the IoT platform. In this scope, a self-powered WSN having ultra-low energy consumption (less than 10 mJ), which can be produced by environmental harvesting systems, is developed. WSN is used for collecting sensors’ measurements from the vehicle and transmitting them to the IoT gateway, by exploiting a low energy communication protocol (i.e., BLE). A powerful IoT gateway gathers the sensors’ measurements, harmonizes, stores temporary and transmits them wirelessly, to a backend server (i.e., LTE). And finally, the IoT platform, which in essence is a web application user interface (UI), used mainly for almost real time visualization of sensors’ measurements, but also for sending alerts and control signals to enable actuators, installed in the vehicle near to the sensors field. The proposed system is scalable and it can be adopted for monitoring a large number of vehicles, thus providing a fully automatic IoT solution for vehicle fleet management. Moreover, it can be extended for simultaneous monitoring of additional parameters, supporting other low energy communication protocols and producing various kinds of alerts and control signals.Keywords
Internet of Things (IoT) is an ecosystem of devices that are connected in a manner to be able to exchange data over a wired or wireless network. A variety of devices such as sensors, smartphones, laptops, tablets, smart electronic devices and others can collaborate to constitute an IoT system. The data produced by these IoT objects, collected by an IoT gateway or another edge device and can be shared with other applications located in remote servers or in the cloud. The same data can further be processed by artificial intelligence (AI) and machine learning algorithms to retrieve useful information for making decisions, either on the edge or on the cloud. The IoT ecosystem may cover from small areas such as a typical office to larger areas such as university campuses or cities. Recently, a lot of advanced IoT applications, such as intelligent healthcare systems, smart transport systems, smart energy systems and smart buildings have been proposed [1].
There are different kinds of sensors used to acquire information by the surrounding environment and the selection of them depends on the specific IoT application to be implemented. However, each sensor can be connected to the cloud or another remote server through a variety of communications methods and protocols such as cellular, satellite, Wi-Fi, Bluetooth, LPWAN, Ethernet etc. Each option has tradeoffs between power consumption, available range and bandwidth. Also, the best choice of the communication method depends on the specific IoT application, but they all accomplish the same task, transmitting data to the cloud or another remote server [1].
The ever-increasing efficiency of electronic circuits has recently brought up a qualitative change in the way wireless sensing is implemented due to power consumption being reduced to the realm of environmental energy harvesting. Self-powered wireless sensors can now fully rely on capturing waste energy emanating from near physical phenomena such as temperature differences, mechanical vibrations, or even residual radiofrequency from telecommunications, instead of requiring single-use batteries. The generated power not only is extremely low (typically from microwatts up to tens of milliwatts, depending on the source), but also tends to be uncontrollable and unpredictable [2]. This variability challenges many assumptions taken for granted in the design of conventional measurement devices and requires a more sophisticated approach.
In general, the harvesting strategy consists of accumulating energy in a small repository until a pre-defined operational threshold is reached, then the sensors are activated until power is depleted or it is voluntarily turned off. Usually, the storage devices are supercapacitors which even though can reach capacities of up to tens of Farads are still several orders of magnitude behind commonbatteries [3].
Focusing on this measurement cycle imposes a paradigm shift in the understanding of these systems, since they work in a discrete mode rather than a stationary state, and so are better described in terms of energy required to perform a single measurement rather than the average power consumption over an arbitrarily long period of time. One consequence of this model is a tradeoff between the measurement frequency and energy consumption. Assuming a given charging rate, sensors that consume more must wait longer for enough energy to become available. Similarly, faster measurements require a lower consumption. Thus, time can become a free parameter used to match an energy source with the consumption requirements.
Another tradeoff can be found between the system complexity and the energy consumption, as depicted below in Fig. 1. If the supply is extremely constrained, sensors are relegated to having no control over the measurement frequency (1° scenario). As more power is harvested, more sophisticated features can be implemented such as synchronized measurements triggered by the gateway(2° scenario). Finally, an unbounded power source would act as a more conventional measurement device with exact timing, a real-time clock (RTC), etc. (3° scenario).

Figure 1: Energy harvesting scenarios
With the least amount of harvested energy, the worst-case scenario, the WSN could only spare to send the measurements as soon as enough energy becomes available and its task would probably have to be broken into several subtasks in case the energy storage is very small. In this scenario, and especially considering that the nature of real-world energy harvesting is highly unpredictable, it would not be possible to follow a constant measuring period, it would just work when it can. With more regular and predictable energy available, the WSN could be turned on all the time listening for a trigger from the gateway. This would effectively sync all the WSN measurements, regardless of whether the transmission happens at a later stage and would require a harvesting rate higher than the standby consumption. The logic of deciding whether this is possible could be implemented on the gateway by averaging the periods and then communicating it to the WSN as it acknowledges the reception of the previous scenario. With much more energy available, the WSN could, additionally, keep a real-time clock synced with a very high precision and follow strict measurement periods.
WSNs are crucial components of the IoT systems used for environmental monitoring (i.e., animal tracking, air quality monitoring, water quality monitoring, disaster monitoring etc.). The WSNs are deployed to the sensors’ field (edge) and must remain operational in order to collect measurements and be able to transmit them to the cloud. The main challenge of using such devices is that they are resource-constrained because the large majority of them are battery powered, and consequently this energy, depending on various parameters such as data rate, computational requirements etc., may be quickly drained, making WSNs not working properly. Thus, the idea of harvesting ambient energy from the immediate surroundings of the deployed sensors, to recharge the batteries and to directly power the sensor nodes, has recently been proposed [4]. This idea dramatically reduces the dependency of the WSN on the power of the battery. Unfortunately, this idea introduces new challenges, mainly because the produced energy is much smaller than needed. To address this challenge researchers, have to reduce the energy resources needed by their applications to the extreme minimum, in order to be based on the energy produced by the energy harvesting system, or they must use alternative sources of energy. If the former is the case, we are speaking for applications belonging to the first energy harvesting scenario and such an application is the proposed in this paper. Thus, given the requirements of the application for ultra-low power consumption in the sensors field, the proposed method focuses on the first scenario, retaining WSN complexity at a very low level and leaving the most sophisticated procedures to the edge and the cloud levels.
The concern about energy harvesting has been increasing over the last few years and due to the limitation of resources it is expected to continue increasing in the future. A lot of mechanisms for energy harvesting have been proposed using different sources of energy and applied in self-powered devices such as wireless sensor nodes, biomedical devices and more [5].
In [6] authors attempt to provide an overview of energy harvesting sources available in a target operating environment and demonstrate power consumption system models of an application low-power embedded system-on-chip (SoC) platform capable of harvesting ambient energy and communicating wirelessly. The idea is to understand the end deployment environment through experimentation and study the energy harvesting methodology.
An interesting application for energy harvesting from pavements using piezoelectric materials has been presented in [7]. Mechanical energy can be converted into electricity via stress or vibration using piezoelectric transducers placed on pavement surface or embedded in the pavement. The major benefit is that the piezoelectric energy harvesting system provides a distributed system to generate electricity.
In [8] an efficient wind speed forecasting for resource-constrained sensor devices is proposed. A new efficient ARIMA-based forecasting model for predicting wind speed at short-term horizons. The performance results obtained using real data sets show that the proposed ARIMA model can be an excellent choice for wind-powered sensor nodes due to its potential for achieving accurate enough predictions with very low computational burden and memory overhead.
An interesting approach about waste energy harvesting technologies in smart manufacturing is presented in [9]. Huge waste heat sources and mechanical vibration sources are available as common by-products in almost all manufacturing processes, where piezoelectric, electromagnetic, electrostatic, etc., can be used to convert mechanical kinetic energy into electrical energy; thermoelectric, pyroelectric, thermomagnetic, etc., can be used to convert thermal energy into electrical energy; and many other energy harvesting technologies such as electromagnetic, electrostatic, thermomagnetic, triboelectric energy harvesting, etc., can be used to harvest waste energy into electricity for sustainable manufacturing. It is expected that the waste energy harvesting technologies and applications will have a great advancement in the next 5–10 years.
On the other hand, various approaches have been already presented in the literature for real time in-vehicle status monitoring. Some of them try to manage the vehicle tracking problem [10–12], others try to manage the accident detection and accident severity assessment problem [13], while others try to perform data fusion from different sources in order to obtain meaningful results [14]. All of the works presented so far have a medium to large complexity, with a direct consequence to be the increment on the power consumption (second and third energy harvesting scenario). The objective of this work is to present a novel IoT solution which monitors the status of vehicles in a real time manner and it is based on ultra-low power consumption. So, it is better fits in the first energy harvesting scenario where the complexity of the system has to be as simple as possible in order to be feasible for the system to operate.
Thus, the proposed application is a fully automated IoT system for real time monitoring of the status of a moving vehicle. The term “under moving conditions” is used in order to indicate that the proposed IoT system is used only when the vehicle is on the go. And this because the continuous movement of the vehicle is the only source of energy used to power the WSN. Otherwise, the system cannot operate. It monitors parameters, such as fuel level and 3-axis acceleration, based on measurements observed by sensors installed in appropriate locations in the chassis of the moving vehicle and powered by an ultra-low power harvesting system. Fig. 2 shows the exact location of the various components. The energy harvesting system (EHS) was installed close to the exhaust of the vehicle in order to exploit the thermoelectric phenomena happening there. The WSN was installed in the appropriate location of the vehicle’s chassis near to the fuel system and the back wheels. The IoT gateway is a portable device which can be everywhere inside the vehicle. In Fig. 2 is depicted inside the vehicle’s cabin. IoT system utilizes a WSN for collecting sensors measurements from the sensors field and transmitting them to the IoT gateway by exploiting a low energy communication protocol such as Bluetooth Low Energy (BLE), an IoT gateway for harmonizing, filtering, temporary storing and transmitting the measurement data, to a backend server under a secure internet connection (i.e., Wi-Fi, LTE), and an IoT platform, for visualization real time or exploring past history sensors measurements, or for sending control signals to enable actuators installed in the vehicle. The main advantage of the proposed IoT application is that it is scalable and thus, it can be adopted for monitoring a large number of vehicles and that it can be extended for simultaneous monitoring of additional parameters by supporting more sensors or other low energy communication protocols.
Figure 2: Location of various components of the system in a vehicle
The proposed method tries to address the problem of gathering measurements in the sensors field without using conventional power systems. Thus, it is restricted in terms of resources and also has low complexity (belongs to the 1st energy harvesting scenario). The adoption of the proposed WSN is, according to our knowledge, the only zero-energy (green) solution has been proposed so far in the literature. Although, other methods (i.e., cabled CAN network that integrates several sensors and actuators) also produce meaningful results are energy consuming and present high computational complexity.
Moreover, it adopts well known and used hardware and software tools which have been proved very promising in terms of low power and low-cost development. Apart from that, it is a fully autonomous solution which does not require human intervention.
The structure of this paper is as follows: In the next section, the proposed IoT method is analytically described by presenting both the architecture of the whole IoT system and the implementation details of each component. In the sequel, the system setup and relevant results produced by the application of the proposed method in the vehicle case are presented and finally, some conclusions and directions for future work are given.
In this section, the method adopted for implementing the end-to-end IoT system is analytically presented. After evaluating various IoT architectures, the most promising IoT solution is analyzed and the data flow from source (edge) to destination (cloud), along with the specific IoT components, is explained. Finally, the scaling of the proposed method is briefly discussed revealing also the advantages of this approach when extended in larger scales.
The IoT architecture of the proposed system follows the three-tier architecture model shown in Fig. 3.

Figure 3: IoT three tier architecture
The first layer is the sensors field, where appropriate sensors are installed, and they are measuring various parameters from the testing vehicle. It consists of sensors and actuators connected with a low power consumption microcontroller, with an embedded telecommunication component on it, which purpose is twofold. On the one hand, to collect sensors measurements and transmit them to an IoT gateway via a low power consumption communication protocol, such as Bluetooth Low Energy or LoRaWAN, and on the other hand to get feedback from the user application interface and enable the appropriate actuators, in order to prevent some undesired effects in the vehicle. Each sensor or a group of sensors along with the corresponding actuators and the microcontroller used for data transmission constitute a Wireless Sensor Node (WSN).
The second layer is the edge and consists of the IoT gateway which is responsible for gathering the measurement data from the various WSNs, store them temporarily, process and harmonize the data and finally transmit them to a remote cloud service or backend server depending on the user needs, when a stable internet connection has been established.
Finally, the third layer is the application, where the IoT platform is hosted. IoT platform is a web application which is the user interface connecting the user with the sensors field and used both for data visualization and exploring and also for sending alerts to users or for sending user’s feedback to the sensors field. The proposed IoT architecture, as described above is depicted in Fig. 4.
Figure 4: Proposed IoT architecture
After evaluating and experimenting with various IoT system architectures, using different communication protocols for interconnection, and having in mind the requirements for ultra-low power consumption on the side of the WSN, an IoT solution, which presents simultaneously both high performance and low power consumption, is adopted. Fig. 5 illustrates the block diagram of the proposed IoT architecture.
Figure 5: Block diagram of the proposed architecture (BLE-REST-MQTT)
According to the proposed architecture, there is a minimum data loss (high data integrity) between edge (WSN, IoT gateway) and cloud (MQTT, Web application) because there is in the gateway a software component that continuously monitors the status of the network. Depending on the current status measurement data are routed to MQTT, when a stable connection is established or buffered, when there is bad or no connectivity. Moreover, since the main data processing occurred on the edge the secureness of the data (confidentiality) is guaranteed.
The basic data flow is as follows. When a sufficient amount of energy has been stored in the supercapacitor the WSN is able to operate and get measurements from the installed sensors (fuel level, acceleration in 3-axis). The measurement data is instantly collected by the IoT gateway from a BLE module embedded in the microcontroller of the WSN. The adopted data communication protocol proved to be the best compromise between the requirement for ultra-low power consumption on the WSN side and data accuracy during transmission. Thus, when the measurement data are available and advertised by the WSN, they can be gathered by the IoT gateway and temporarily stored to a memory buffer.
This storage operation is performed by IoT gateway in order to transmit the data to the IoT platform only when a stable communication has been established, thus reducing data loss and guaranteeing safe transmission of information. The data is then transformed in the IoT gateway, formatting JSON messages which are valid for publishing to a MQTT message broker. When the IoT gateway is ready for transmitting the data, instead of transmitting them directly to the message broker, it posts the formatted data to EdgeXFoundry using HTTP REST calls. EdgeXFoundry, based on the specific setup of the deployment, takes care of all the operations required for securely publishing the data to the message broker. EdgeXFoundry has a lot of choices for exporting the data (export to databases, to message brokers etc.). From those choices a MQTT message broker is selected to be the place where the data will be exported and this decision is made mainly for the whole solution to be universal. In this manner, the data will be available to any kind of application which has subscribed to the specific topic of the MQTT broker. Afterwards, the IoT platform, or in other words, the web application user interface has a connector part which subscribes in the specific topic of the MQTT broker, read measurement data of the desired WSN (contained in the MQTT JSON messages), parsing them, and store them to a remote time series database, such as InfluxDB, for visualization and other purposes.
I. Wireless Sensor Node (WSN)
The wireless sensor node (WSN) is composed of an energy harvesting module, several sensors, a microcontroller unit (MCU) and a radio transceiver. The MCU is an Arduino Nano 33 BLE which uses a nRF52840 that already includes an integrated transceiver. The WSN is placed on a hot spot of the underside of the car where thermoelectric materials can be used to tap the heat flow for electricity generation. This electric current is slowly stored in a super-capacitor until enough energy is available for a full measurement cycle, then a conditioning circuit is activated to provide stable power for the rest of the WSN. A thermoelectric energy generator (TEG) is adopted in the automotive case because as experimentally proved, thermoelectric phenomena happening during vehicle movement may produce a higher amount of energy compared with other generators, exploiting other phenomena, such as piezoelectric energy generators (PEG). However, since the proposed work focuses on the ultra-low power needed for power on the WSN (1st energy harvesting scenario), independently of the adopted EHS, it is out of the scope of this study to describe the way of energy generating and storing.
The sensors include a fuel-level transductor and some micro electro-mechanical systems (MEMS). The fuel-level sensor is a simple variable resistor that can be directly measured from the microcontroller in a very short time and the discrete MEMS sensors include a three-axis accelerometer, gyroscope, and magnetometer (LSM9DS1) and a pressure sensor (LPS22HB), both connected to the microcontroller over serial interfaces.
II. IoT gateway
As mentioned before, in essence, an IoT gateway is the bridge between the sensors field and the application user’s interface. In other words, it is a bridge between WSNs and the IoT platform. Its main role is to concentrate sensors data originated from various WSNs. It also acts as a short-term storage of the collected data for ensuring lossless transmission, while has data processing and data transformation/harmonization capabilities. The IoT gateway is capable of transmitting the data using both wired and wireless communication protocols such as Ethernet, Wi-Fi and LTE.
As a physical IoT gateway, Raspberry PI 4 model B (Fig. 6a) is selected among other competitors, since it presents a lot of advantages: it has built in Wi-Fi and Ethernet communications for transmitting the data to cloud or to other backend server and it also supports Bluetooth communications for connecting with the WSNs (Fig. 6b) and gathering the measurement data. It can also readily be extended in order to support other communication protocols such as LTE and LoRaWAN. Moreover, a powerful operating system can be installed in a Raspberry giving it a lot of opportunities for software usage and development.

Figure 6: (a) Physical IoT gateway: Raspberry PI 4 model B, (b) WSN
As the main software of the IoT gateway, EdgeXFoundry is selected, which in essence is made up of a collection of micro services, each of which runs in a container. Microservices communicate with each other over REST API interfaces.
EdgeXFoundry is an open-source software and its exploitation provides the gateway with various capabilities, such as secure exchange of measurement data between the sensors field and the IoT platform, exporting data to remote databases or message brokers for consuming from different applications, creating rules for filtering the data and sending appropriate notifications and alerts. Fig. 7 shows the platform architecture of the EdgeXFoundry.
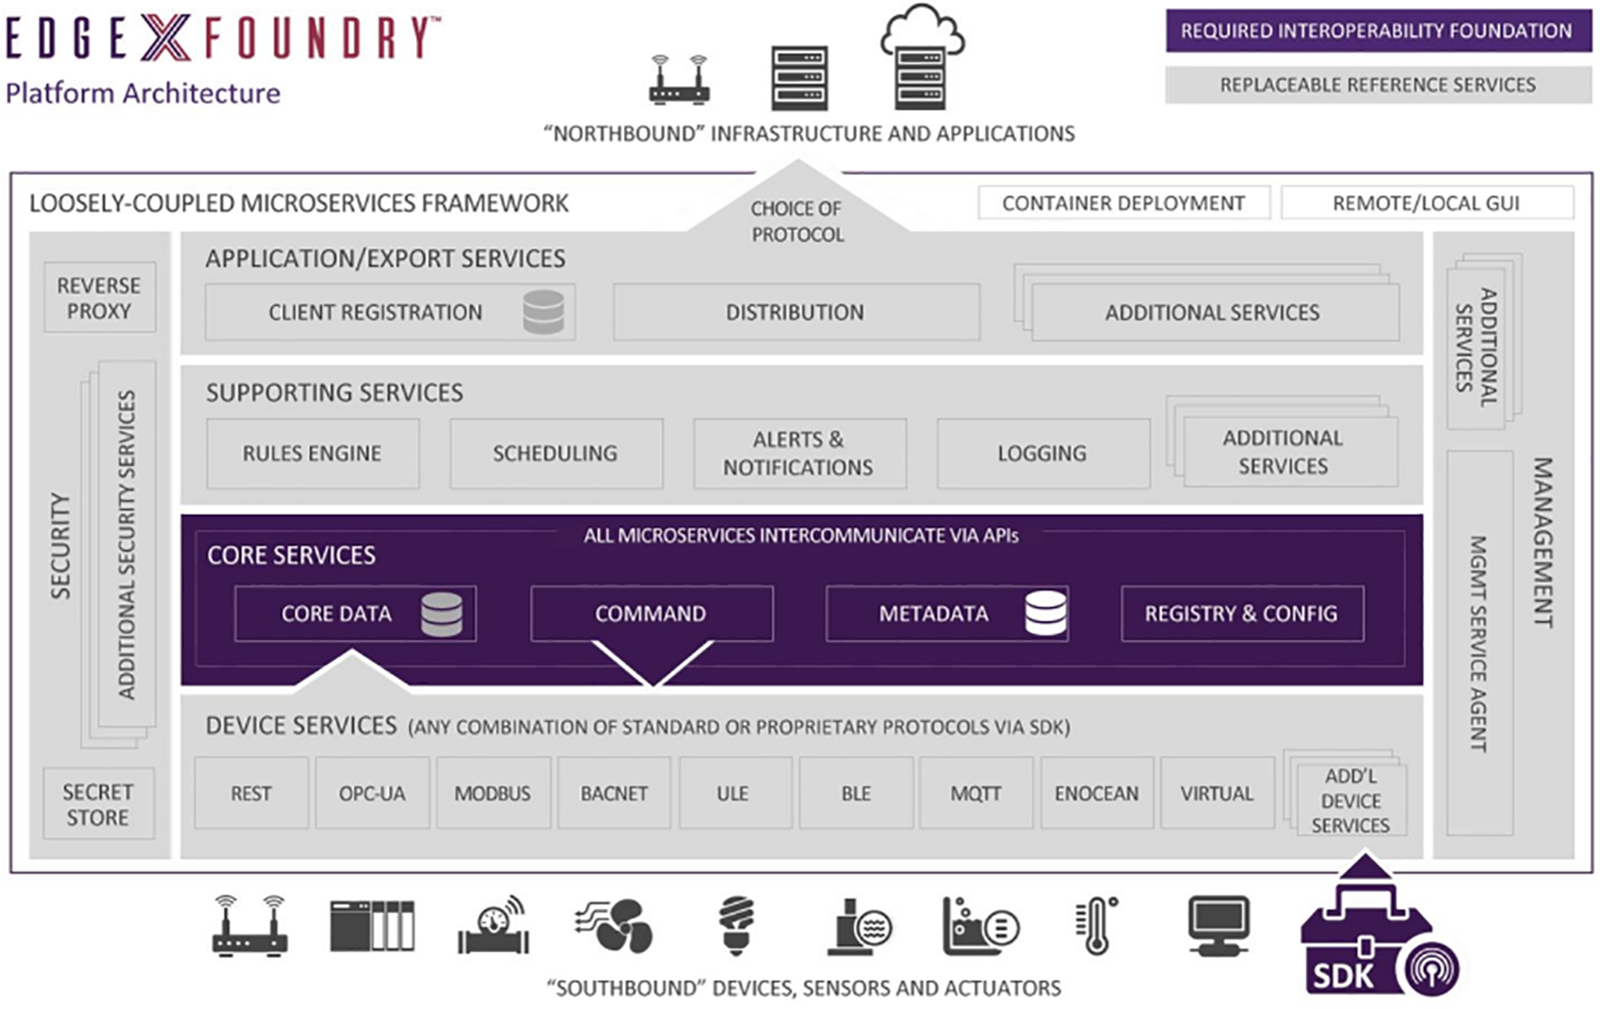
Figure 7: EdgeXFoundry platform architecture [15]
EdgeXFoundry gets the information coming from the sensors field, transforms it and delivers it to the desired applications over various network communication protocols and in various formats that meet the needs of the users’ applications. In the opposite direction, takes data or commands from the application side and delivers them to the edge nodes for updating, controlling and actuation.
As shown in Fig. 7, EdgeXFoundry is mainly divided into four service layers. Device services are the edge connectors interacting with the IoT objects (sensors, devices) either for getting data or for controlling devices in the sensors field. Core services contain the most of the knowledge about the IoT objects that are connected, the type and the format of data flowing through EdgeXFoundry and about the whole configuration of the current EdgeXFoundry deployment. Supporting services include microservices such as edge analytics, logging, scheduling and data cleaning and finally, application services are the means to process, transform, extract and transmit the data from EdgeXFoundry to an endpoint or application based on user needs. Apart from these basic service layers, EdgeXFoundry also has security and management services layers which are used for protecting data and IoT objects managed by EdgeXFoundry and system management operations for configuration and monitoring of the different operations respectively.
Fig. 8 depicts the basic communication between WSN and IoT gateway. As shown in Fig. 8, WSN is equipped, apart from a microprocessor (Arduino Nano), with a communication module (BLE). Bluetooth Low Energy is regarded as a different technology from Bluetooth classic, that targets applications where the demand is for ultra-low power rather than high throughput. Data communication with BLE is based on short bursts and has low frequency. BLE periodically turns on the radio, transferring or receiving a few kilobytes of data, and then switching to sleep mode.
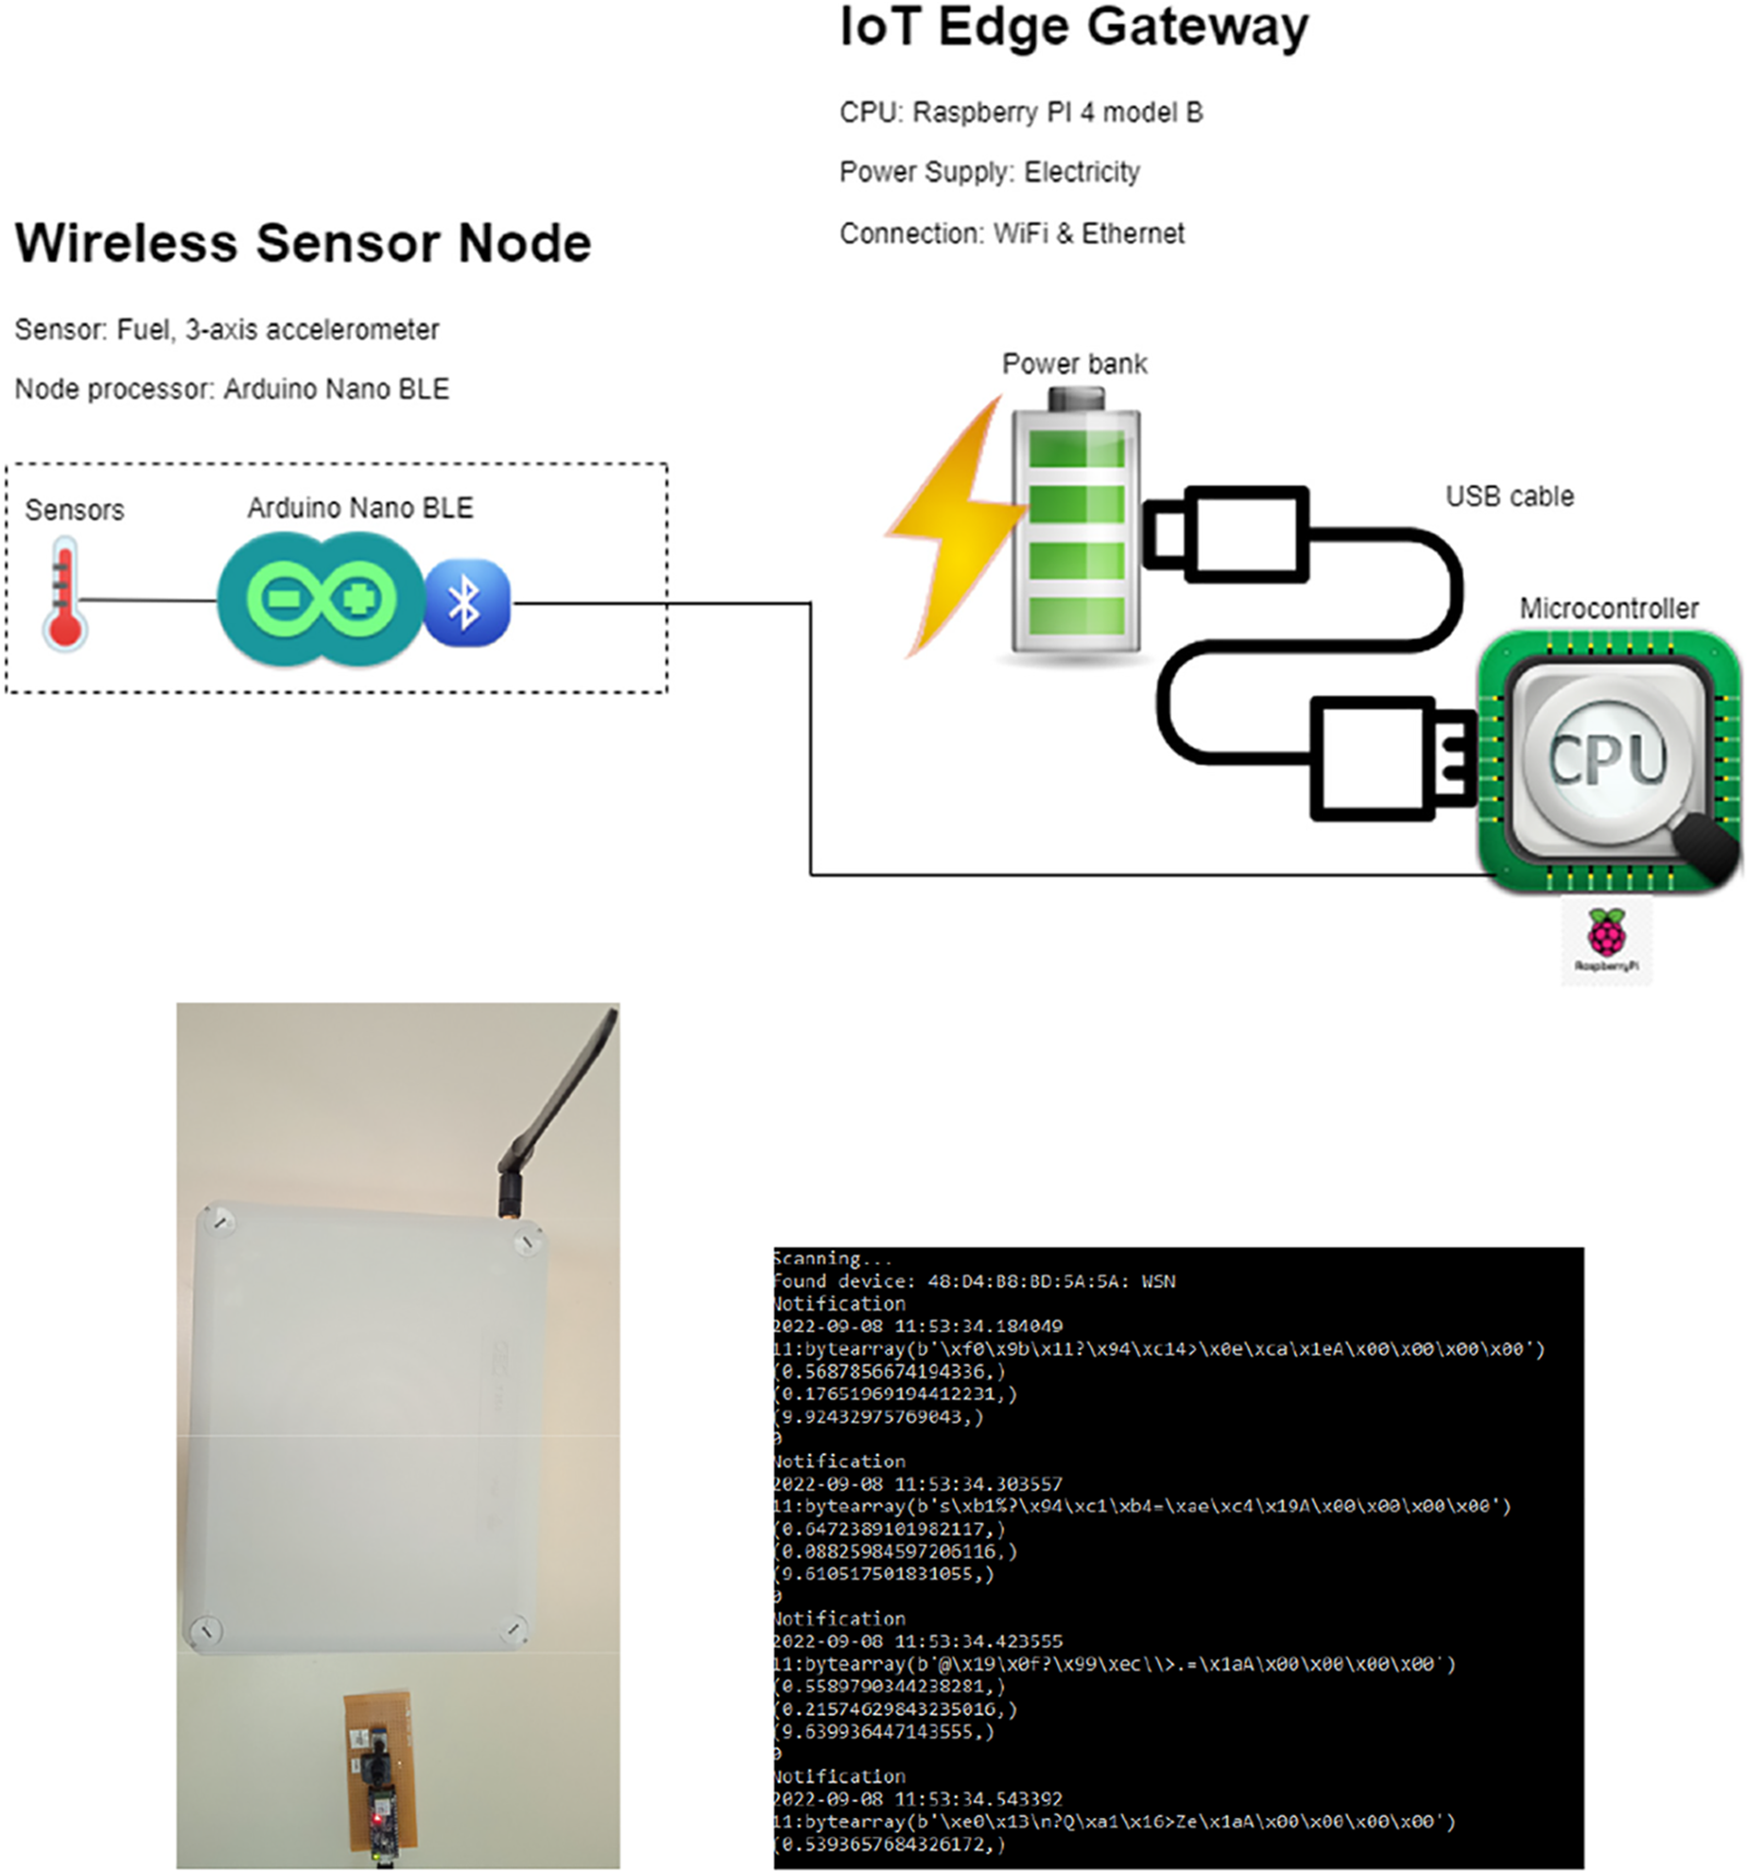
Figure 8: Interconnection between WSN and IoT gateway
Thus, WSN is powered off most of the time. It powers on only when available energy is supplied by the energy harvesting system, advertises packets that contain the measurement data and then powers off. IoT gateway is always in standby mode waiting for packets to arrive from the specific WSN, identified by its MAC address. It concentrates the measurement data coming from WSN and stores them in a temporary buffer.
Afterwards, the data is available in the IoT gateway and it can be further processed or sent directly (raw data) to the IoT platform. The IoT gateway offers a variety of choices for processing and transmitting of the measurement data. The data can be temporarily stored in a buffer, or alternatively can be sent (via HTTP requests) to the REDIS database of the EdgeXFoundry for the same reason. When a stable network has been established the data can be transmitted to the IoT platform either directly or via a message broker. Finally, the measurement data will be permanently stored in the remote database of the IoT platform.
The interconnection between IoT gateway and IoT platform is performed using the MQTT message broker, which acts as a mediator and implements the aforementioned publish—subscribe mechanism.
MQTT is a lightweight publish-subscribe network protocol. It is more appropriate for network connections with resource constraints or limited network bandwidth. It runs over a transport protocol such as TCP/IP. It defines two types of network entities: message broker and client. A MQTT broker is a server that receives the messages from the clients and also routes them to other clients. Messages are organized in a hierarchy of topics. Each publisher can send a message, containing the data which it wants to distribute, to the message broker. Message broker then distributes the messages to the clients which have subscribed to the specific topic. Thus, the publisher does not need to have any idea either about the number of clients interested in the specific topic’s messages or the locations and the specific characteristics of the subscribers. MQTT is a bi-directional communication protocol. Each client can act both as publisher and subscriber in a manner that can both send data and get control messages for controlling devices.
In general, MQTT sends connection credentials in plain text format and does not include any measures for security or authentication. This can be provided by using TLS to encrypt and protect the transferred information. Moreover, MQTT has large scale capabilities and performs reduced network strain sustaining security of transactions.
Thus, a client is initiated by the IoT gateway and publishes the measurement data in JSON format to the MQTT broker in the topic WSNData. In the sequel, the IoT platform, which is interested in the published data in this topic, also initiates a client which acts as a subscriber in the WSNData topic. The messages gathered by the MQTT client, parsed by the application and then stored permanently in a remote time series database on the side of the IoT platform.
The topic called WSNData is the topic where the client setup by EdgeXFoundry publishes the measurement data that comes from the WSN. The MQTT messages have been transformed in a JSON format which contains, apart from the measurement data (fuel level, 3-axis acceleration), information about the name of the device (WSN) from which the data originated and a timestamp of the observation of the specific measurement.
Fig. 9 shows a sample of MQTT messages in JSON format in the WSNData topic produced after reading the serial port of the IoT gateway. As mentioned, a MQTT message contains the values of the fuel level and the 3-axis acceleration as also shown in the above figures.
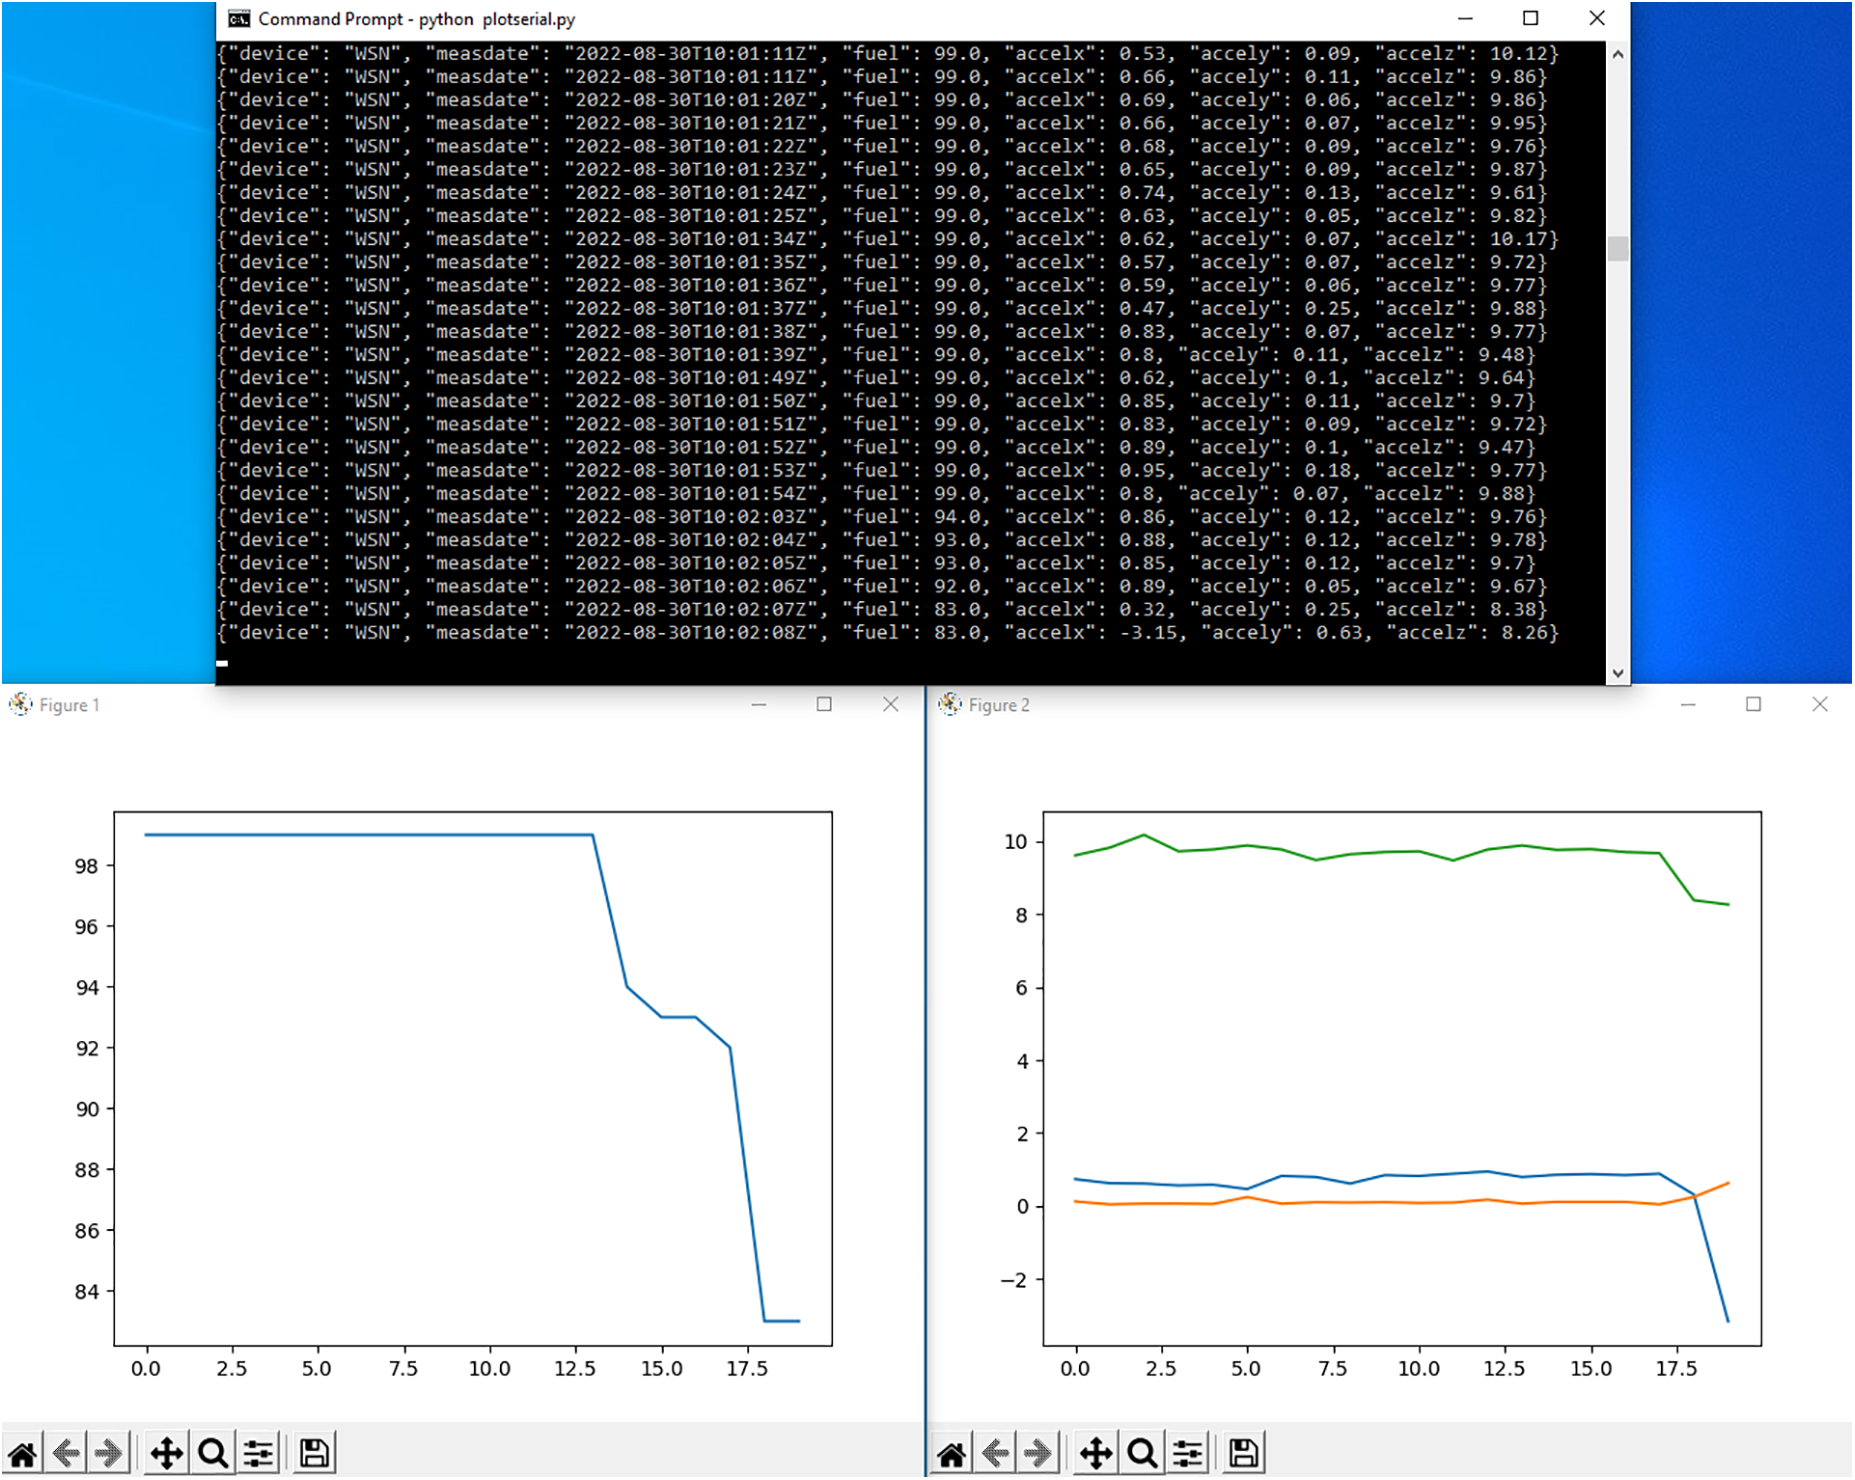
Figure 9: MQTT WSNData topic (top), Fuel level values (bottom left), 3-axis acceleration values (bottom right)
III. IoT platform
IoT platform is the final destination where the data arrives at. Its main goal is to visualize the measurement data in a user-friendly and meanable way by using graphs and/or charts. Thus, it is a powerful web user interface (UI) that uses well known and widely used software libraries for data visualization and representation.
The measurement data comes from the IoT gateway to the IoT platform through the MQTT message broker. A client is initiated in the IoT platform, which acts as a subscriber in the WSNData topic. The messages gathered by the MQTT client, parsed and then stored permanently in a remote relational (Fig. 10) or time series database on the side of the IoT platform. From this database the measurement data are available both for visualization and for controlling purposes. Users through the IoT platform can send feedback to the sensor field for performing some control or activate some actuators for avoiding undesired effects or situations.
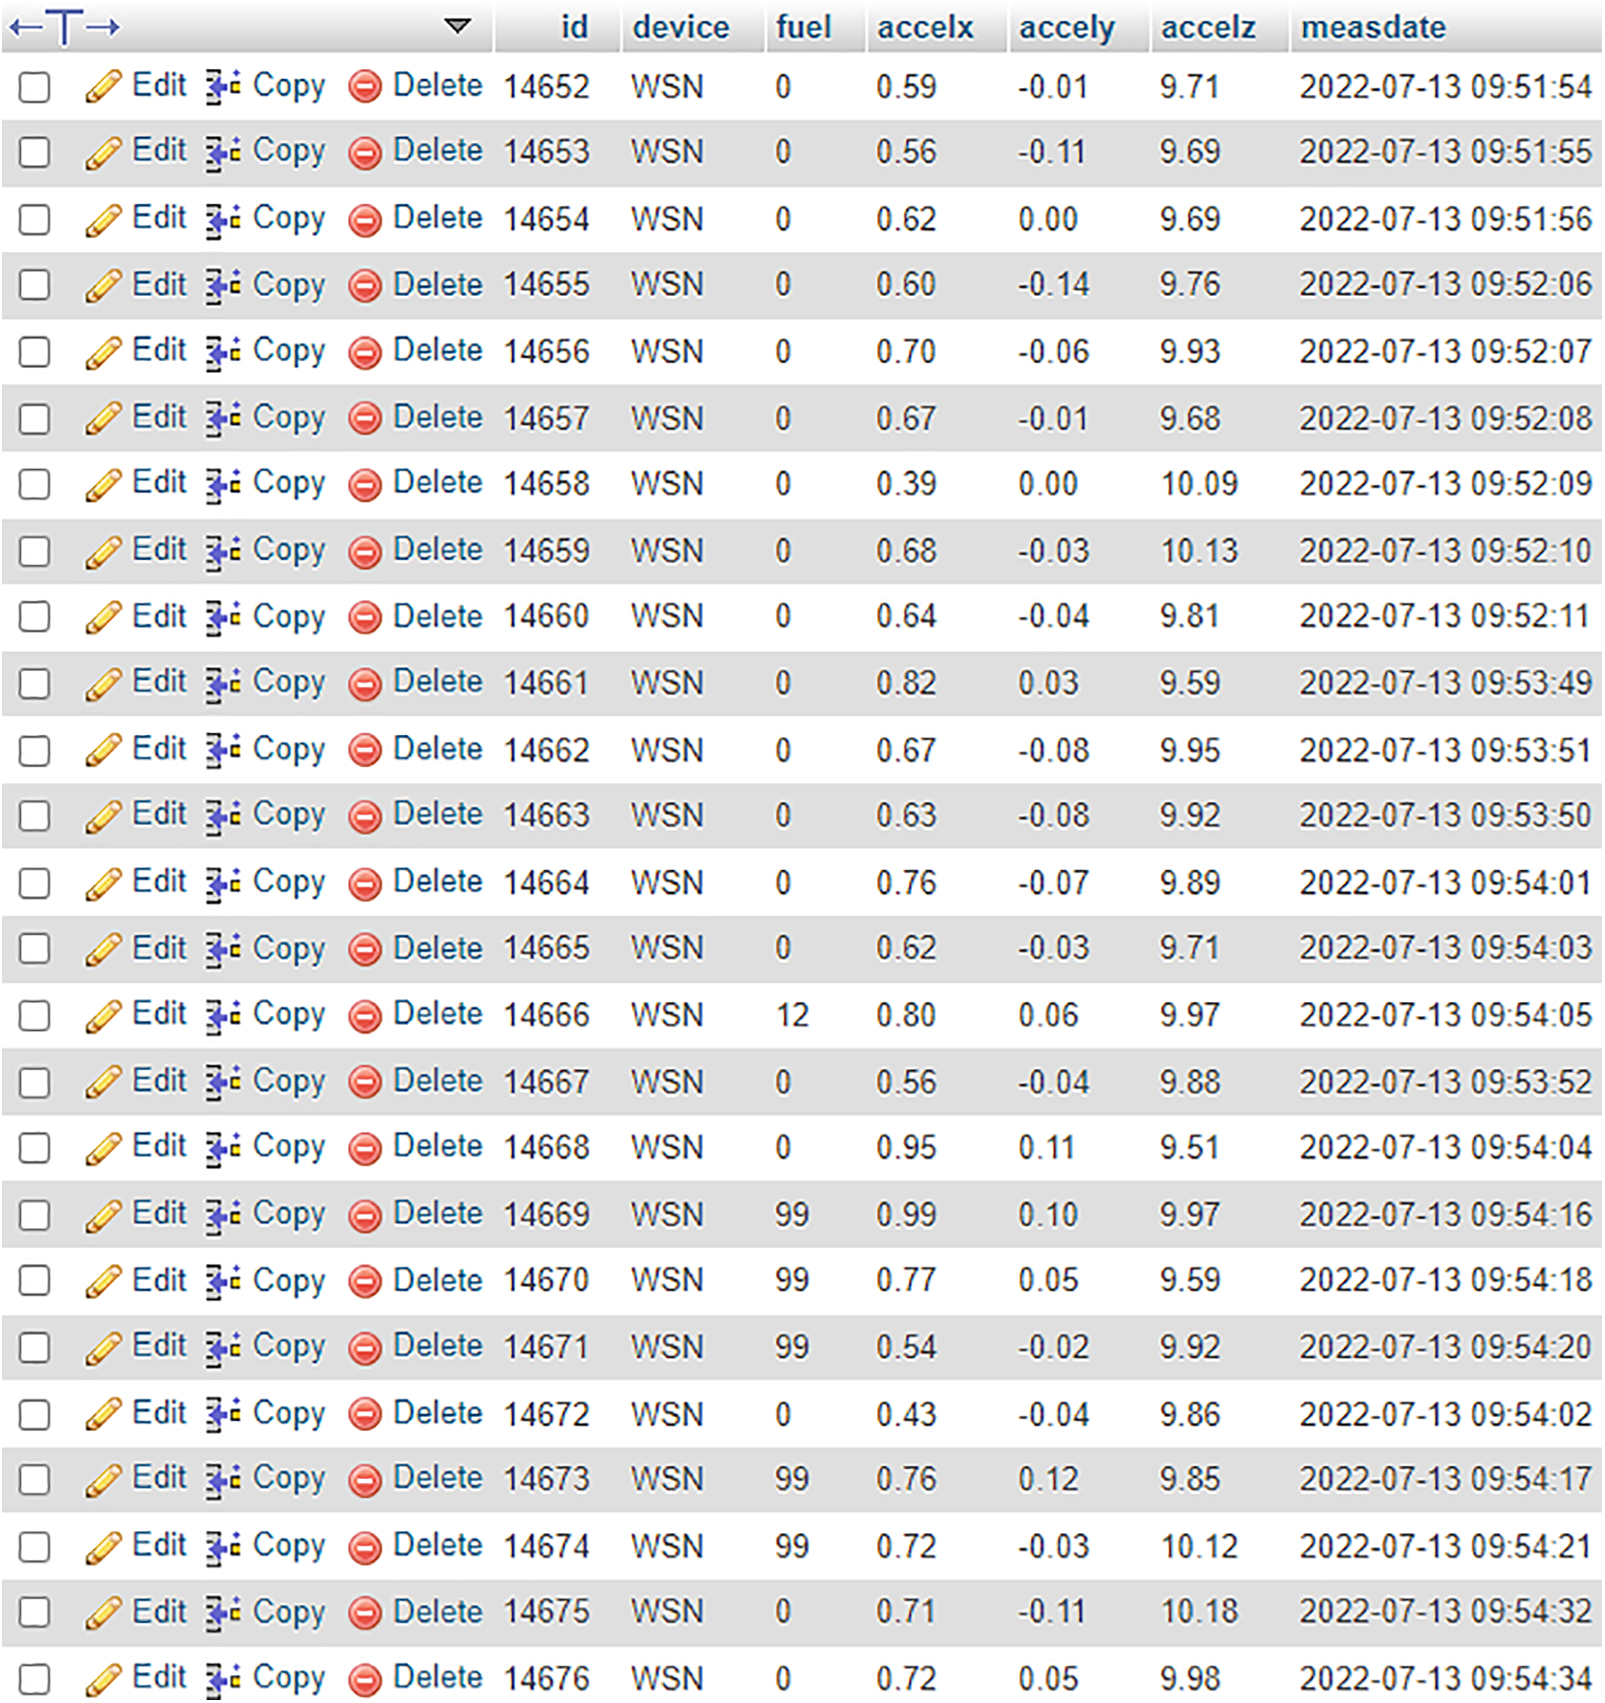
Figure 10: IoT platform—Database (MySQL)
Fig. 11 illustrates the home page of the IoT platform which shows a car sketch with the sensors superimposed as icons in the selected installation locations. There are two icons for fuel level and accelerometer sensor.
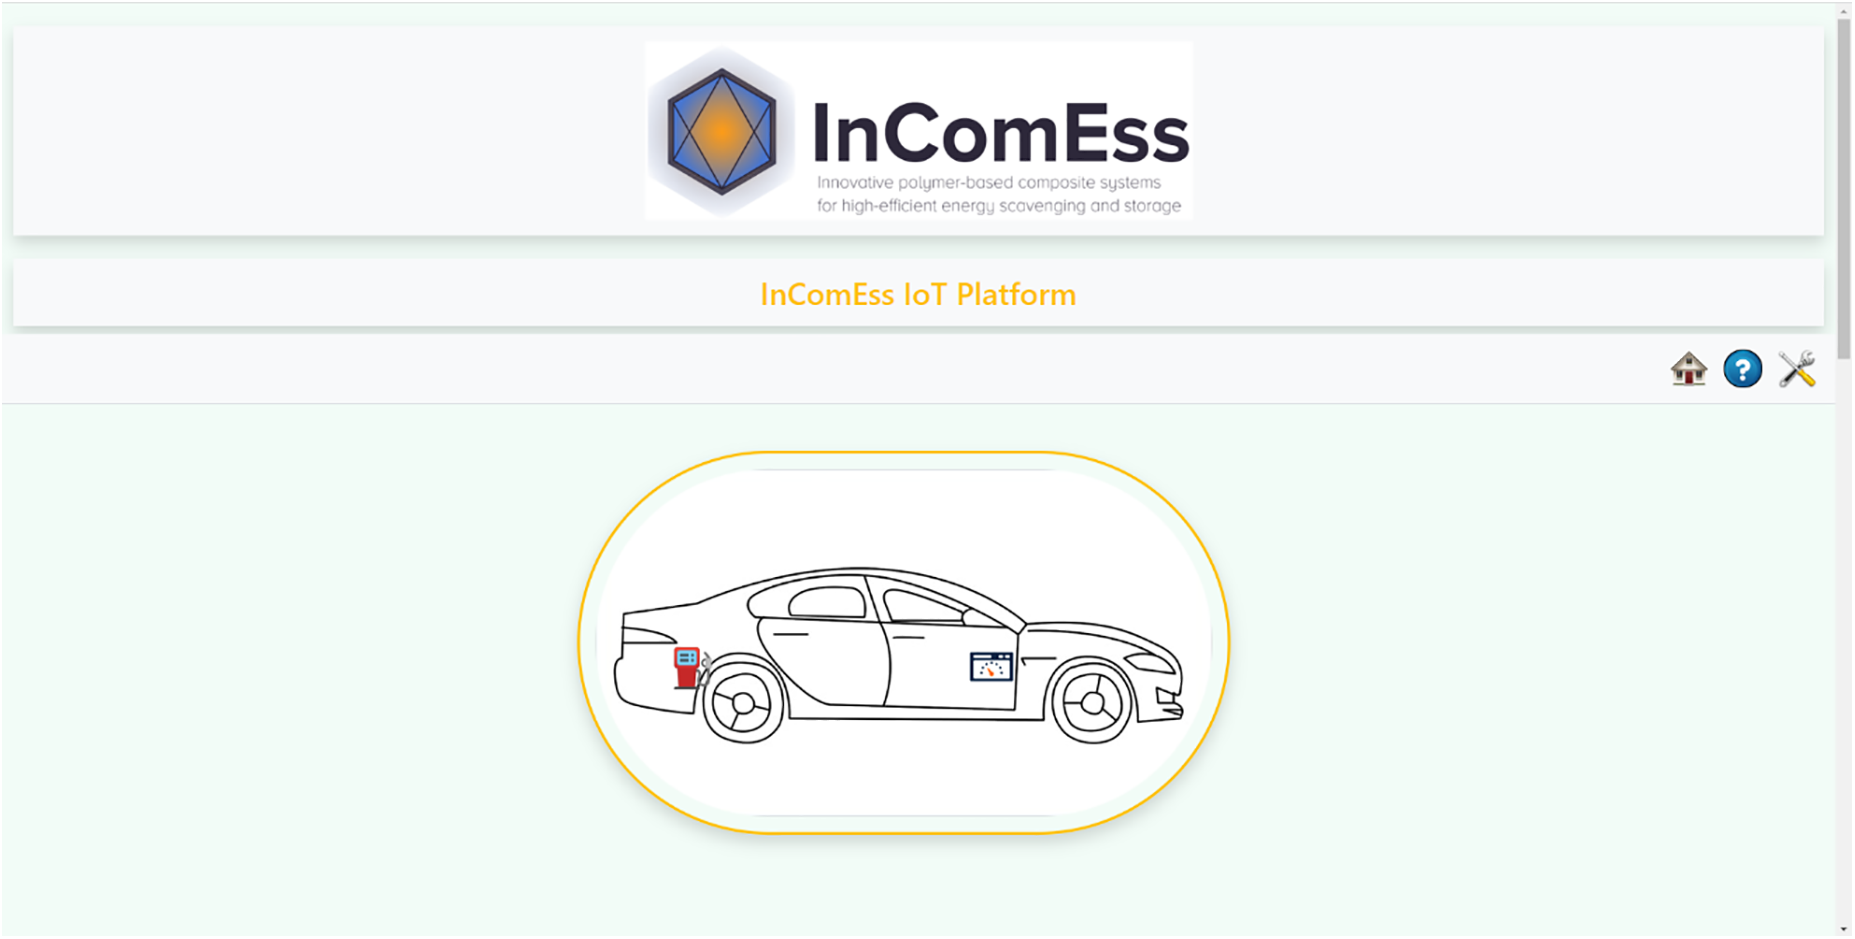
Figure 11: IoT platform
The user of the IoT platform can obtain the measurement data directly when these are available, in an almost real time manner. It also has the capability to observe the last measurement of the specific parameter by hovering on the corresponding sensor’s icon (Fig. 12). By clicking to the same icon user can show or hide a graph with the real sensor data (Fig. 12).
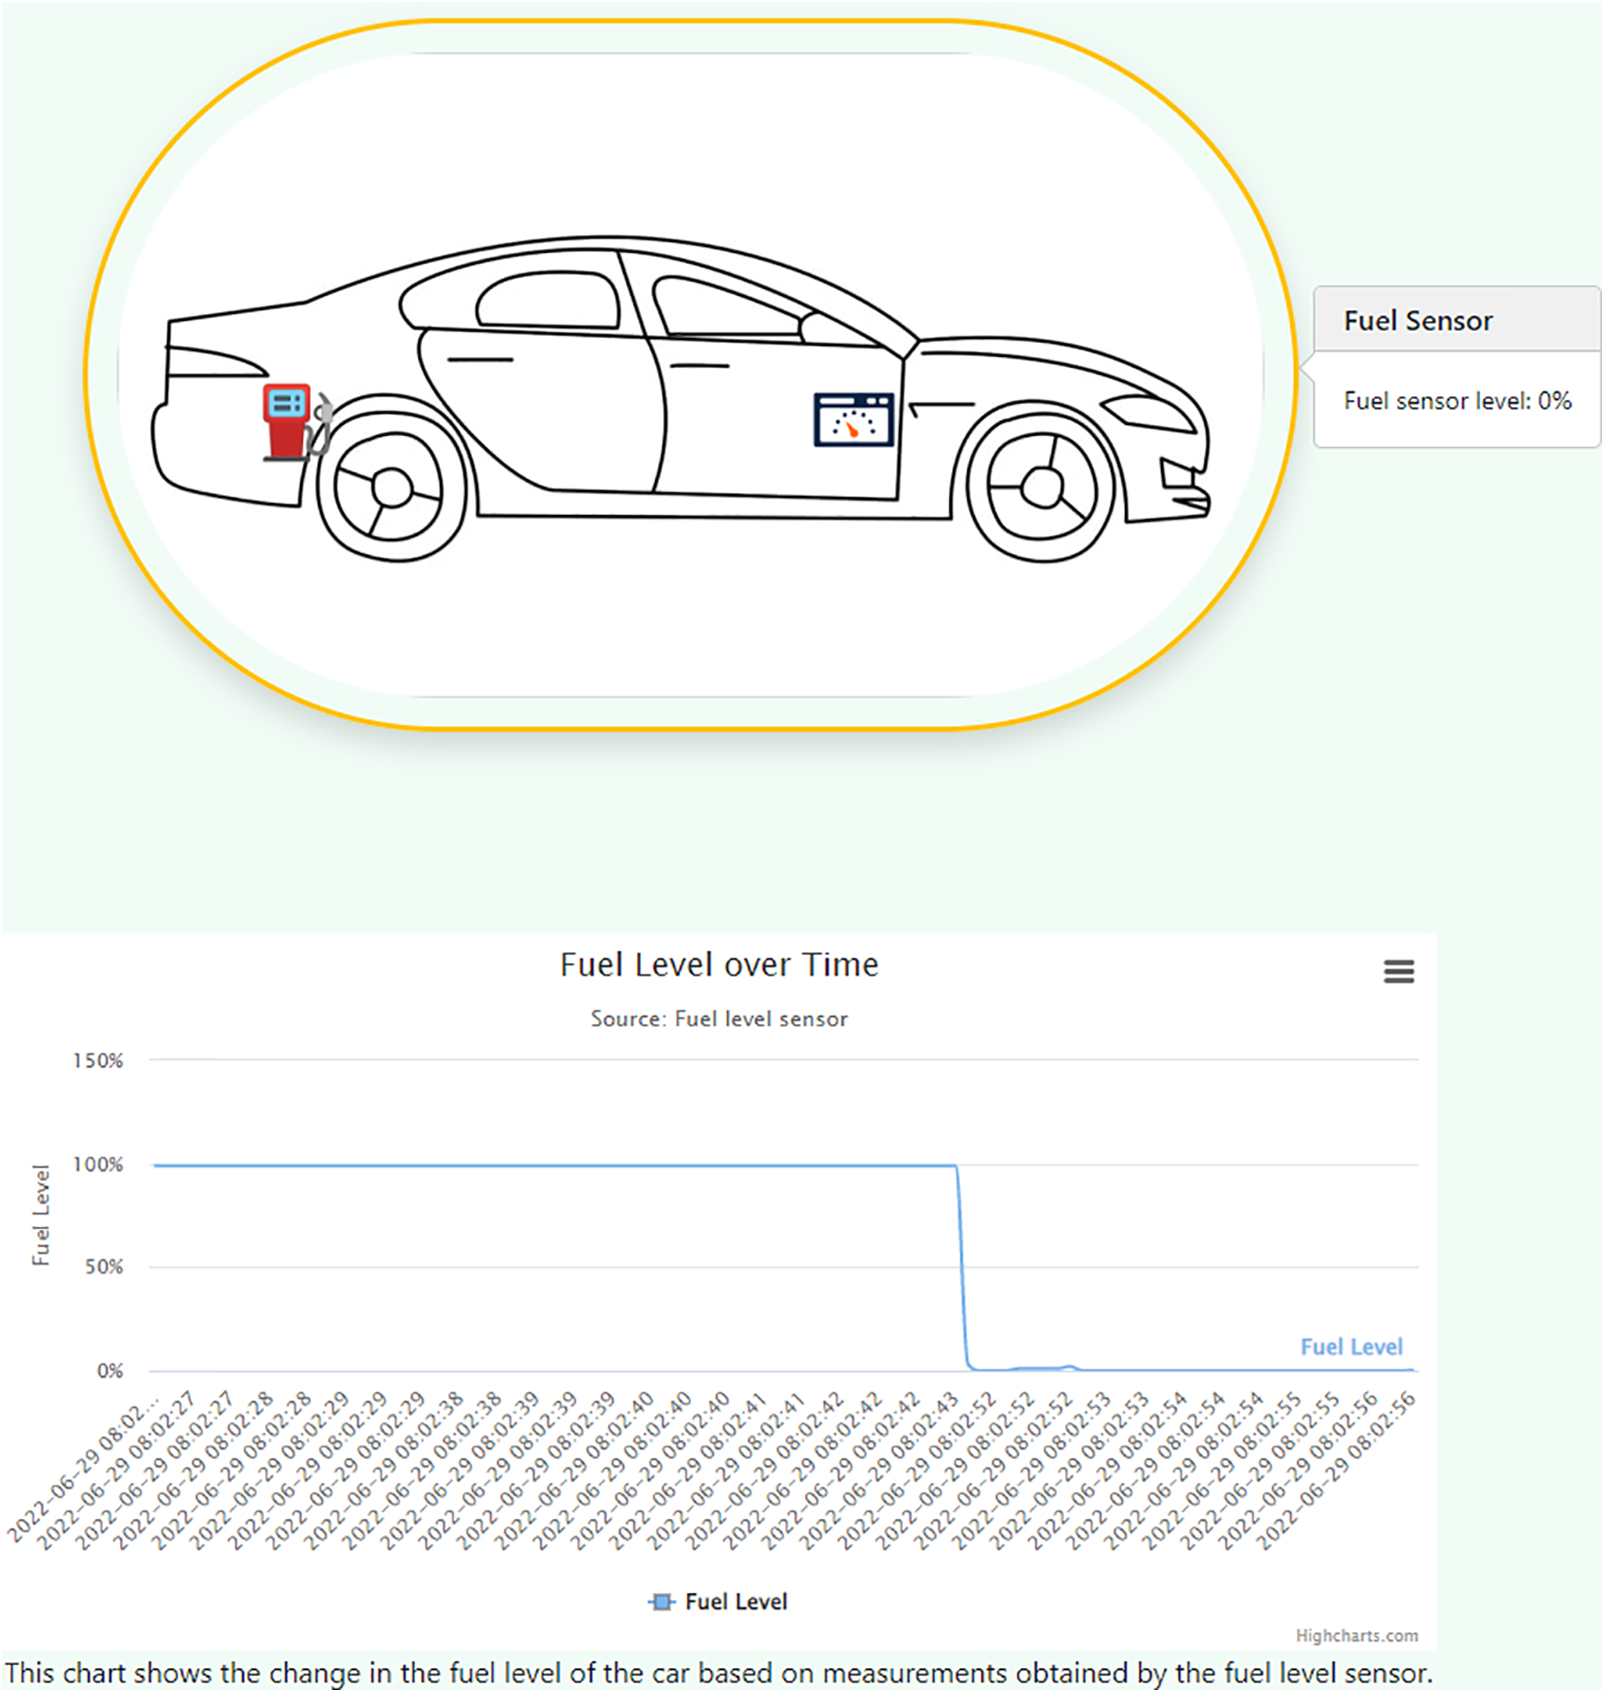
Figure 12: Fuel level measurement data
Users also have the capability of simultaneously observing fuel level and acceleration sensors measurement data by clicking both icons (Fig. 13).

Figure 13: Fuel level and 3-axis acceleration sensors measurement data
Apart from the above visualizations, users have the capability to explore in history measurement data by selecting the corresponding menu item. Fig. 14 shows the history data table showing past measurement and providing the user with sorting and filtering capabilities.
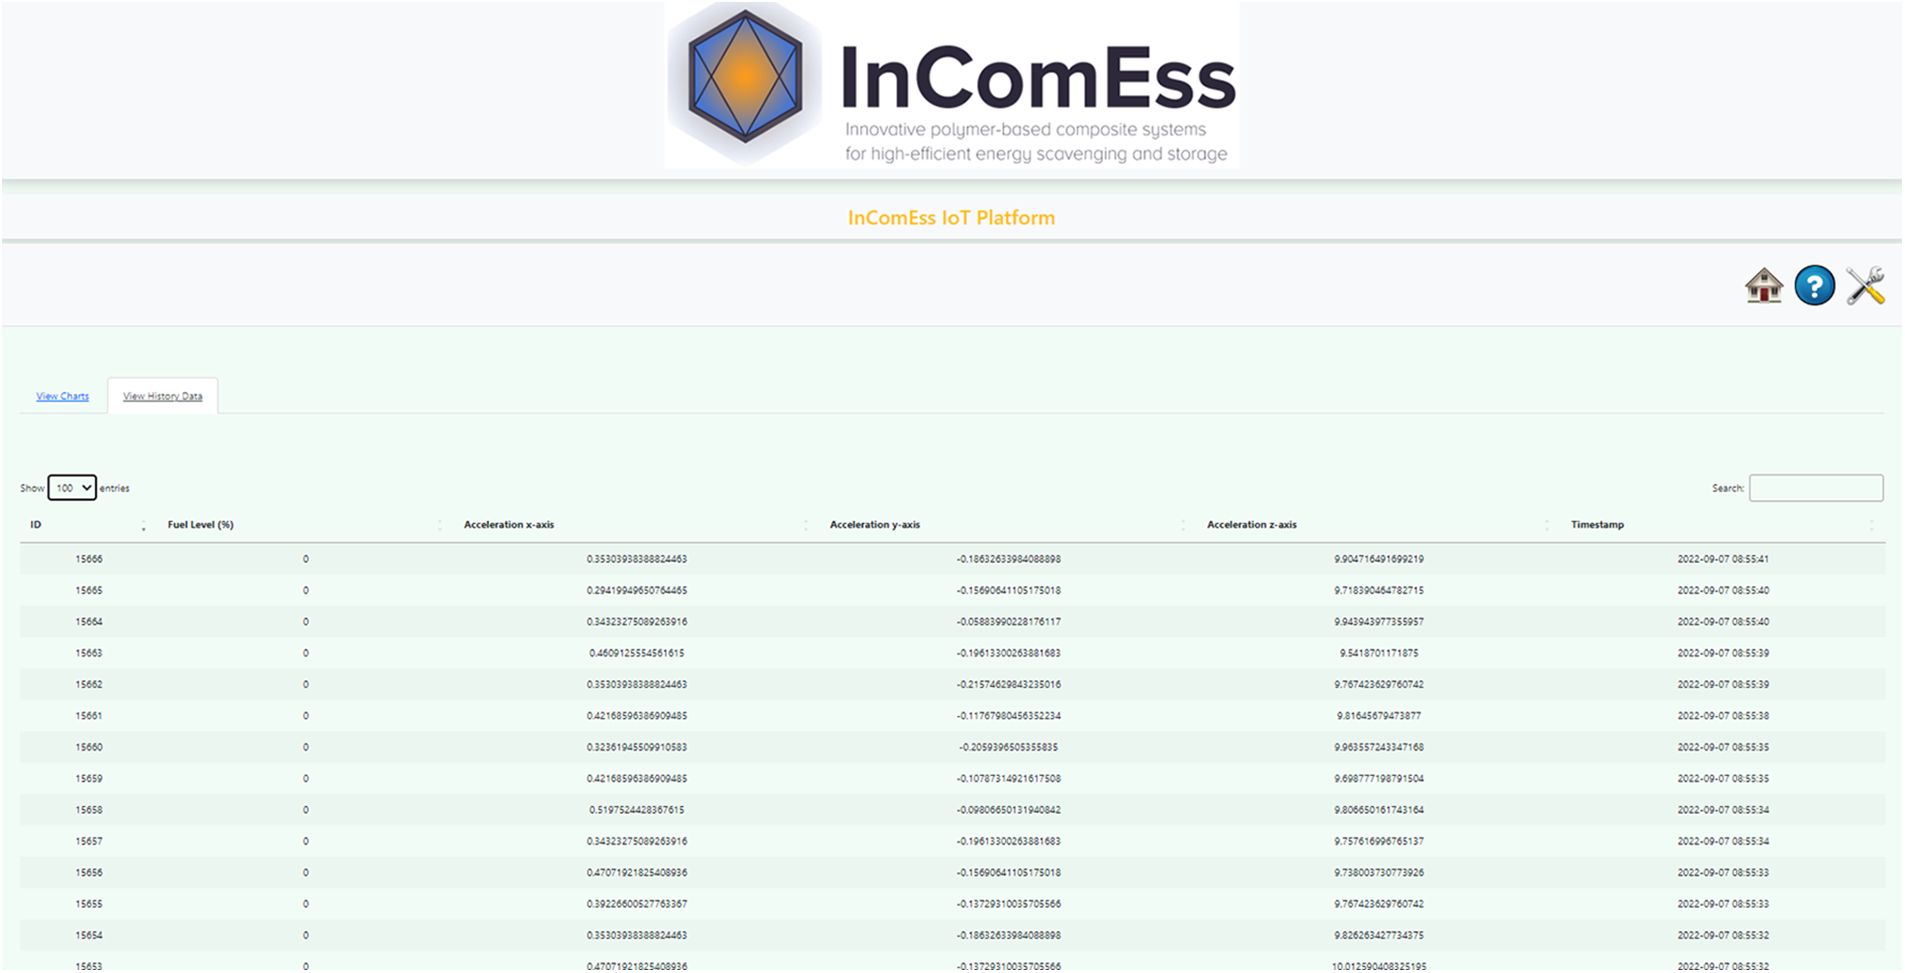
Figure 14: History data table
Furthermore, email alerts automatically send to users when the value of a specific sensor (i.e., fuel level sensor) is under a predefined threshold. Simultaneously, an appropriate indicator is superimposed in the corresponding graph (i.e., fuel level graph) to visualize the same kind of alert.
3.2.3 Scaling of the Proposed IoT Solution
The proposed IoT solution can be extended to be used for a fully automated monitoring of a vehicle fleet. Each vehicle monitored by the IoT system has to be equipped with a WSN, measuring crucial parameters about it, and an IoT gateway, which is responsible for gathering the data from the WSN and transmitting them to the IoT platform. The IoT platform has to collect the measurement data coming from different WSNs, installed in the vehicles and present them to the end user using interactive plots and charts. Moreover, it is responsible for analyzing the data, using machine learning and artificial intelligence algorithms, and performing decision making for preventing some undesired situations, based on well-established predefined criteria. The IoT system is scalable and can support a large number of vehicles, with a lot of parameters measured on them, thus being applicable to various cases. Fig. 15 shows the basic structure of the proposed IoT vehicle fleet management system.

Figure 15: IoT vehicle fleet management system
The scaling of the proposed IoT solution reveals the main advantage of monitoring fuel level and vehicle acceleration on a remote server. That is to provide the end user with fully automatic business solutions, such as fleet management. Continuous monitoring of parameters such as fuel level and acceleration for a number of company’s vehicles leads to optimization of the resources management and also improves the security level of the business equipment. Fuel level sensor and 3-axis accelerometer are two examples of sensors and as mentioned before, the proposed solution is scalable and extendable according to user needs.
I. Evaluating various Architectures
As mentioned before, Fig. 5 shows the proposed IoT Architecture. Fig. 16 shows the other three architectures evaluated before concluding with the proposed. All architectures follow the three-tier architecture model presented so far. The first two architectures presented in Figs. 16a and 16b utilizes BLE communications [16] in order to exchange measurement data between WSN and IoT gateway. The main difference is in the way which IoT gateway communicates with the IoT platform. In the first case, communication is direct, by using a REST API service, while in the second is through a MQTT message broker [17]. The main drawback of these architectures is that they assume that the interconnection between the IoT gateway and the IoT platform is stable. However, the internet connection in a moving vehicle is in general unreliable. Thus, both architectures suffer from the danger of loss of information and at least a buffering solution has to be implemented to tackle this problem. The third architecture presented in Fig. 16c is slightly different. First of all, it utilizes EdgeXFoundry for buffering measurements by temporarily storing them to the local REDIS database. Moreover, it uses a Data logger for gathering measurement data and sending them to the serial port of the IoT gateway, presenting improved signal integrity and transmission speeds. However, it requires more components and thus the complexity of the whole system and the possibility of failure are increased.
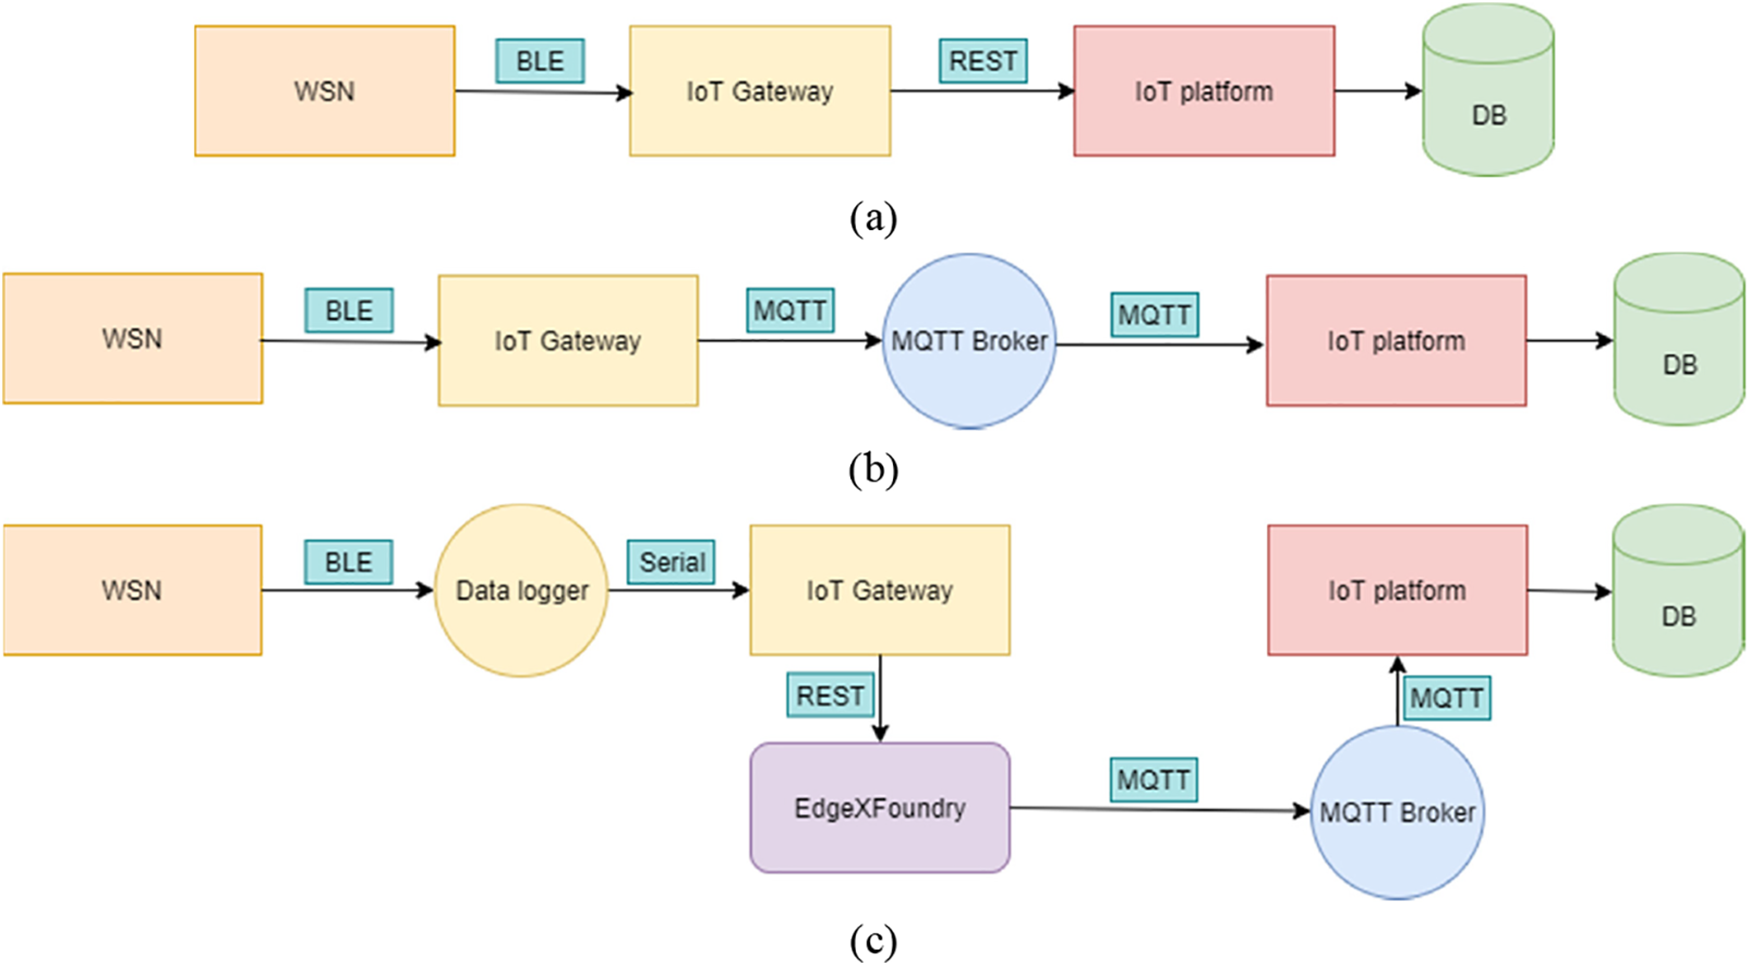
Figure 16: Various architectures: (a). BLE-REST, (b) BLE-MQTT, (c) BLE-SERIAL-REST-MQTT
II. Full system testing
The whole system has been tested both in a lab environment and in a real vehicle by using a WSN prototype designed and developed in a laboratory, an IoT gateway equipped with the appropriate software and a IoT platform web application hosted in a virtual machine. Fig. 17 shows the testing of the whole system in a lab environment (TRL-4).

Figure 17: System testing in a lab environment
III. Energy consumption metrics
Sensors and wireless communications were tested in the laboratory to measure the energy requirement for the WSN. The results are shown in the Table 1 below and correspond to a single sensor measurement and subsequent transmission to the IoT gateway.
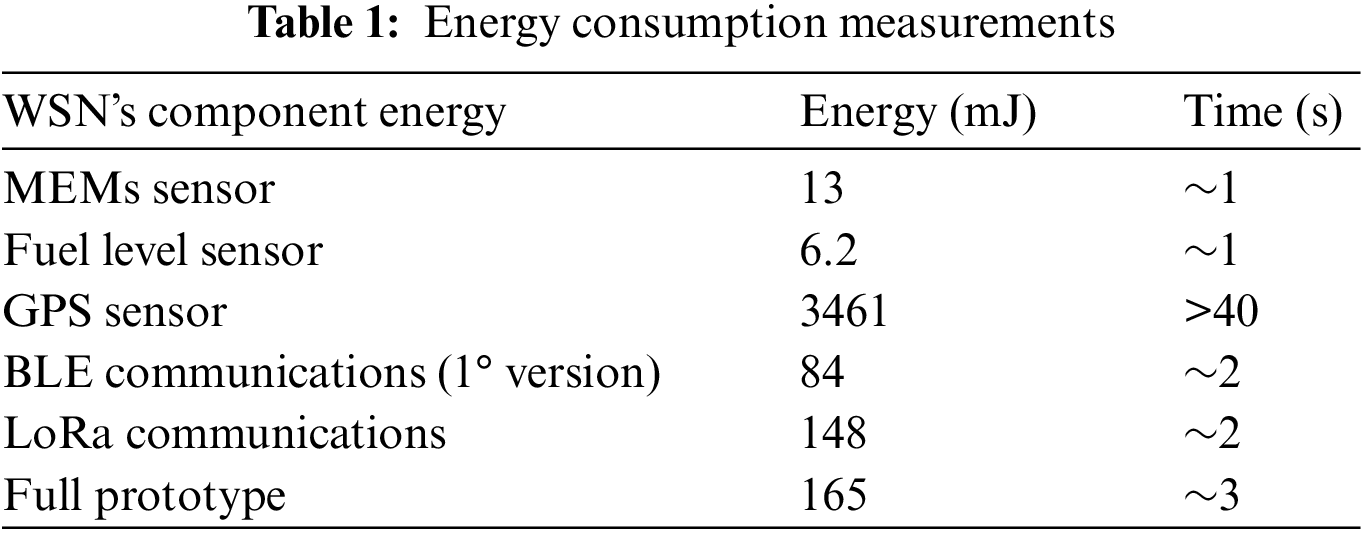
The MEMs sensor is a LIS3DH Triple-Axis Accelerometer and the fuel level sensor is a simple resistive sensor. Both have a very low energy consumption which should be suitable for ultra-low power conditions. However, the MTK3339 GPS sensor consumes orders of magnitude more and takes a very long time to take measurements. This is due to the functioning principle of GPS, which requires orbital data to be gathered from many satellites and kept constantly updated. The orbit data is composed of almanac data and ephemeris data broadcasted only every 12.5 min and 30 s respectively. Unless the sensor is kept running constantly, updating this data takes a long and unpredictable amount of time thus increasing energy consumption. This makes the GPS sensor unsuitable for the extreme energy harvesting conditions. The BLE wireless communications were tested using a NINA-B3X module and the LoRa using a Murata CMWX1ZZABZ. Without the GPS sensor, it was decided to substitute the LoRa communications for BLE since it should be possible to further integrate it with the car’s Bluetooth system. This would be especially useful for sensors measuring parameters that change relatively slow, such as temperature, wear or fuel level. For these tests, prototypes of the final WSN were developed and tested. The closest to the demonstrators included the MEMs and fuel level sensor and BLE. It was measured to consume 165 mJ for a single measurement and wireless transmission. Fig. 18 shows the current consumption of this prototype.

Figure 18: Prototype energy consumption profile
The microcontroller and the BLE module are both contained inside the same integrated circuit, the nRF52840. Compared to having separated electronic components, this high level of integration usually results in an overall lower power consumption. It is available in a small module (NINA-B30 series), with an integrated antenna, that can be easily added to custom printed circuit boards. Several low-cost commercial platforms are already available with this microcontroller and several sensors, lowering the development entry barrier, such as the one used here, the Arduino Nano 33 BLE Sense.
Further optimizations were made to heavily reduce peak and total energy consumption of the WSN, and to test the integration of the prototype with the IoT platform. This methodology enabled a consumption optimization greater than an order of magnitude, reducing the required energy from 165 to less than 10 mJ for the lowest possible voltage of 1.6 V. However, since it is expected that the rest of the equipment would operate on a standard 3.3 V instead, it has finally achieved the target of an energy requirement of 20 mJ. Moreover, the minimum storage capacitance has been determined to be approximately 2 mF.
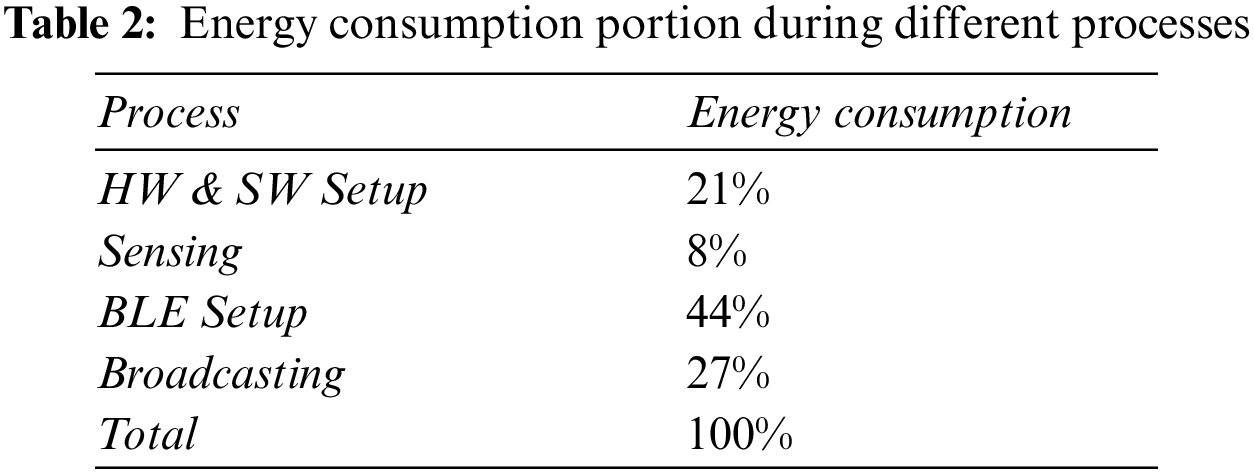
Consumption measurements are performed using the amperemeter Power Profiler Kit II which features a logic analyzer that is used to record traces of the internal program states. This makes it possible not only to calculate the overall energy expenditure but also to sort it out into multiple segments that directly correspond to portions of the source code (up to 256). Therefore, an energy profile is constructed, allowing developers to practice energy-aware programming and to focus optimization efforts, as shown below in Fig. 19. This profile shows how much each different stage of operation consumes: most energy is spent at the initialization of the hardware and software stack (21% SETUP + 44% SETUP_BLE), then the broadcast itself (27%) and finally the actual measurements consuming the smallest portion (8%). These results are summarized in Table 2.

Figure 19: Development environment featuring the WSN attached to the power profiler tool
The smallest capacitor sufficient to hold the energy needed is about 2 mF and, given a sufficiently high charging rate, measurements can be sent almost every 10 s. Such measurements are packed into a binary structure, thus requiring some pre-processing to extract the actual sensor data after reception. These payloads are transmitted to the IoT gateway using a feature of BLE which allows some data to be included on the advertising packages, this makes the communication possible using simple broadcasts without needing further exchanges, much like the way Wi-Fi includes metadata like the network name which can be seen without actually connecting to it. Devices that use this communication paradigm are known as beacons. Consequently, the data transmission has been optimized to reduce the communication time and number of connections by utilizing broadcasts, following the paradigm of Bluetooth Low Energy beacons.
IV. IoT Gateway Setup
Raspberry Pi 4 Model B is the latest product in the popular Raspberry Pi range of computers. It offers ground-breaking increases in processor speed, multimedia performance, memory, and connectivity compared to the prior-generation Raspberry Pi 3 Model B+, while retaining backwards compatibility and similar power consumption. For the end user, Raspberry Pi 4 Model B provides desktop performance comparable to entry-level x86 PC systems.
The dual-band wireless LAN and Bluetooth have modular compliance certification, allowing the board to be designed into end products with significantly reduced compliance testing, improving both cost and time to market.
For these reasons, Raspberry Pi 4 Model B was selected as the physical gateway of the proposed system. The software of the IoT gateway consists of scripts mainly written in Python, exploiting various libraries, and EdgeXFoundry, which make deployment simple and fast.
Bleak [18] is an acronym for Bluetooth Low Energy platform Agnostic Klient. Bleak is a GATT client software, capable of connecting to BLE devices acting as GATT servers. It is designed to provide an asynchronous, cross-platform Python API to connect and communicate with e.g., sensors. Bleak supports reading, writing and getting notifications from GATT servers, as well as a function for discovering BLE devices.
Based on Bleak library, a python script was developed in the IoT gateway, which discovers the WSN device in order to get the sensors data advertised by the WSN. Then, the measurement data were harmonized and sent to EdgeXFoundry in JSON format by using the appropriate REST APIs endpoint. The data is temporarily stored in EdgeXFoundry’s REDIS database and then exported in the desired MQTT topic.
EdgeXFoundry installed in the IoT gateway via docker. The microservices making up EdgeXFoundry are controlled by a docker-compose file written in YAML format. This file is in essence a configuration file, which describes the way each microservice should run and the corresponding ports, volumes and dependencies. Then, EdgeXFoundry can be started using docker.
The first thing we have to do after successfully running EdgeXFoundry, is to create a device. The device in our case is the WSN. Creating and registering a device to EdgeXFoundry is required in order for EdgeXFoundry to become aware of the existence of the device, to be able to receive data from and send commands to the device and also to understand the type and the format of data which it manages.
Adding a new device to EdgeXFoundry is a relatively easy procedure, which is performed by using a device profile. A device profile is a template describing the device. It is written in YAML format and it is uploaded in EdgeXFoundry via the EdgeXFoundry REST APIs. Three steps required for device creation: 1. Create value descriptors, 2. Upload the device profile and 3. Create the device. Each of these steps is accomplished by calling a specific REST API endpoint which determines what microservice will run.
Value descriptors are describing the sensors values. It determines the format and the label of the data. Thus, in our case four value descriptors were created (one for fuel level and three for the 3-axis acceleration). Then, the device profile of the device was uploaded in EdgeXFoundry and finally, the WSN device was created. After these steps the WSN device is fully recognized by EdgeXFoundry and EdgeXFoundry is ready to receive data from it and export them to an external source such as a MQTT topic in our case. To do this it is required to make the appropriate configurations inside the docker compose file, describing the MQTT broker (address, port) that will be used and the specific topic in which the data will be published by EdgeXFoundry. From this point, all data comes from the WSN, they are published to the specific MQTT topic and thus they will be available to any MQTT client interested in, by subscribing to this topic.
V. Wired and Wireless communication protocols support
In order to IoT gateway support LTE communications, an extra 4G component (Waveshare 4G HAT [19]) was used. This component has a port for a SIM card and it was placed on the top of Raspberry Pi 4 Model B. After performing some settings, Waveshare 4G HAT allows the IoT gateway to communicate with the cloud by using wireless LTE communications. Fig. 20 shows this extra communications component.
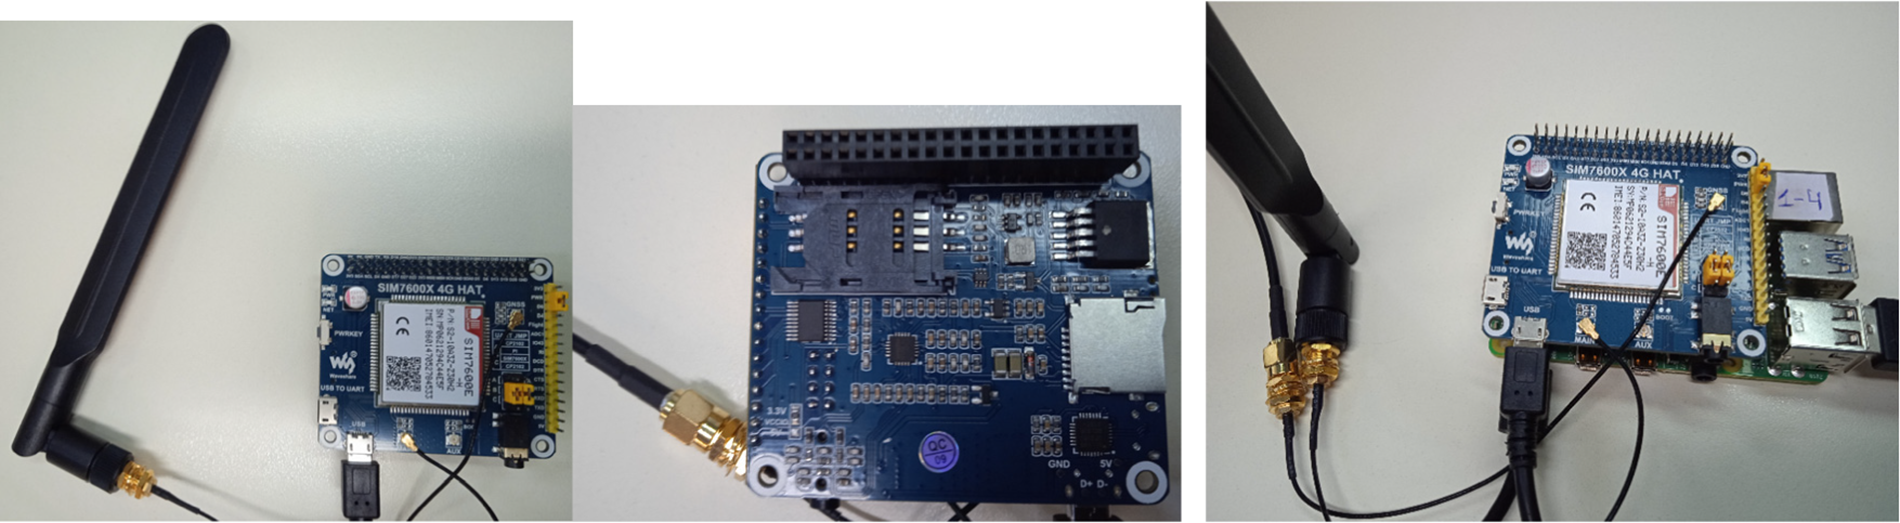
Figure 20: 4G and GPS HAT for Raspberry Pi—Waveshare SIM7600X
VI. Power estimation and Packaging
As a power supply for the IoT gateway, a power bank of 50,000 mAh is selected (lasts for almost 2 days) and the gateway is packaged in an IP66 protective enclosure for protecting from dust and waterproofing (Fig. 21).

Figure 21: Power supply, protective enclosure, packaging
VII. IoT Platform implementation details
IoT platform is a web application interface used mainly for visualization of sensors data. It was implemented using widely known and used languages such as HTML, PHP and Javascript. For data visualization, HighCharts Javascript library [20] was used while for data exploration, Datatables JQuery plug-in [21] was used.
The Highcharts library contains all the tools needed to create reliable and secure data visualizations. Built on JavaScript and TypeScript, all charting libraries work with any back-end database or server stack. Moreover, the library offers wrappers for the most popular programming languages (.Net, PHP, Python, R, Java) as well as iOS and Android, and frameworks like Angular, Vue, and React. Thus, the above capabilities make Highcharts the best choice for visualization of data coming from sensors field.
DataTables is a plug-in for the jQuery Javascript library. It is a highly flexible tool, built upon the foundations of progressive enhancement, that adds all of these advanced features to any HTML table. Thus, it is also a very good choice for representing in a table form a large amount of sensors data providing the user with advanced sorting and filtering capabilities.
A fully automated IoT system for real time monitoring of the status of a moving vehicle is proposed in this study. The term “under moving conditions” is used in order to indicate that the proposed IoT system is used only when the vehicle is on the go. And this because the continuous movement of the vehicle is the only source of energy used to power the WSN. Otherwise, the system cannot operate. The IoT system monitors parameters, such as fuel level and 3-axis acceleration, based on measurements observed by sensors installed in appropriate locations in the chassis of the moving vehicle. The IoT system consists mainly of three components: the low power Wireless Sensor Node (WSN), used for collecting sensors measurements from the vehicle and transmitting them to the IoT gateway by exploiting a low energy communication protocol such as Bluetooth Low Energy (BLE), the IoT gateway which gathers the sensors measurements from the WSN, processes, stores temporary and transmits them, when it is feasible, to a backend server under a secure internet connection (i.e., Wi-Fi, LTE), and the IoT platform, which in essence is a web interface used mainly for visualization of sensors’ measurements, but also for sending alerts to awake occupants, or for sending control signals to enable actuators installed in the vehicle.
The proposed method tries to address the problem of gathering measurements in the sensors’ field without using conventional power systems. Thus, it is restricted in terms of resources and also has low complexity (belongs to the 1st energy harvesting scenario). The adoption of the proposed WSN is, according to our knowledge, the only zero-energy (green) solution has been proposed so far in the literature. Although, other methods (i.e., cabled CAN network that integrates several sensors and actuators) also produce meaningful results are energy consuming and present high computational complexity.
Moreover, it adopts well known and used hardware and software tools which have been proved very promising in terms of low power and low-cost development. Apart from that, it is a fully autonomous solution which does not require human intervention.
Although the results presented so far are focused on the application of the method in only one vehicle, the proposed system is scalable and it can be adopted for monitoring a large number of vehicles. Moreover, it can be extended for simultaneous monitoring of additional parameters by supporting more sensors. It can also be extended to support other low energy communication protocols and to produce various kinds of alerts and control signals, thus providing a complete fully automatic IoT solution for vehicle fleet management.
Funding Statement: This work has been receiving financial support from the European Union’s Horizon 2020 Research and Innovation Programme for project InComEss under Grant Agreement Number 862597.
Conflicts of Interest: The authors declare no conflict of interest. The funders had no role in the design of the study; in the collection, analyses, or interpretation of data; in the writing of the manuscript; or in the decision to publish the results.
References
1. S. J. Bigelow, “Ultimate IoT implementation guide for businesses,” 2022. https://www.techtarget.com/iotagenda/Ultimate-IoT-implementation-guide-for-businesses [Google Scholar]
2. M. L. Ku, W. Li, Y. Chen and K. R. Liu, “Advances in energy harvesting communications: Past, present, and future challenges,” IEEE Communications Surveys & Tutorials, vol. 18, pp. 1–1, 2015. https://doi.org/10.1109/COMST.2015.2497324 [Google Scholar] [CrossRef]
3. Electropaedia—Battery Beginners Page (mpoweruk.com) [Google Scholar]
4. K. S. Adu-Manu, N. Adam, C. Tapparello, H. Ayatollahi and W. Heinzelman, “Energy-harvesting wireless sensor networks (EH-WSNsA review,” ACM Transactions on Sensor Networks, vol. 14, no. 2, pp. 1–50, Article No.: 10, 2018. https://doi.org/10.1145/3183338 [Google Scholar] [CrossRef]
5. H. Elahi, M. Eugeni and P. Gaudenzi, “Chapter 3—Energy harvesting,” in Piezoelectric Aeroelastic Energy Harvesting, Elsevier, pp. 41–59, ISBN 9780128239681, 2022. https://doi.org/10.1016/B978-0-12-823968-1.00014-3 [Google Scholar] [CrossRef]
6. A. Joshi, S. D. Machavaram and H. G. M. Pakala, “Analysis of energy harvesting techniques for wireless sensor networks deployment scenarios,” In: K. Dahal, D. Giri, S. Neogy, S. Dutta and S. Kumar (Eds.Internet of Things and Its Applications, Lecture Notes in Electrical Engineering, vol. 825, Singapore: Springer, 2022. https://doi.org/10.1007/978-981-16-7637-6_31 [Google Scholar] [CrossRef]
7. H. Wang and A. Jasim, “14—Piezoelectric energy harvesting from pavement,” in Woodhead Publishing Series in Civil and Structural Engineering Eco-Efficient Pavement Construction Materials, Woodhead Publishing, pp. 367–382, ISBN 9780128189818, 2020. https://doi.org/10.1016/B978-0-12-818981-8.00014-X [Google Scholar] [CrossRef]
8. S. Herrería-Alonso, A. Suárez-González, M. Rodríguez-Pérez, R. F. Rodríguez-Rubio and C. López-García, “Efficient wind speed forecasting for resource-constrained sensor devices,” Sensors, vol. 21, pp. 983, 2021. https://doi.org/10.3390/s21030983 [Google Scholar] [PubMed] [CrossRef]
9. S. Z. Jia, “Chapter 8—Waste energy harvesting in sustainable manufacturing,” in Sustainable Manufacturing Processes, Academic Press, pp. 231–256, ISBN 9780323999908, 2023. https://doi.org/10.1016/B978-0-323-99990-8.00014-X [Google Scholar] [CrossRef]
10. S. Wang, Y. Hou, F. Gao and X. Ji, “A novel IoT access architecture for vehicle monitoring system,” in 2016 IEEE 3rd World Forum on Internet of Things (WF-IoT), Reston, VA, USA, pp. 639–642, 2016. https://doi.org/10.1109/WF-IoT.2016.7845396 [Google Scholar] [CrossRef]
11. M. Desai and A. Phadke, “Internet of things based vehicle monitoring system,” in 2017 Fourteenth Int. Conf. on Wireless and Optical Communications Networks (WOCN), Mumbai, India, pp. 1–3, 2017. https://doi.org/10.1109/WOCN.2017.8065840 [Google Scholar] [CrossRef]
12. R. B. Pendor and P. P. Tasgaonkar, “An IoT framework for intelligent vehicle monitoring system,” in 2016 Int. Conf. on Communication and Signal Processing (ICCSP), Melmaruvathur, India, pp. 1694–1696, 2016. https://doi.org/10.1109/ICCSP.2016.7754454 [Google Scholar] [CrossRef]
13. S. K. R. Mallidi and V. V. Vineela, “IoT based smart vehicle monitoring system,” International Journal of Advanced Research in Computer Science, vol. 9, no. 2, pp. 738–741, 2018. [Google Scholar]
14. R. Krishnamurthi, A. Kumar, D. Gopinathan, A. Nayyar and B. Qureshi, “An overview of IoT sensor data processing, fusion, and analysis techniques,” Sensors, vol. 20, no. 21, pp. 6076, 2020. https://doi.org/10.3390/s20216076 [Google Scholar] [PubMed] [CrossRef]
15. J. Werner, “EdgeX foundry: A hands-on tutorial,” 2020. https://docs.edgexfoundry.org/1.2/examples/LinuxTutorial/EdgeX-Foundry-tutorial-ver1.0.pdf [Google Scholar]
16. C. Gomez, J. Oller and J. Paradells, “Overview and evaluation of bluetooth Low energy: An emerging low-power wireless technology,” Sensors (Basel), vol. 12, no. 9, pp. 11734–117353, PMCID: PMC3478807, 2012. https://doi.org/10.3390/s120911734 [Google Scholar] [CrossRef]
17. M. Masdani and D. Darlis, “A comprehensive study on MQTT as a low power protocol for internet of things application,” IOP Conf. Series: Materials Science and Engineering, Bandung, Indonesia, vol. 434, pp. 012274, 2018. https://doi.org/10.1088/1757-899X/434/1/012274 [Google Scholar] [CrossRef]
18. Bleak library, Retrieved May 5th 2023, from https://bleak.readthedocs.io/en/latest/ [Google Scholar]
19. 4G and GPS HAT For Raspberry Pi—Waveshare SIM7600X, Retrieved May 5th 2023, from https://core-electronics.com.au/guides/raspberry-pi/raspberry-pi-4g-gps-hat/ [Google Scholar]
20. HighCharts library, Retrieved May 5th 2023, from https://www.highcharts.com/ [Google Scholar]
21. DataTables JQuery Plug-in, Retrieved May 5th 2023, from https://datatables.net/ [Google Scholar]
Cite This Article
 Copyright © 2022 The Author(s). Published by Tech Science Press.
This work is licensed under a Creative Commons Attribution 4.0 International License , which permits unrestricted use, distribution, and reproduction in any medium, provided the original work is properly cited.
 Downloads
 Citation Tools