
 Submit a Paper
 Propose a Special lssue
 Open Access
ARTICLE

Durability of Green Concrete in Severe Environment
1
School of Civil Engineering, Hefei University of Technology, Hefei, 230009, China
2
Henan Key Laboratory of Materials on Deep-Earth Engineering, Henan Polytechnic University, Jiaozuo, 454000, China
3
Anhui Key Laboratory of Civil Engineering Structure and Materials, Hefei University of Technology, Hefei, 230009, China
4
Hefei Cement Research and Design Institute Co., Ltd., Hefei, 230051, China
5
College of Civil Engineering, Lanzhou University of Technology, Lanzhou, 730050, China
* Corresponding Authors: Binggen Zhan. Email: ; Peng Gao. Email:
(This article belongs to the Special Issue: Sustainable Concrete with Recyclable Materials)
Journal of Renewable Materials 2023, 11(4), 1895-1910. https://doi.org/10.32604/jrm.2023.025059
Received 19 June 2022; Accepted 22 August 2022; Issue published 01 December 2022
 View Full Text
 Download PDF
Abstract
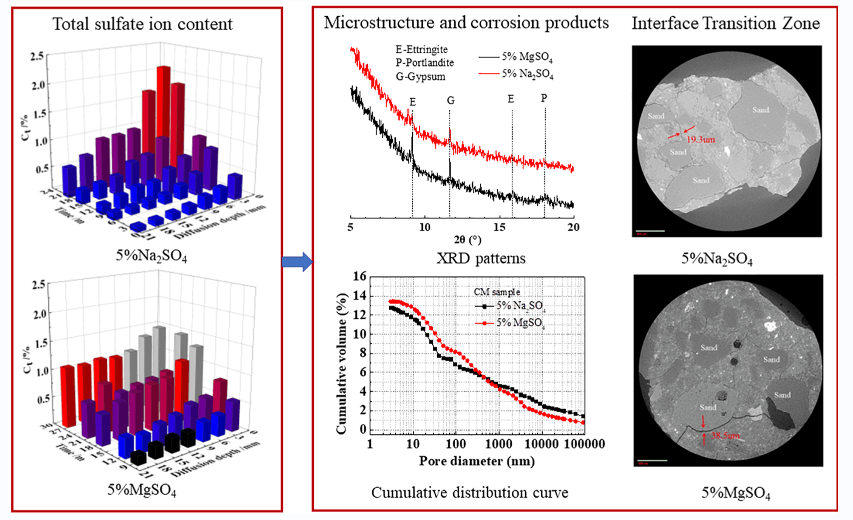
In this paper, the effects of different mineral admixtures and sulfate solution types on the appearance, mass change rate, relative dynamic elastic modulus, and corrosion resistance coefficient of concrete were systematically studied. X-ray Diffraction (XRD), Mercury Intrusion Porosimetry (MIP), Scanning Electron Microscopy (SEM), and X-ray Computed Tomography (X-CT) were used to explore and analyze the changes in the microstructure and the corrosion products of concrete in the sulfate solution. The results show that the existence of magnesium ions accelerates concrete deterioration. There is a critical dosage of fly ash for magnesium sulfate resistance of concrete. The magnesium sulfate resistance of concrete is improved when the fly ash content is less than 20%. Slag can significantly improve the corrosion resistance of concrete to magnesium sulfate. The diffusion of sulfate ions into concrete is a gradual process. In the early stages of corrosion, sulfate ion content in the concrete immersed in the magnesium sulfate solution is slightly less than that of the concrete immersed in the sodium sulfate solution. However, in the later stage of corrosion, the sulfate ion content in the concrete immersed in the magnesium sulfate solution is significantly higher than that of the concrete immersed in the sodium sulfate solution.Graphic Abstract
Keywords
Concrete has become the most widely used material in civil engineering due to its low cost, easy access, and good integrity [1–3]. Despite the impact of COVID-19 in recent years, the annual production of commercial concrete has continued to increase. With the continuous promotion of national strategies such as “Western Development” and “One Belt, One Road,” many infrastructure projects have been or are planned to be built in the harsh regions of Northwest China [4,5]. However, there are vast salt lakes and saline soils in these regions, which are rich in sulfate ions and magnesium ions that can damage concrete structures [6–9]. Therefore, studying the deterioration of concrete under a magnesium sulfate environment will develop a theoretical understanding of the process and has important engineering value for designing durable concrete [10–13].
Magnesium sulfate corrosion of concrete is a complex physical and chemical process, and its corrosion mechanism varies in different environments [14–18]. Nehdi et al. [19] studied the sulfate attack of cementitious materials semi-submerged in 10% Na2SO4 and MgSO4 solutions, respectively. It was found that the portion submerged in MgSO4 solution suffered a more severe chemical attack than Na2SO4, while the opposite was true for the evaporation zone above the immersion surface. Chen et al. [20,21] explored the deterioration law of concrete semi-immersed in a sulfate solution. The results showed that the physical corrosion of the dry part of concrete was the main deterioration mechanism for sodium sulfate semi-immersion, while the chemical corrosion of the immersed concrete is the primary degradation mechanism for magnesium sulfate semi-immersion. Aye et al. [22] explored the deterioration process of mortar immersed in sodium sulfate and magnesium sulfate solutions, respectively. The results showed that the chemical corrosion property of magnesium sulfate solution was more substantial than that of the sodium sulfate solution. However, when physical and chemical corrosion coincided, the mortar immersed in sodium sulfate solution was more severely damaged.
There is still limited understanding of the degradation process of concrete in sodium sulfate and magnesium sulfate solution. In addition, current studies of concrete in the sulfate environment mainly focus on macroscopic degradation, and few studies examine the spatial and temporal distribution of sulfate ions in concrete. Here, the deterioration law of concrete under the magnesium sulfate environment was systematically studied by analyzing the deterioration curve and the deterioration characteristics. XRD, MIP, SEM, and X-CT were used to explore and analyze the pore structure, corrosion product components and morphology changes of the interface transition zone of concrete in magnesium sulfate solution to reveal the deterioration mechanism.
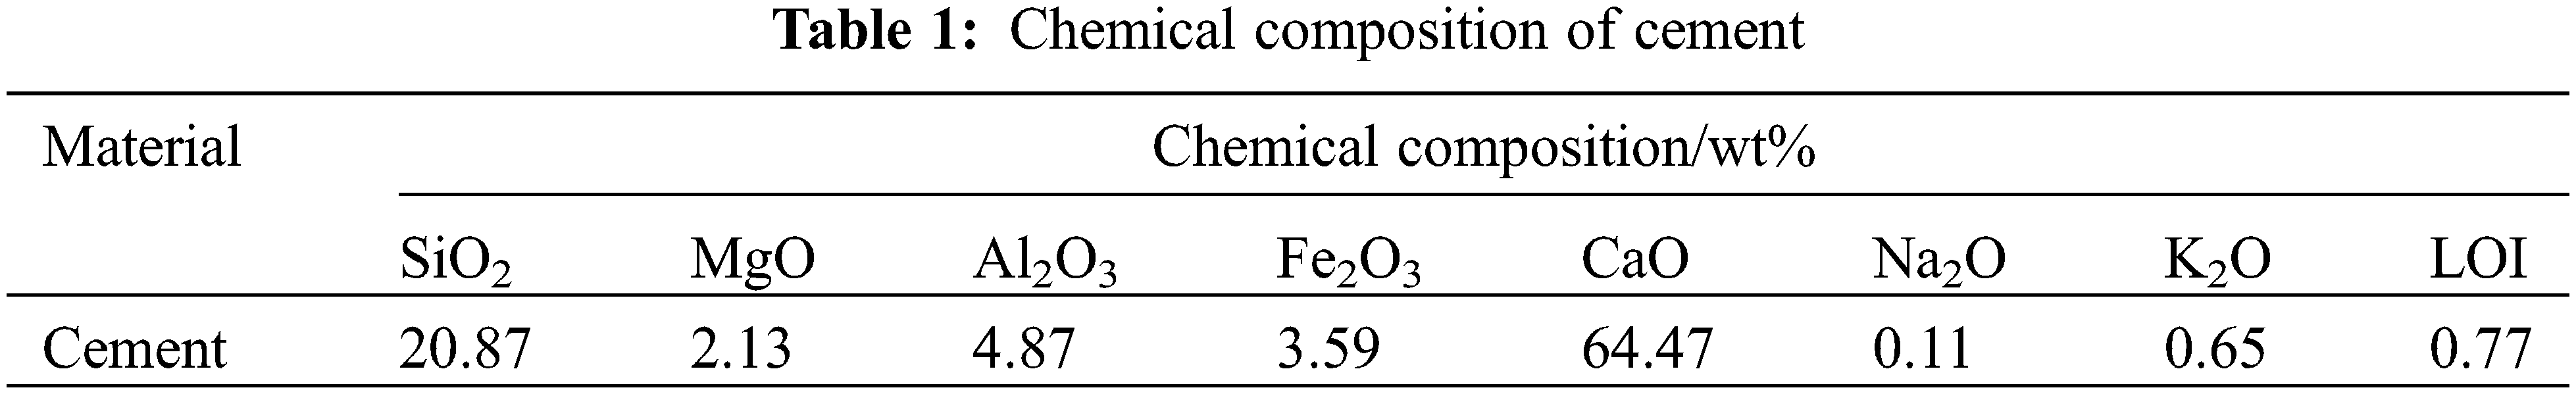
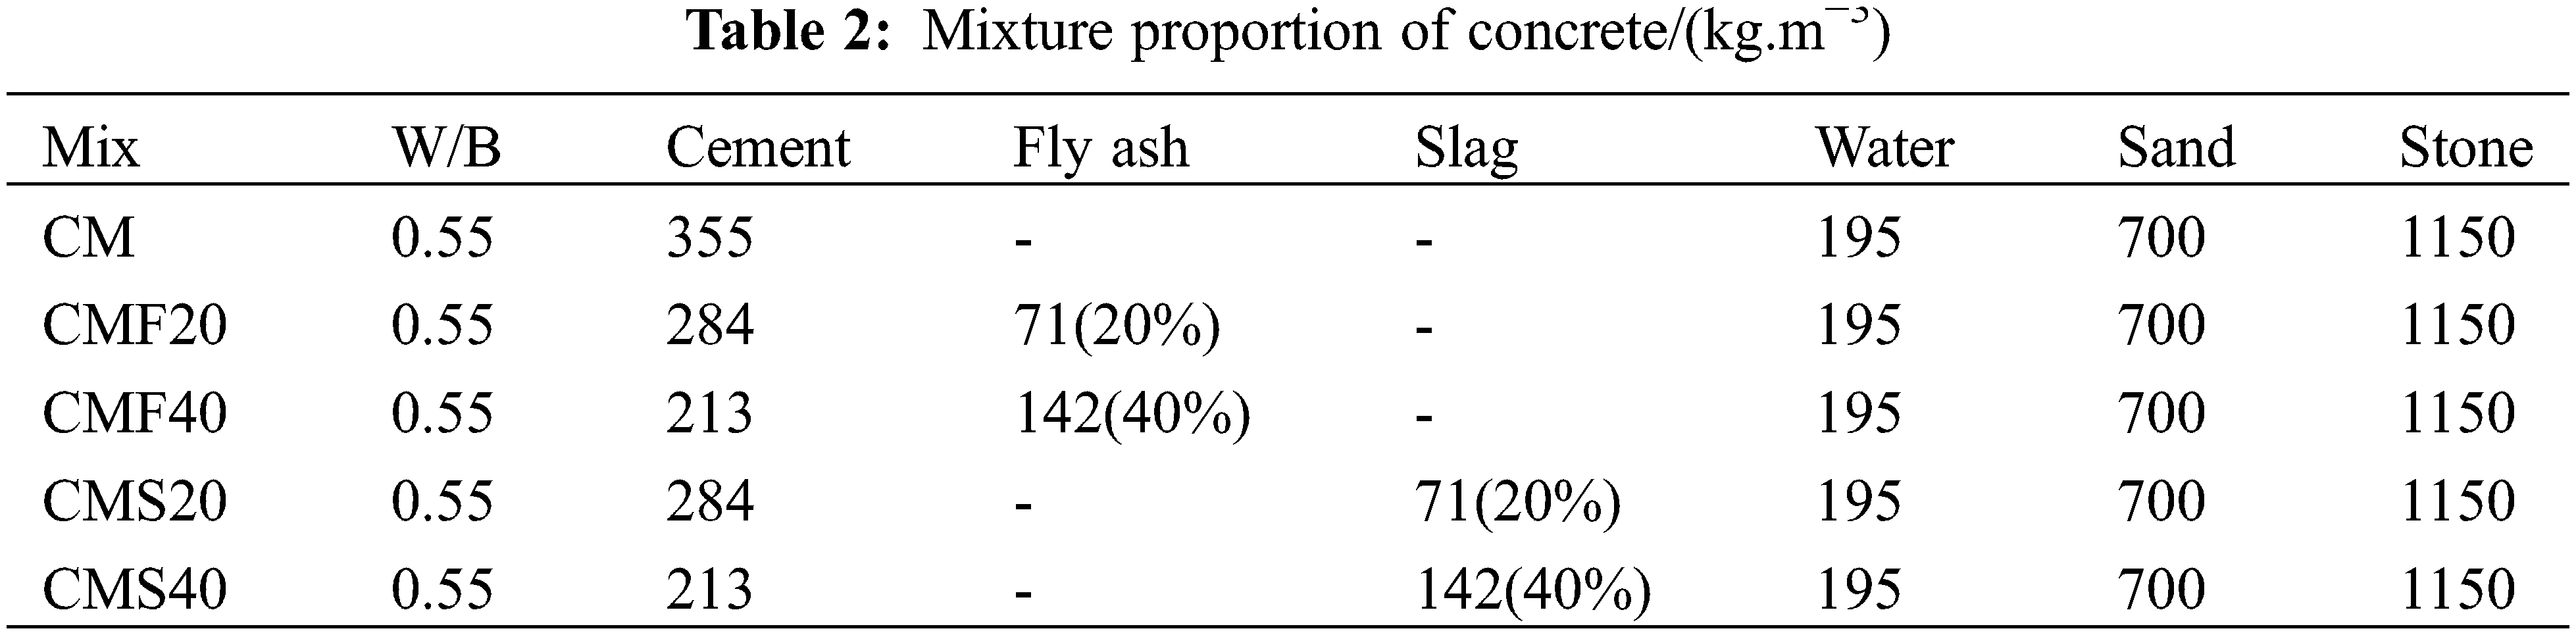
P⋅I 52.5 cement was used in the test, and its chemical composition is shown in Table 1; the coarse aggregate is limestone gravel with an apparent density of 2800 kg/m3, continuous gradation, and maximum particle size of 20 mm; the fine aggregate is river sand with a fineness modulus of 2.80 and an apparent density of 2780 kg/m3. The water-cement ratio used in this paper is 0.55, and the specific formulation is shown in Table 2. Meanwhile, CM refers to the concrete with a water-to-cement ratio of 0.55, CMF20 represents 20% replacement Portland cement with fly ash, CMF40 represents 40% replacement Portland cement with fly ash, CMS20 represents 20% replacement Portland cement with slag, and CMS40 represents 40% replacement Portland cement with slag.
The dimensions of the concrete samples are 100 mm × 100 mm × 100 mm and 100 mm × 100 mm × 300 mm. The former is used to test the compressive strength of concrete at different times under corrosion; the latter is used to test the relative dynamic elastic modulus and the mass of concrete under different corrosion times. The concrete was removed 24 h after forming and cured for 60 d as standard.
The corrosion solutions are 5% Na2SO4 and 5% MgSO4 by a mass fraction. The concrete was cured for 60 days and then fully immersed in one of the aforementioned corrosion solutions. After the designed corrosion time, the concrete was taken out to measure its change in mass, relative dynamic elastic modulus, and other performance indexes. Then the concrete was fully immersed again in the corrosion solution for the next designated corrosion time. In addition, to avoid the influence of ambient temperature, the corrosion experiment was carried out in a controlled environment at a constant temperature.
Expansive corrosion products are generated when the sulfate ion in the solution enters the concrete. This caused the concrete to expand, crack, and even spall, ultimately leading to a change in the quality of the concrete. Therefore, testing the mass change under a sulfate environment can characterize the extent of concrete spalling from the surface.
The mass change rate of the concrete was calculated according to Eq. (1)
where ΔW is the rate of mass change of concrete sample after corrosion, calculated as the average of three samples, G0 represents the mass of the concrete sample before corrosion, Gt is the mass of the concrete sample at designed corrosion time t.
2.2.4 Relative Dynamic Elastic Modulus (Erd)
When the concrete reaches the designed corrosion time, the concrete is taken out, and the surface is blotted and dried. Then, the non-metallic ultrasonic detector was used to test the ultrasonic time at both ends of the sample. The relative dynamic elastic modulus is shown in Eq. (2)
where Erd is the relative dynamic elastic modulus of the concrete sample, En is the dynamic elastic modulus of the concrete sample at the designed corrosion time t, E0 is the dynamic elastic modulus of the concrete sample before corrosion, V0 is the ultrasonic speed of concrete sample before corrosion, Vn is the ultrasonic speed of concrete sample at the designed corrosion time t, t0 is the ultrasonic propagation time of concrete sample before corrosion, tn is the ultrasonic propagation time of concrete sample at corrosion time t.
2.2.5 Corrosion Resistance Coefficient
Concrete is susceptible to corrosion and deterioration in sulfate environments. Although the corrosion resistance coefficient is a destructive test, it is possible to visually and accurately characterize the change in compressive strength of concrete. The corrosion resistance coefficient is shown in Eq. (3)
where
2.2.6 Sulfate Ion Content Test
The traditional way of sampling powder is drilling; this method has limited control over the accuracy of the drilling depth and significantly disperses the sample powder obtained. In this paper, the concrete mill is used to extract the powder where the dispersion of the sample powder is minimized. The concrete powder preparation process is as follows. Firstly, the concrete that reaches the designed soaking time is taken out. Secondly, the concrete is ground in layers. Finally, the large particles are removed with a sieve with 0.15 mm square-hole sieve to obtain the concrete powder. This paper measured the spatial and temporal distribution of sulfate ions in concrete powder using the gravimetric method.
XRD, SEM, MIP, and X-CT were used to study the microstructural evolution of concrete under sulfate attack to reveal the deterioration mechanism.
1. XRD
A D8-Discover type X-ray diffractometer from Bruker, Germany, was used to test the changes in hydration products and corrosion products of mortar after the sulfate attack. The target material is Cu, the operating voltage is 40 kV, and the operating current is 30 mA. The scanning parameters are set to a scanning speed of 0.15 s/step, a step size of 0.02°, scanning angle of range of 5°∼70°.
2. SEM
A Sirion field emission scanning electron microscope manufactured by FEI in the Netherlands was used for the tests, with a current of 0.8 mA and a voltage of 10–30 kV.
3. MIP
Mercury intrusion porosimetry test was conducted using Autopore IV9500. It can measure a pore diameter ranging from 5 nm to 360 μm.
4. X-CT
Y.CT PRECISION S X-CT from YXLON, Germany, was used to track the evolution of the depth of sulfate attack on concrete by in situ continuous visualizations. High voltage range: 10–225 kV; operation mode: cone beam scanning; the number of pixels: 1024 × 1024, magnification: 1.6–200×.
Fig. 1 represents the morphological appearance of different samples after 22 months of complete immersion in different sulfate solutions. The figure shows that the edges and corners of the CM sample deteriorated after 22 months of corrosion in sodium sulfate solution, accompanied by a small amount of spalling. Correspondingly, the surface paste of samples corroded by magnesium sulfate solution is loose or even paste-like, and a large number of coarse aggregates were exposed clearly, indicating more severe corrosion. This is because magnesium ions will first react with calcium oxide to form Magnesium Hydroxide (MH). As MH is insoluble alkali and consumes a large amount of calcium hydroxide within the concrete, the internal alkalinity of the concrete is reduced. To maintain the alkalinity of the concrete pore solution, the C-S-H gel decomposes, generating the non-gelatinous substance M-S-H gel. Comparing Fig. 1b with Fig. 1f reveals that the surface corrosion of the CMF40 sample is relatively severe, while the surface corrosion of CMF20. CMS20 and CMS40 samples are not as severe as that of the CM sample, which indicates that adding 40% fly ash is unfavorable for the corrosion resistance of concrete to magnesium sulfate.
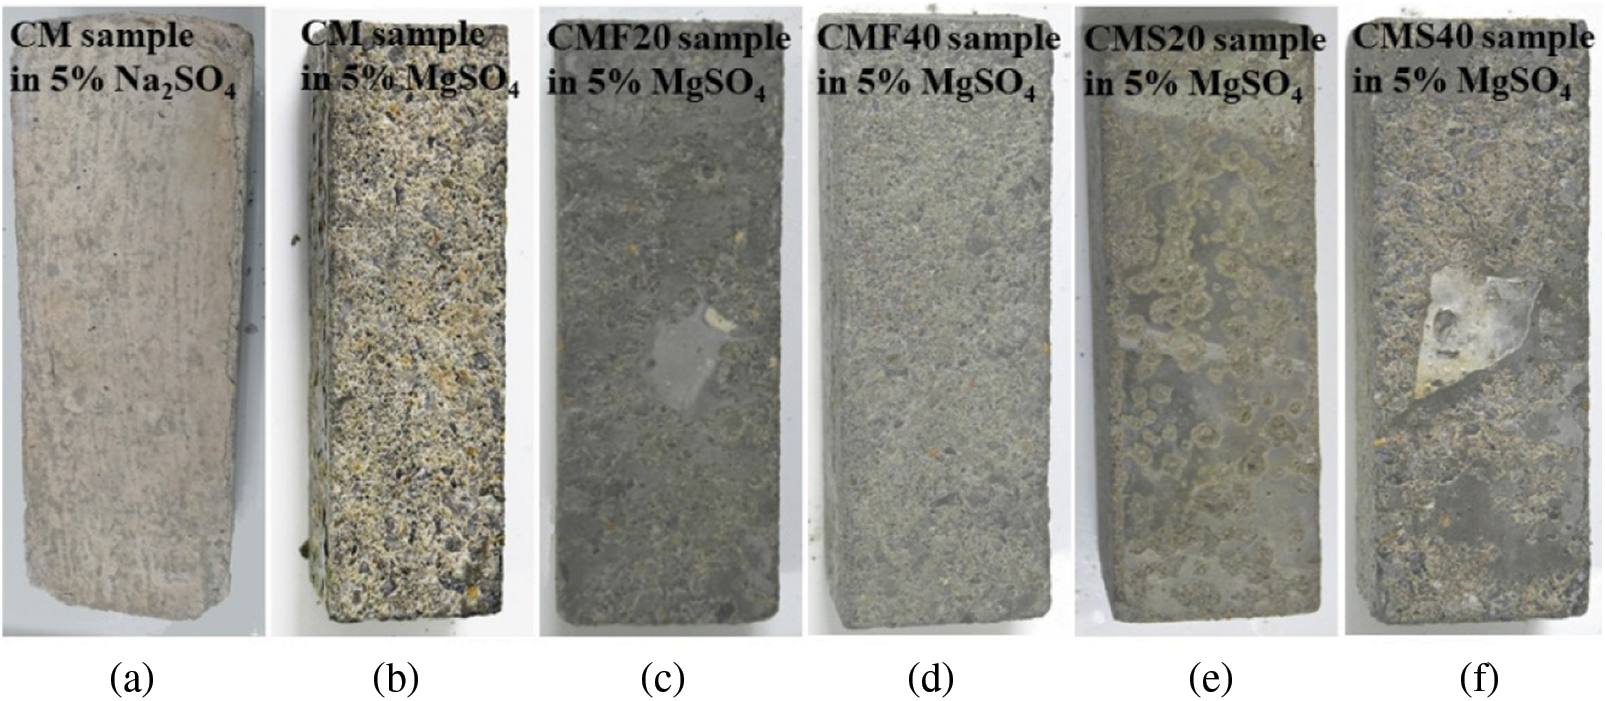
Figure 1: Outer surface of different samples in different sulfate solutions
Fig. 2 represents the mass change of different samples in different sulfate solutions. As shown in Fig. 2a, the increase in mass of CM in magnesium sulfate solution is less than the increase in mass in sodium sulfate solution during the early stages of corrosion. This is due to the generation of MH on the surface of CM in magnesium sulfate solution, which delays the entry of sulfate ions into the concrete, thus having a relatively small increase in mass. As the corrosion time increased, the mass of CM immersed in magnesium sulfate solution began to decrease, while the mass of CM immersed in sodium sulfate solution was still increasing. This is because the surface layer of the sample immersed in magnesium sulfate solution generated M-S-H gel with no cementation, resulting in the softening of the surface layer of the sample, which led to the decrease of their mass. In the later stages of corrosion, the mass of CM decreased more rapidly because more corrosion products were generated in the sodium sulfate solution, resulting in an increase in cracking and spalling of the sample. The mass of CM decreased by 0.45% and 0.19% after 22 months of immersion in sodium sulfate solution and magnesium sulfate solution, respectively. It can be seen from Fig. 2b that the pattern of the change in the mass of concrete with mineral admixtures is similar, suggesting that the mass of concrete increases in the early stages of corrosion. With increasing corrosion time, the mass begins to show a downward trend. In addition, it can also be seen that the mass of CMF20 decreased most rapidly after 9 months of corrosion, indicating that the corrosion is the most serious. This is because by adding 40% fly ash, the internal structure of concrete becomes looser, and a large number of corrosive ions are able to penetrate the concrete, which aggravates the corrosion of the sample, resulting in the fastest decline in the mass of CMF40.
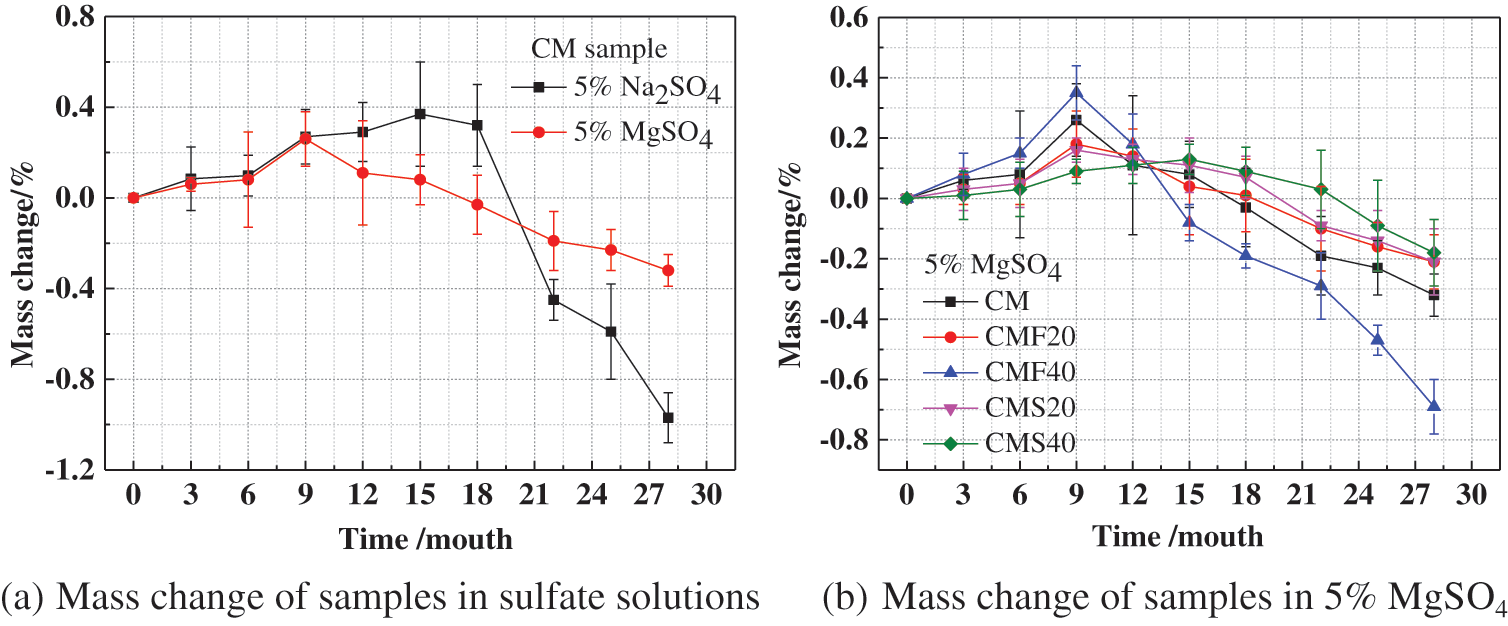
Figure 2: Effect of different sulfate solutions on the mass change of concrete
3.3 Relative Dynamic Elastic Modulus Change
Fig. 3 shows the effect of different sulfate solutions on the relative dynamic elastic modulus (Erd). As shown in Fig. 3a, the Erd of CM in magnesium sulfate solution shows a steady trend of slow decline. However, the Erd of CM in sodium sulfate solution shows three stages of slow increase, rapid decrease, and slow decrease. The reason for this phenomenon is that in the early stages of corrosion, the corrosion products generated by sulfate ions enter the concrete interior, filling the pores and increasing the compactness of concrete to a certain degree, thus increasing the Erd. With increasing corrosion time, microcracks are generated inside the sample, leading to a rapid decrease in its Erd. As sulfate ions enter the cracks, the generated corrosion products fill some of the cracks, so its relative dynamic elastic modulus decreases slowly. When the CM was immersed in Na2SO4 solution and MgSO4 solution for 22 months, their relative dynamic elastic modulus decreased to 0.84 and 0.81, respectively, which indicates that the CM was most severely damaged by corrosion in a magnesium sulfate solution. Meanwhile, it can be seen from Fig. 3b that the Erd of concrete has decreased by varying degrees, which is due to the formation of cracks in the samples. However, in the early stage of corrosion, the mass of samples is increased, revealing the challenges in using the rate of mass change and the Erd separately to evaluate the damage of sulfate to the concrete. By combining the interpretation of the mass change and the Erd can the degree of damage to the concrete from sulfate be more accurately evaluated. In addition, the Erd of concrete with 40% fly ash is the smallest, followed by the Erd of concrete without mineral admixture. This suggests that adding 20% fly ash and slag can improve the magnesium sulfate corrosion resistance of concrete, but adding 40% fly ash is unfavorable to the magnesium sulfate resistance of concrete.
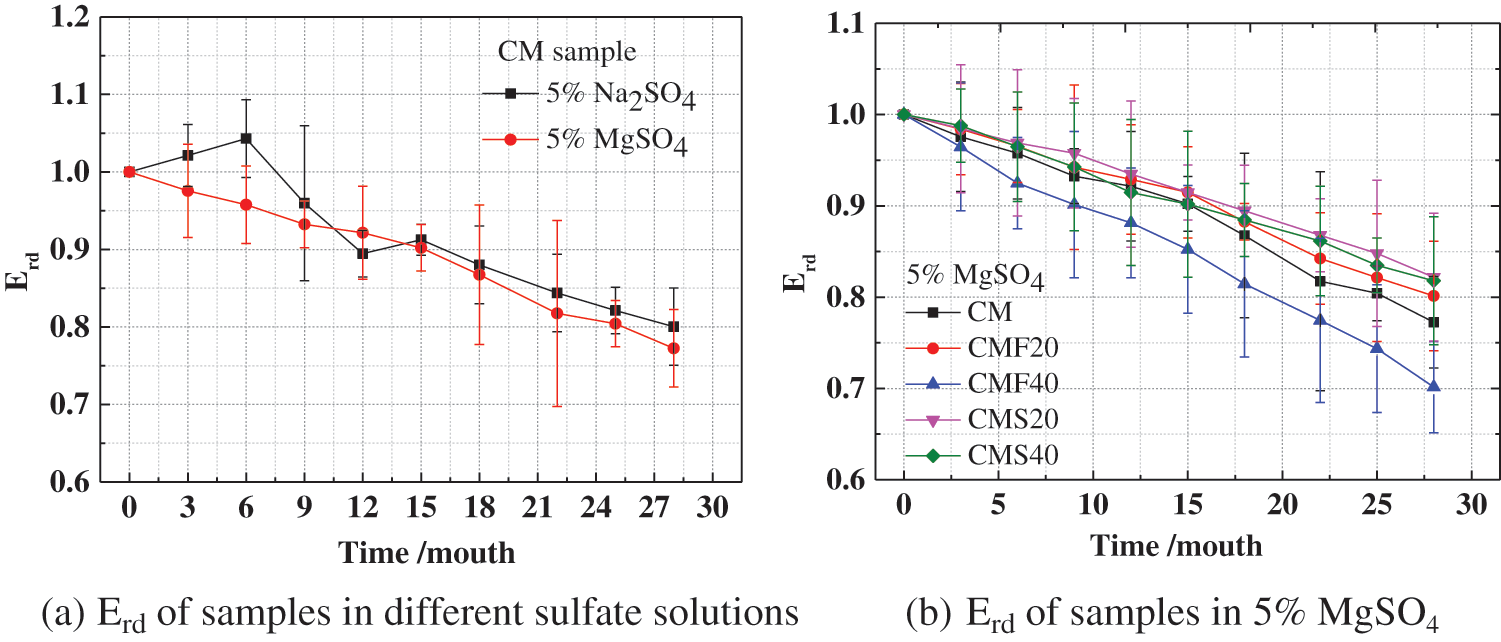
Figure 3: Effect of different sulfate solutions on the Erd of concrete
3.4 Corrosion Resistance Coefficient
Fig. 4 represents the effect of different sulfate solutions on the corrosion resistance coefficient of concrete. With increasing corrosion time, the rate of diminishing compressive strength of concrete gradually increases, and the corrosion resistance coefficient decreases. In addition, it can be found that the corrosion resistance coefficient of CM in magnesium sulfate solution is greater than that in sodium sulfate solution for the same immersion time. This indicates that the intrusion of magnesium ions intensifies the deterioration of the concrete. Meanwhile, the corrosion resistance coefficients of CM, CMF20, CMF40, CMS20 and CMS40 decreased to 62.3%, 67.5%, 60.5%, 70.3% and 71.3%, respectively after the samples were immersed in magnesium sulfate solution for 28 months.
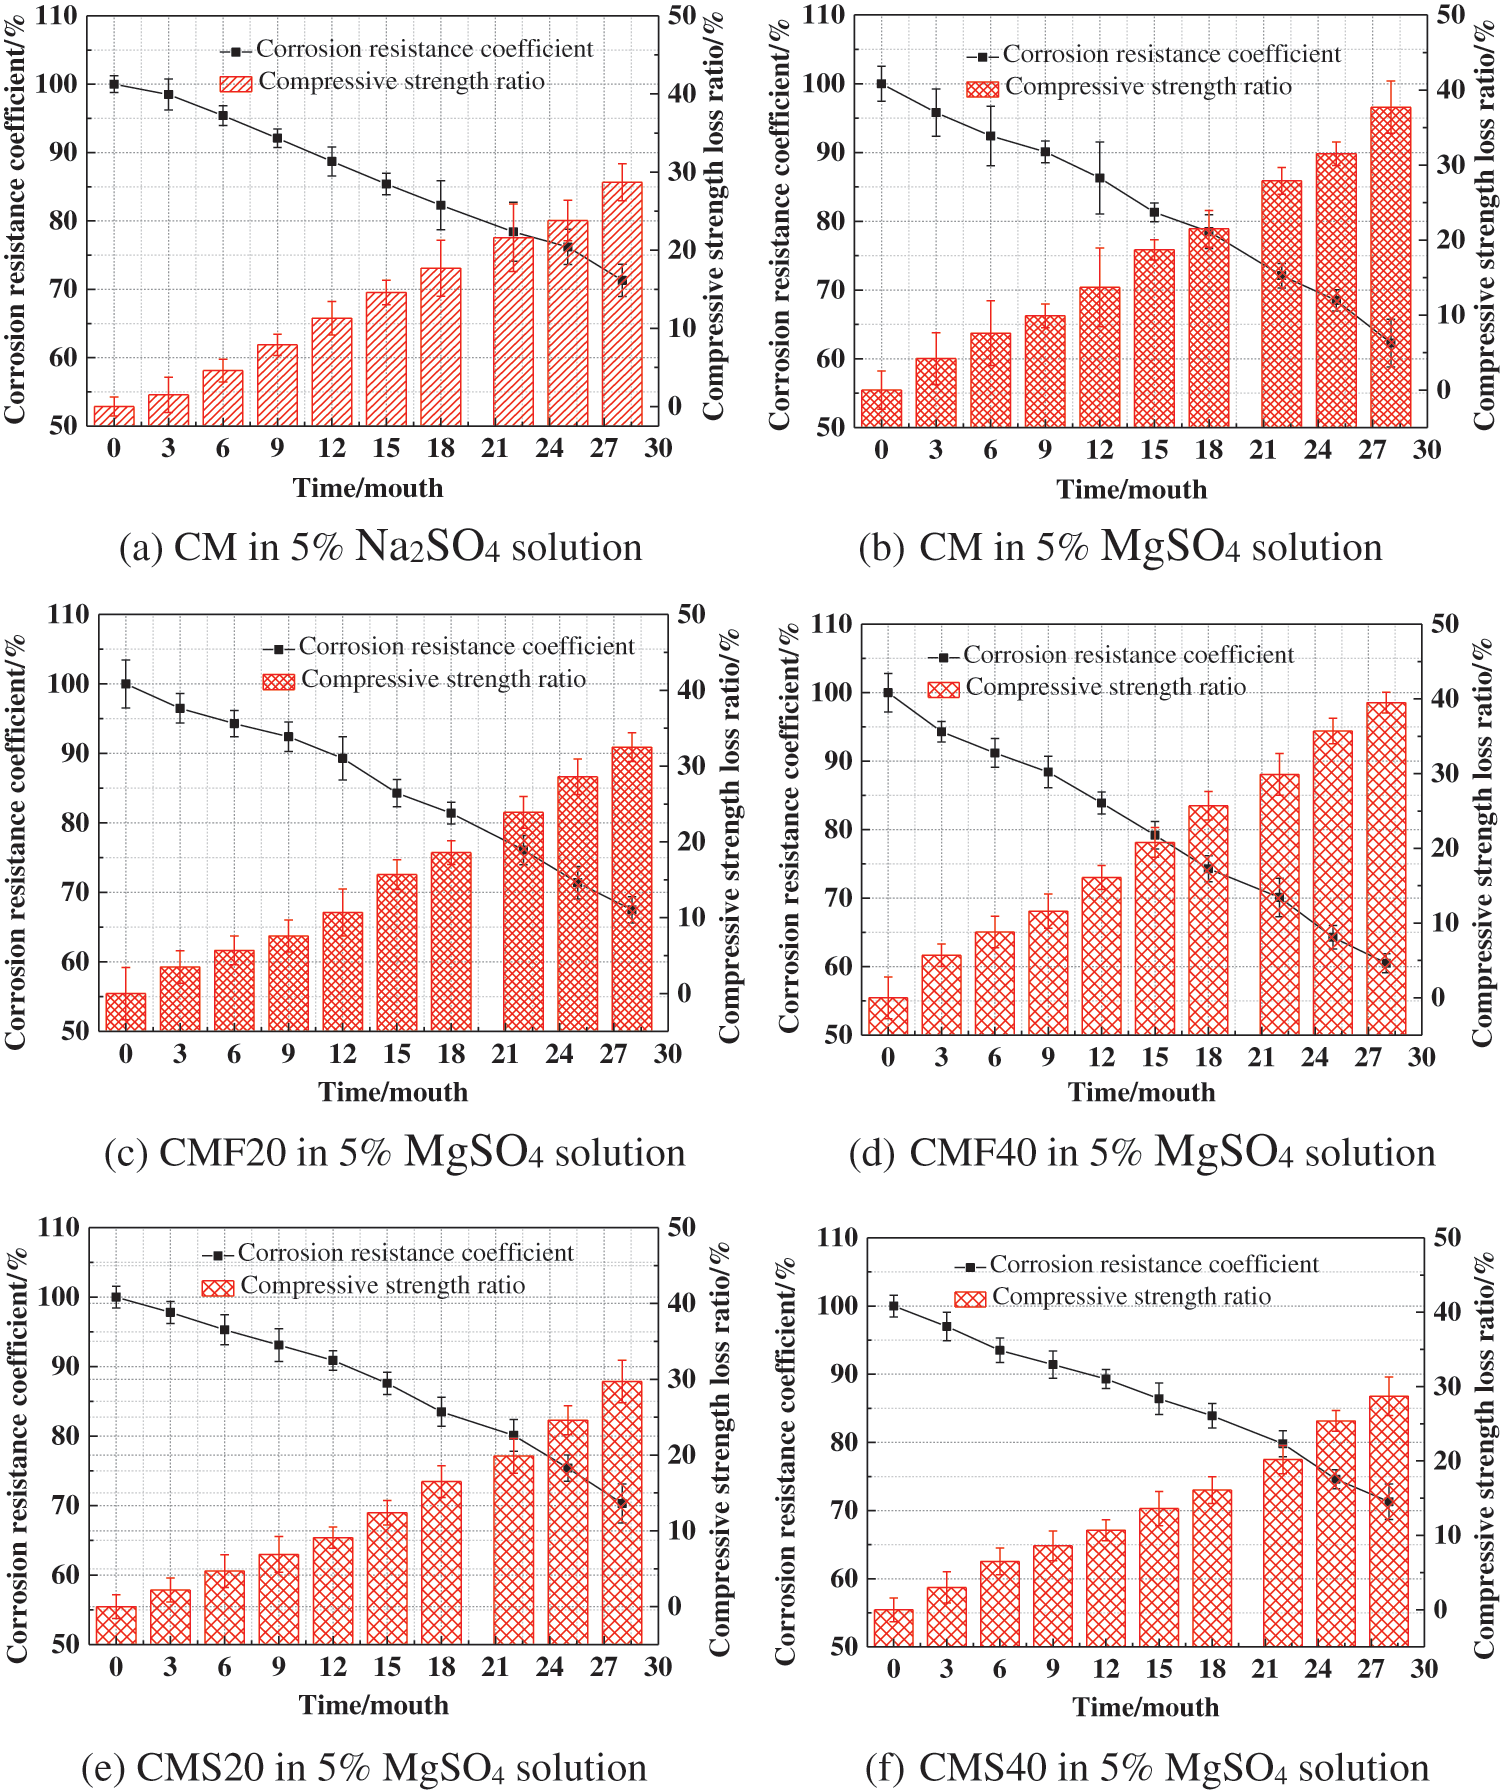
Figure 4: Effect of different sulfate solutions on the corrosion resistance coefficient of concrete
3.5 Spatial and Temporal Distribution of Sulfate Ion Content
Fig. 5 represents the evolution of the amount of free sulfate ion in different samples in different sulfate solutions. The free sulfate ion content in samples gradually increases with increasing corrosion time, and the overall free sulfate gradually decreases with increasing corrosion depth. The amount of free sulfate ion in the CM in the magnesium sulfate solution is generally greater than the amount of free sulfate ion in the sodium sulfate solution at the same depth. In addition, the free sulfate ion concentration of CMF20 and CMS20 under the same corrosion time is lower than that of CM, which indicates that adding 20% fly ash and 20% slag can reduce the amount of sulfate ion in concrete.
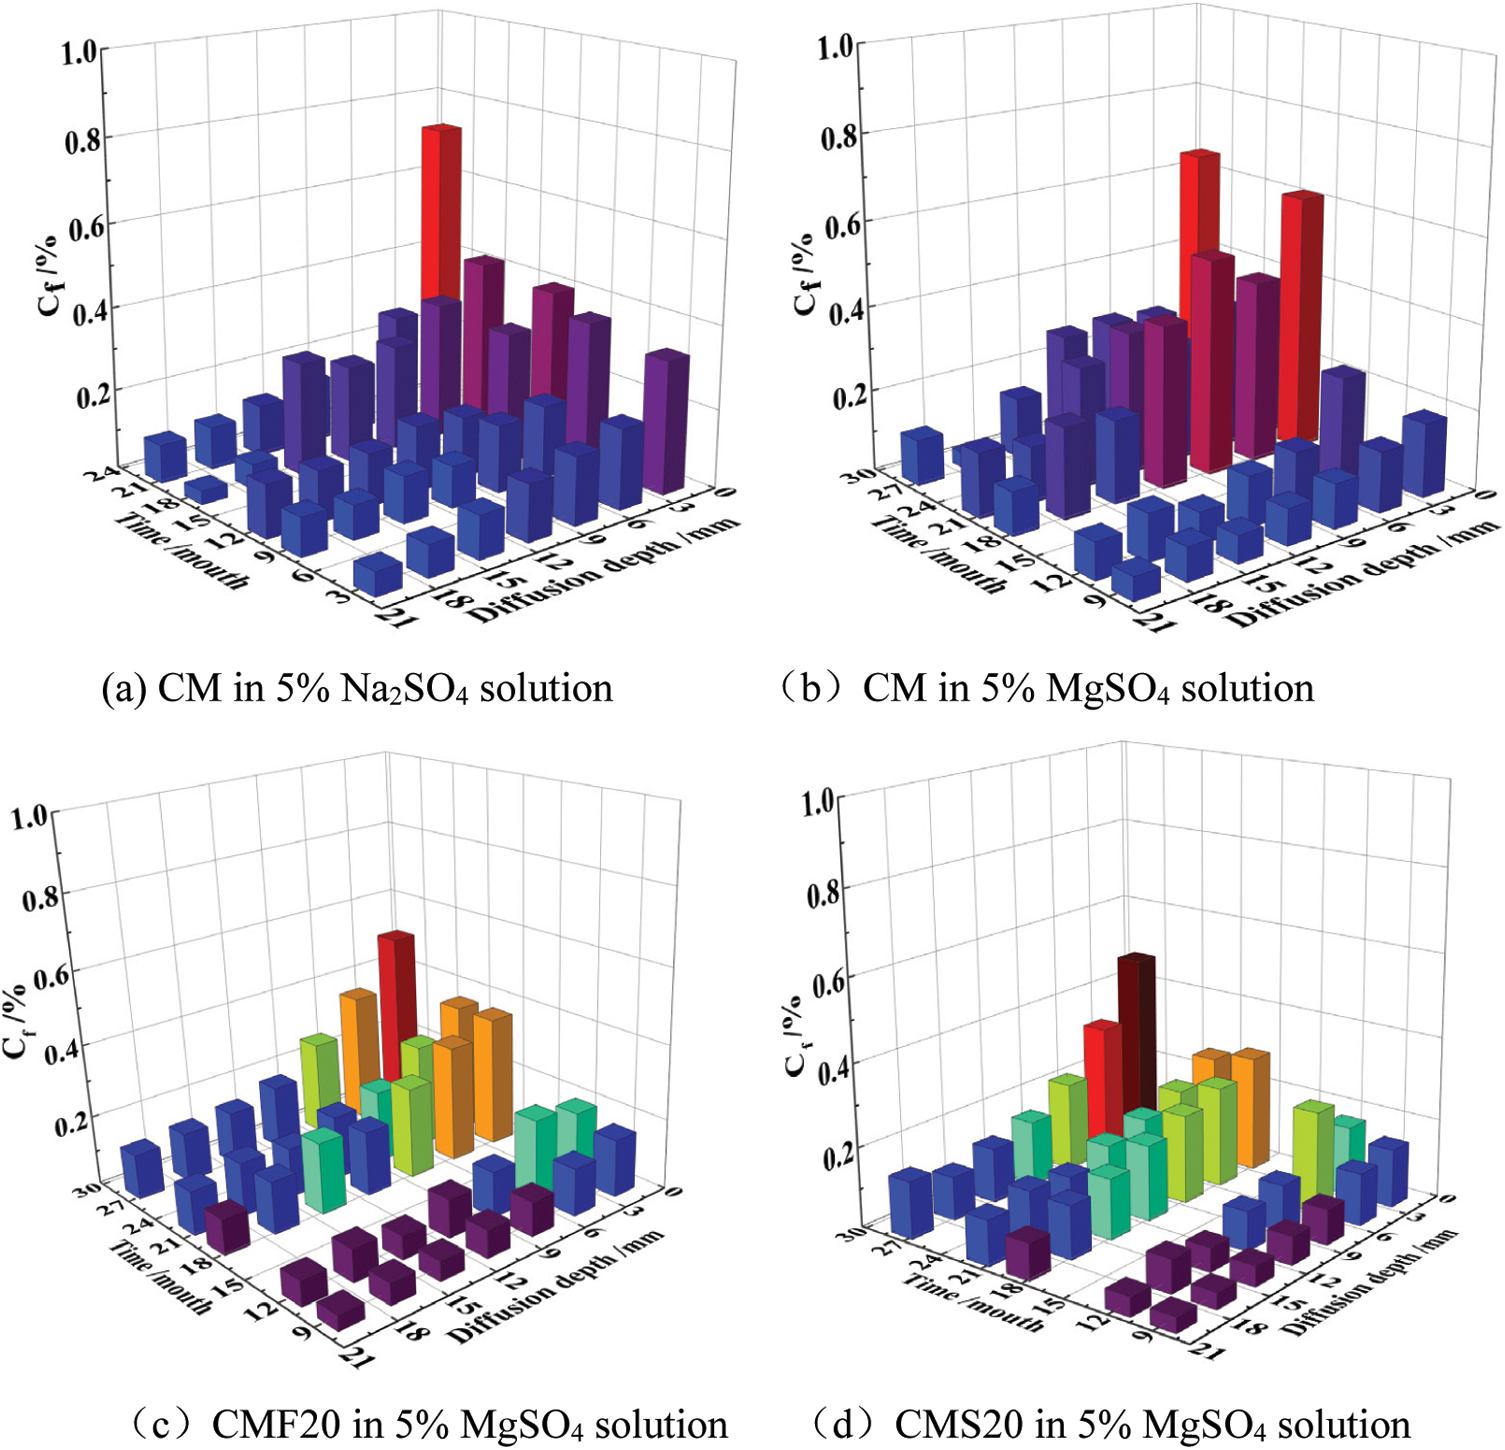
Figure 5: Evolution of the amount of free sulfate ion of different samples in different sulfate solutions
Fig. 6 represents the evolution of the total sulfate ion in samples immersed in different sulfate solutions. It can be seen that the total sulfate ion of CM decreases significantly with the increase of corrosion depth after 9 months in magnesium sulfate solution, and is lower than the total sulfate ion at the same depth in a sodium sulfate solution. This may be due to the fact that at the early stage of corrosion, magnesium ions will first react with calcium oxide to form an MH film on the surface of the CM, temporarily delaying the entry of sulfate ions into the concrete. It is worth noting that after 28 months of corrosion, the total sulfate ion of CM did not change significantly at different depths of magnesium sulfate solution. This is likely because MH is an insoluble alkali and consumes a large amount of calcium hydroxide in concrete. Thus, the alkalinity of the interior of the concrete is reduced. In order to maintain the alkalinity in the concrete pore solution, the C-S-H gel decomposes, and a non-gelatinous substance (M-S-H gel) is produced. As a result, the surface slurry of the CM loosens, resulting in an accelerated rate of sulfate ions entering the sample’s interior. Thus, the total sulfate ion content inside the CM is high. Meanwhile, it can also be seen that the total sulfate ion content of concrete with mineral admixtures is significantly lower than that of concrete without mineral admixtures. The reason is that the content of C3A in the concrete system reduces after adding mineral admixtures. In addition, the secondary hydration of mineral admixture improves the compactness of the samples and delays the entry of corrosive ions into the concrete.
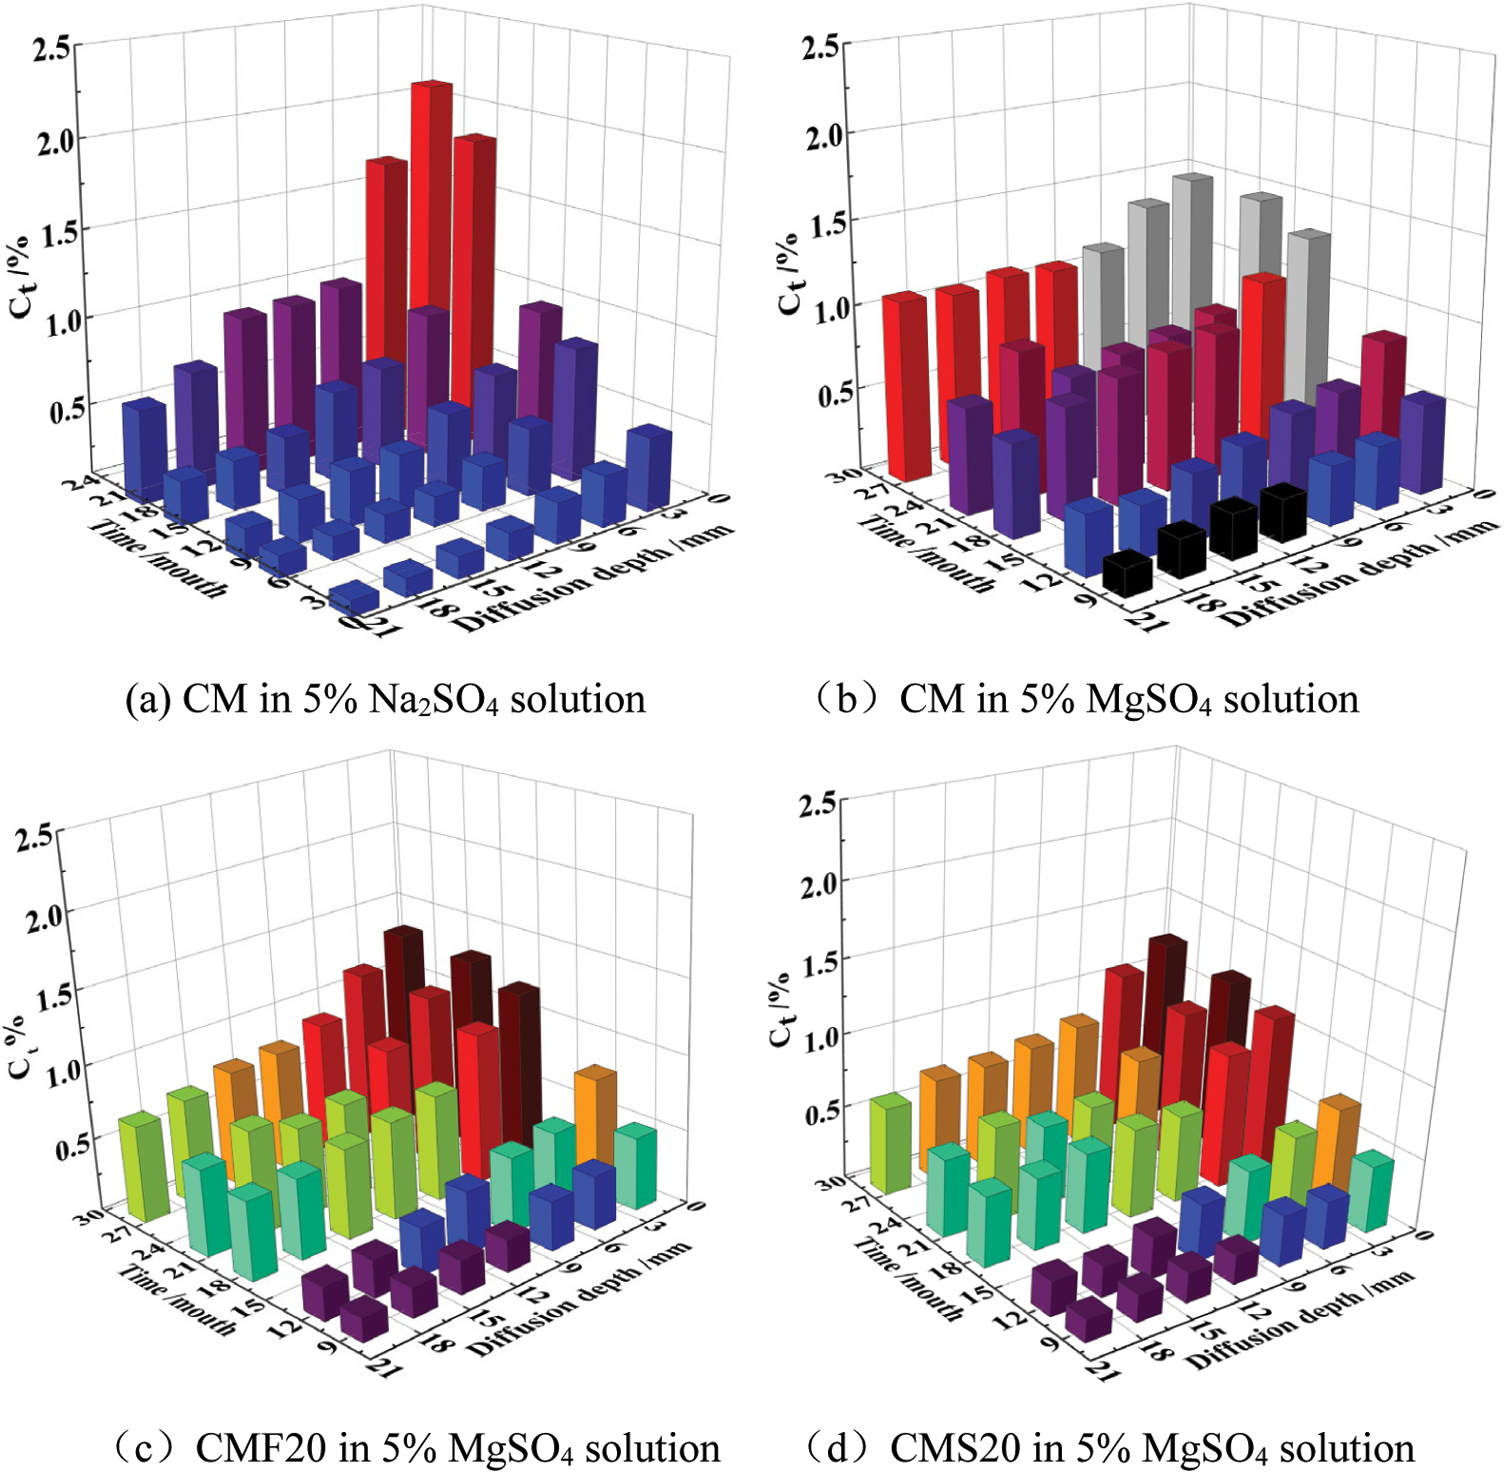
Figure 6: Evolution of the total sulfate ion content of different samples in different sulfate solutions
The difference between the total sulfate ion and the free sulfate ion in the sample is the amount of sulfate ion where the corrosion reaction occurs. Fig. 7 represents the change in the number of sulfate ions where the corrosion reaction occurs. Only a small amount of sulfate ions are involved in the reaction on the surface and in the interior of the concrete mixed with mineral admixture, which also explains why CMF20 and CMS20 are less damaged by magnesium sulfate solution.
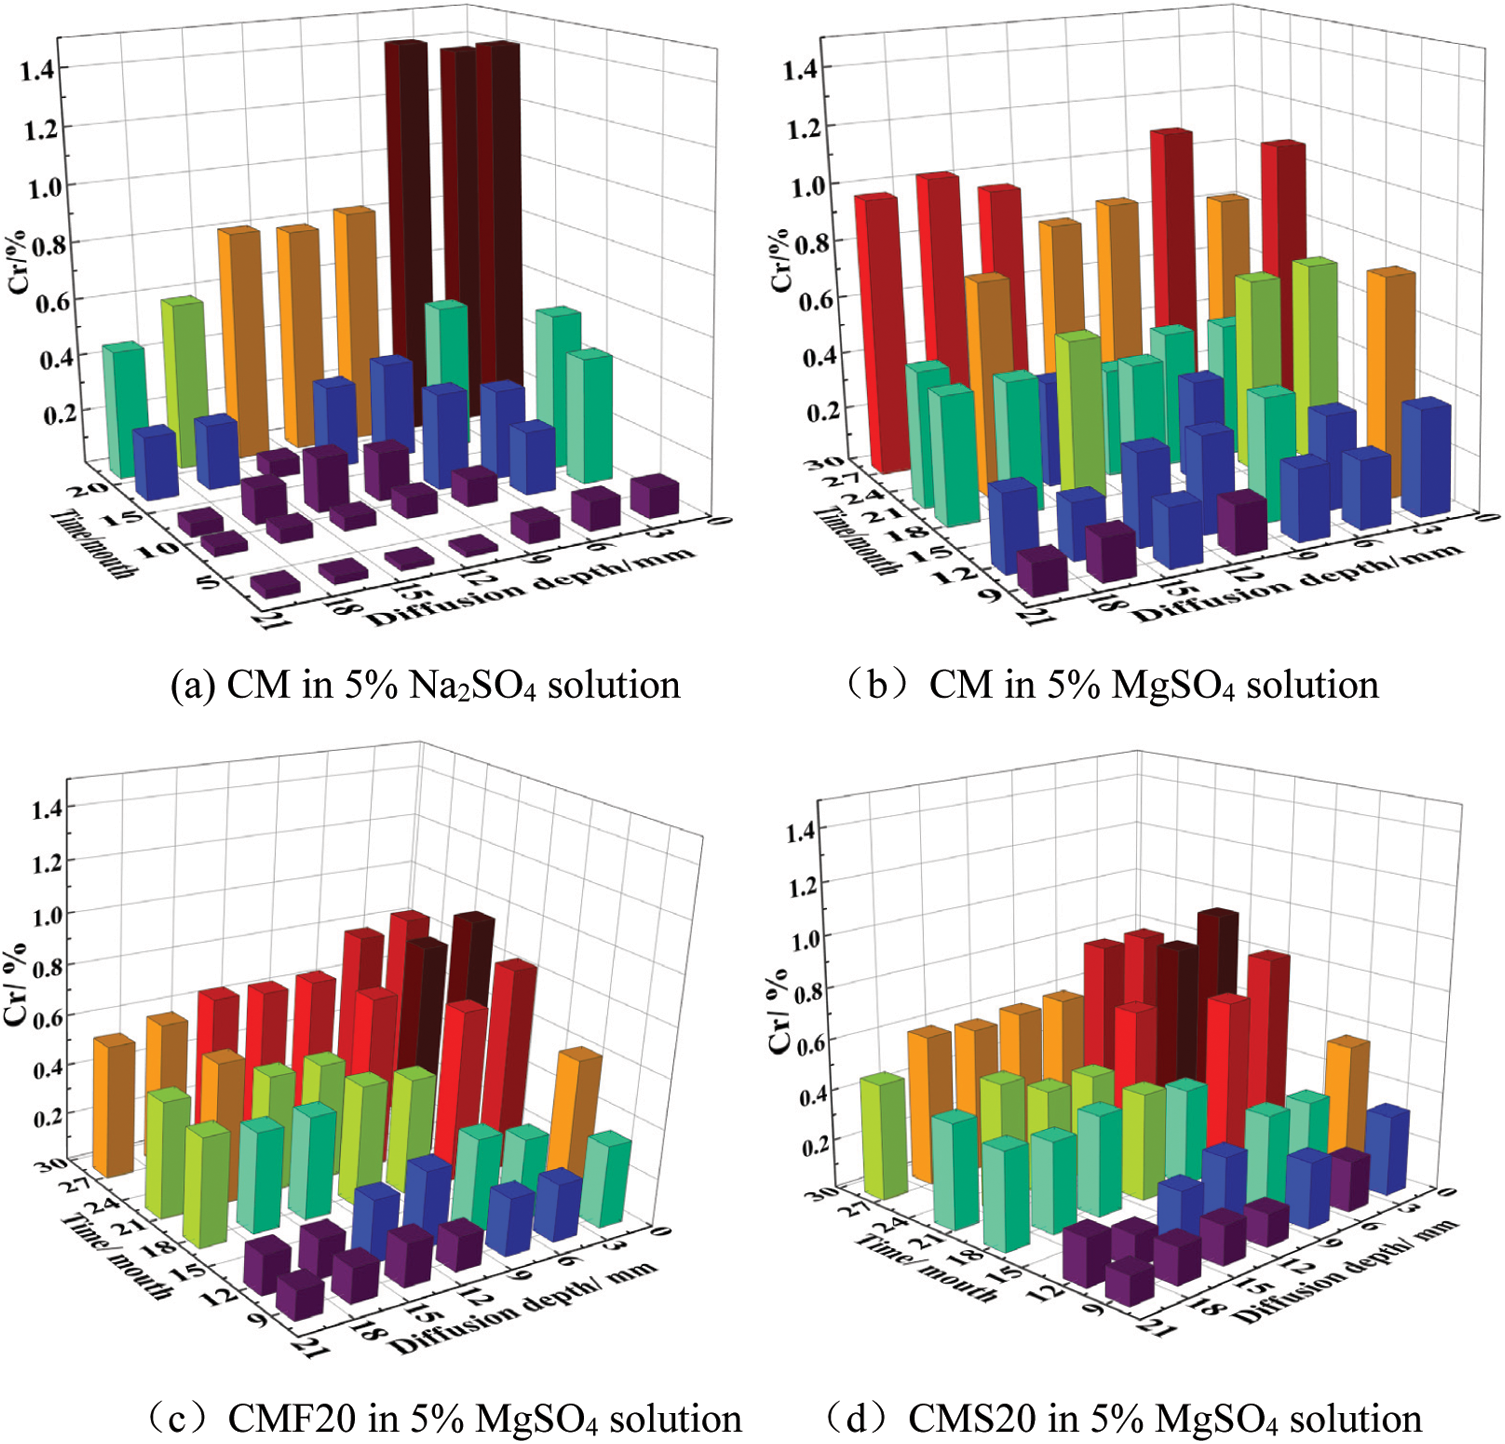
Figure 7: Number of sulfate ions involved in the reaction of different sample
3.6.1 Changes in the Composition of Corrosion Products
Fig. 8 represents the surface XRD patterns of the CM after 22 months of immersion in the sulfate solution. Fig. 8a shows that there are strong diffraction peaks of calomel and gypsum on the surface layer of the sample after 22 months of corrosion. Diffraction peaks of magnesium hydroxide and M-S-H gel are also observed. It shows that gypsum and calcium alumina was formed on the surface of the sample at this time; at the same time, magnesium hydroxide and M-S-H gel were also formed. Since the characteristic diffraction peaks of SiO2 are very strong, the characteristic diffraction peaks of other substances have been concealed. In order to better analyze and compare the changes in the composition and the relative content of corrosion products of CM in different sulfate solutions, the changes in the composition and relative content of various substances in the range of 5°–20° of 2θ are studied, as shown in Fig. 8b. Strong gypsum diffraction peaks and calomel diffraction peaks were observed in the XRD patterns of the surface layer of the CM after 22 months in a magnesium sulfate solution. In contrast, the diffraction peaks of the same sample were relatively weaker after 22 months in the sodium sulfate solution. The comparison revealed that CM generated more calcium alumina and gypsum in the magnesium sulfate solution. The reason is that there is simultaneous corrosion of magnesium ions and sulfate ions in a magnesium sulfate solution. During the corrosion process, a non-cemented M-S-H gel was formed, resulting in a loose structure of weaker strength in the sample. The rate of sulfate ions entering the sample was accelerated, so the amount of ettringite and gypsum generated in magnesium sulfate solution was relatively large. Therefore, on the macro level, it manifested as a loose concrete surface slurry with significant coarse aggregates.
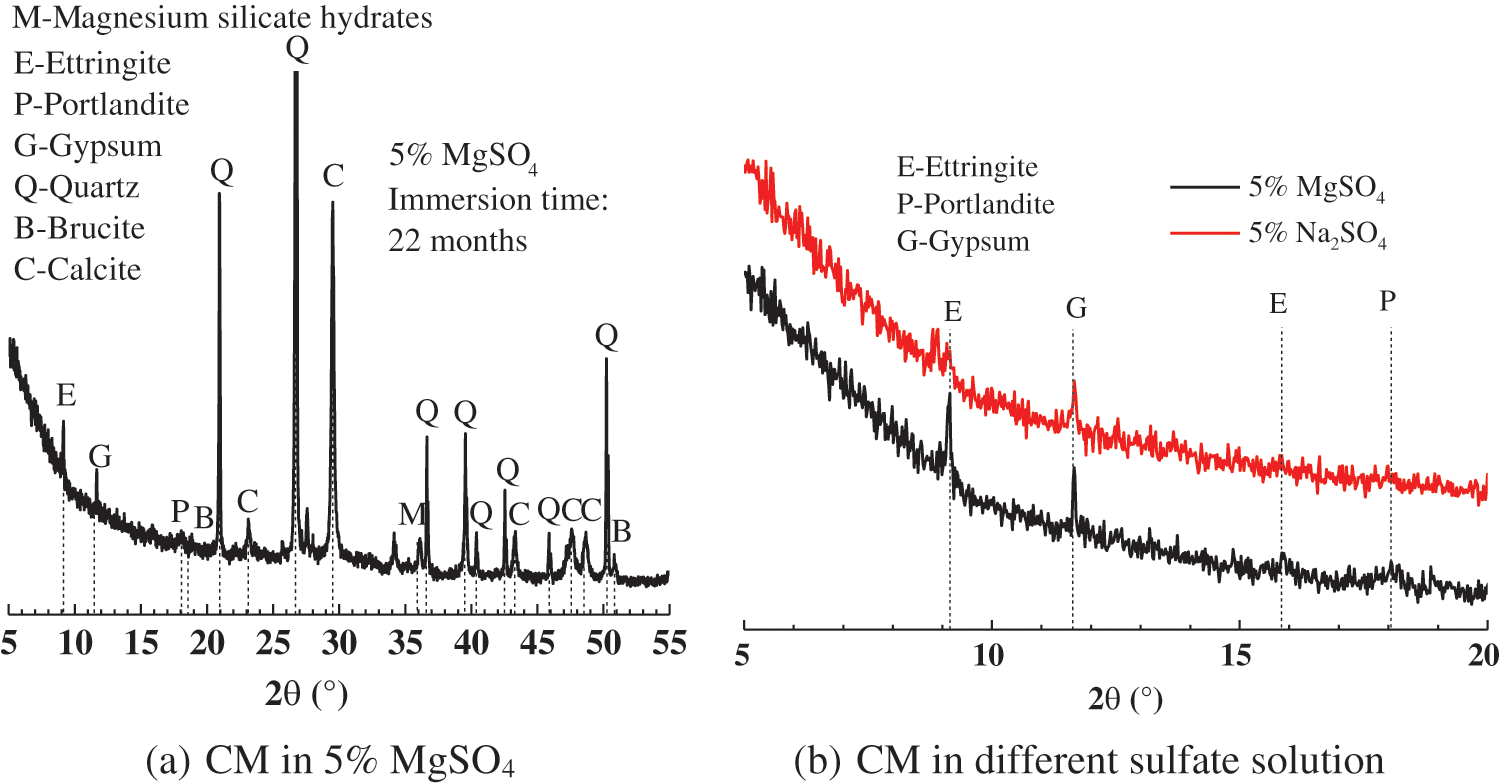
Figure 8: XRD patterns of CM immersed in 5 w% MgSO4 solution for 22 months
3.6.2 Changes in the Morphology of Corrosion Products
Fig. 9 represents the SEM images of CM exposed to MgSO4 solution for 22 months. A large number of short coarse crystal gypsum is generated in the area of corrosion on the surface of the concrete. A large number of cracks appeared near the gypsum. This is because the M-S-H gel without cementation was formed in the eroded area of the concrete surface, which resulted in a loose structure, further accelerated the penetration of sulfate ions and aggravated the damage and deterioration of concrete.
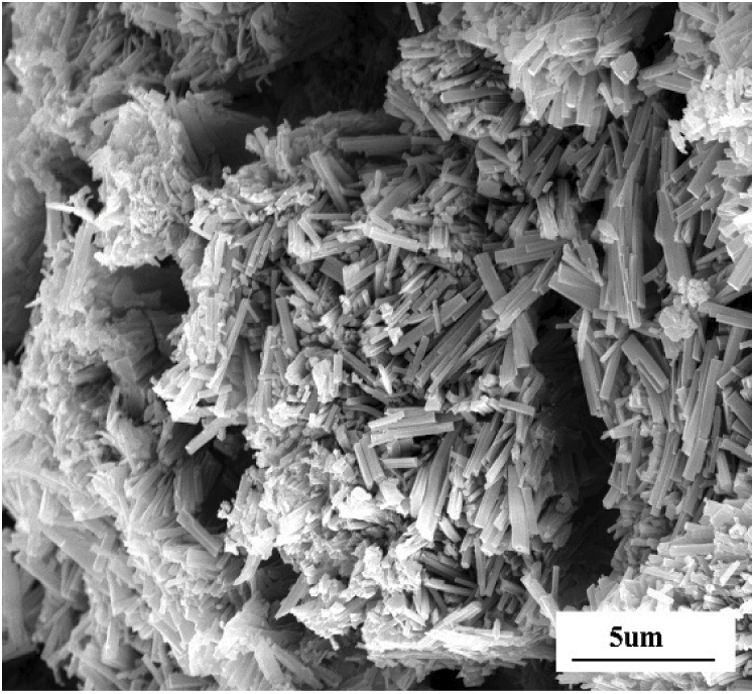
Figure 9: SEM images of the corrosion site on the surface of CM immersed in 5% MgSO4 solution for 22 months
3.6.3 Changes in the Pore Structure
Fig. 10 shows the pore structure of CM before and after the corrosion of the MgSO4 solution. It can be seen from the figure that the porosity of CM increased from 9.8% to 13.4% after 22 months of corrosion. At the same time, it shows that the modal pore size was increased to 40.3 nm and the porosity of harmful pores larger than 100 nm was increased to 8.15%. This shows that the pore size of CM is coarsened after 22 months of corrosion, as magnesium sulfate solution can lead to the loosening of the concrete structure in the process of corrosion. This is consistent with the XRD results shown above.
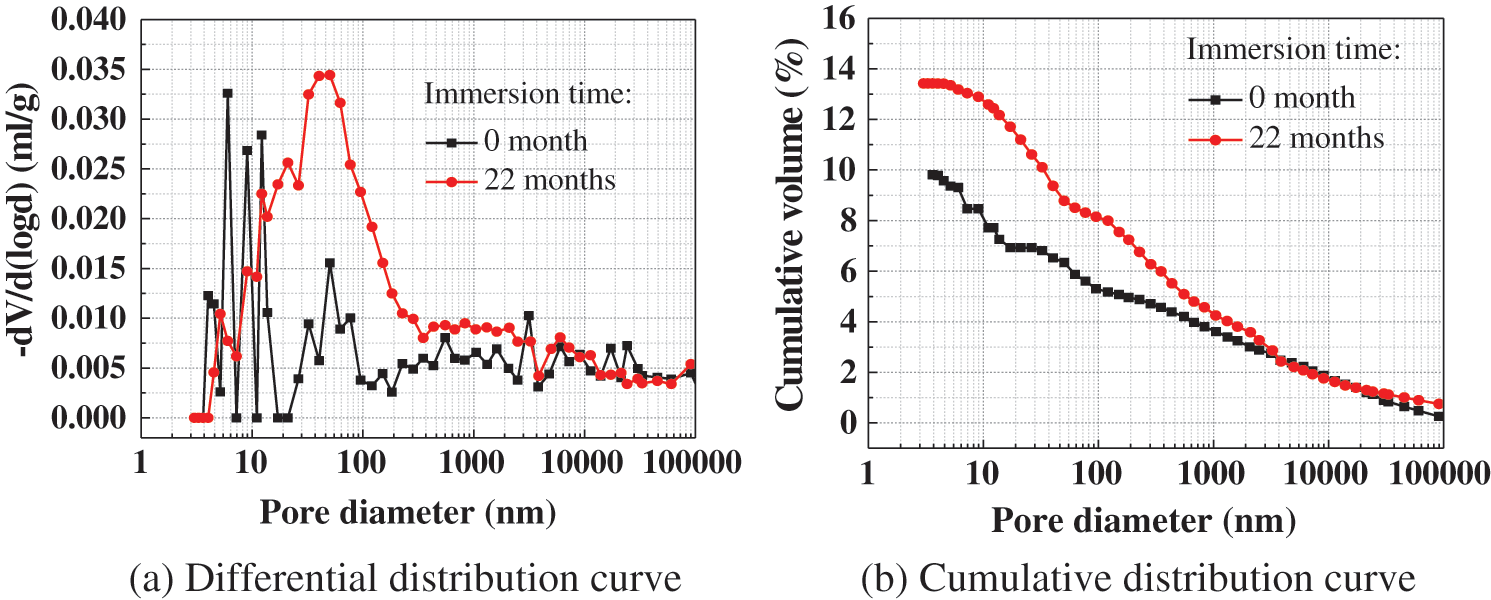
Figure 10: Pore structure of CM before and after corrosion by 5% MgSO4 solution
Fig. 11 represents the pore structure of CM immersed in different sulfate solutions for 22 months. The porosity of CM eroded by magnesium sulfate solution for 22 months is slightly larger than that of CM eroded by sodium sulfate solution for 22 months. In addition, the most probable pore size of CM increased after being eroded by magnesium sulfate solution, indicating that the pore size of CM was coarsened.
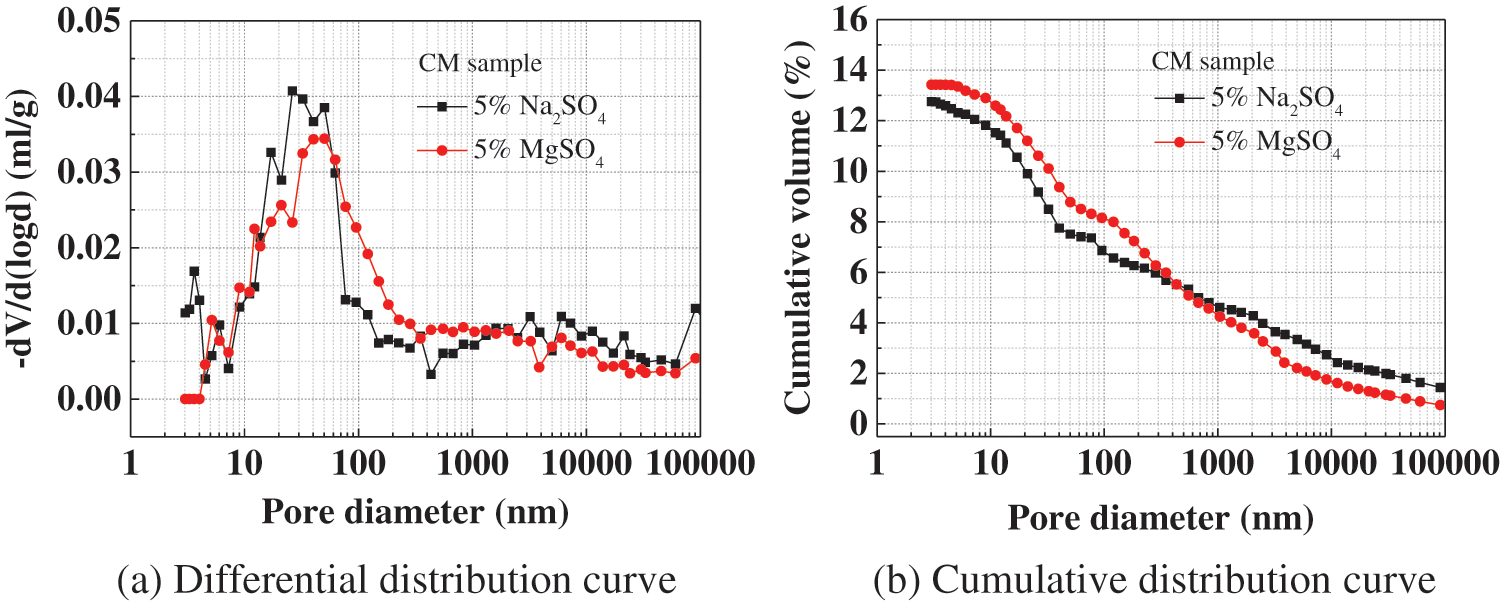
Figure 11: Pore structure of CM immersed in different sulfate solutions for 22 months
Fig. 12 shows the pore structure of concrete with different mineral admixtures after 60 days of curing. The porosity of CMF20, CMS20, and CMS40 decreased slightly. However, the porosity of the CMF40 sample increased slightly. In addition, CMF20, CMS20 and CMS40 show improved pore size, in which the number of pores greater than 200 nm is significantly reduced. Nevertheless, the number of pores greater than 200 nm in CMF40 is significantly increased. This explains why adding more fly ash is unfavorable to the sulfate resistance of concrete.
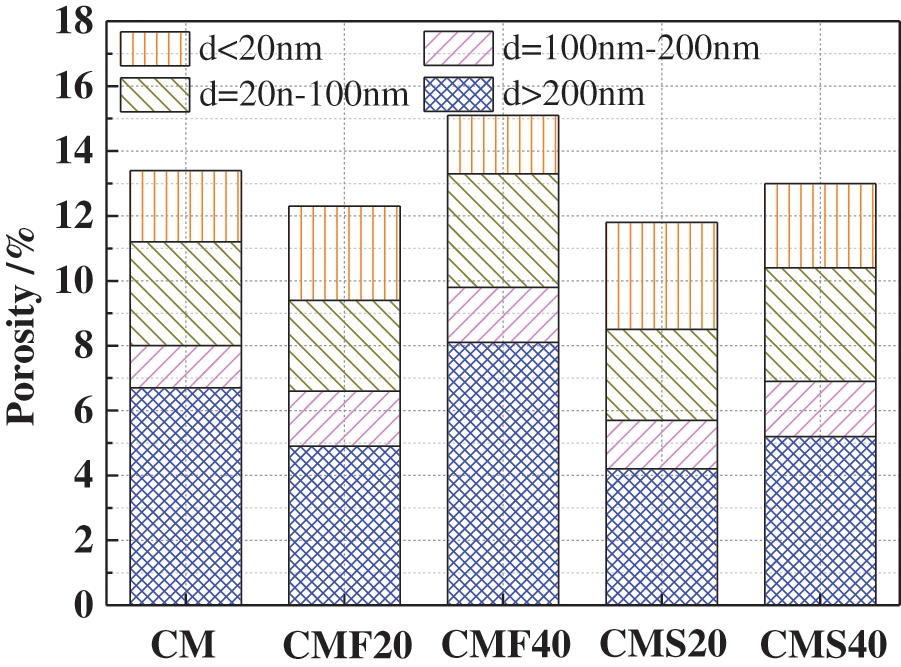
Figure 12: Pore structure of concrete with mineral admixtures after 60 days of curing
3.6.4 Evolution of Corrosion Depth
The gray value of the sample is related to the X-ray attenuation coefficient and the density value of the specimen. The brighter the X-CT image, the larger the sample density value. Cement-based materials subjected to sulfate attack will produce corrosion products that fill the pores, leading to higher density reflected in the brightening of the X-CT image. Therefore, in the process of sulfate attack on the sample, the brightening of the X-CT image indicates increasing density and there for represents the severity of the sulfate attack.
Fig. 13 shows the changes in the corrosion depth of CM under different corrosion times in magnesium sulfate solution. The black part represents the two-dimensional section of the sample without corrosion, and the yellow part represents the corrosion depth. The figure shows that corrosion depth increased rapidly with increasing immersion time. After 9 months of corrosion, the corrosion of the sample reached a depth of 4.6 mm. Based on the above experimental results, the relationship between corrosion depth and immersion time was fitted. As shown in Fig. 14, it was found that the relationship between depth of corrosion and immersion time was power function. The specific fitting equation is shown in Eq. (4)
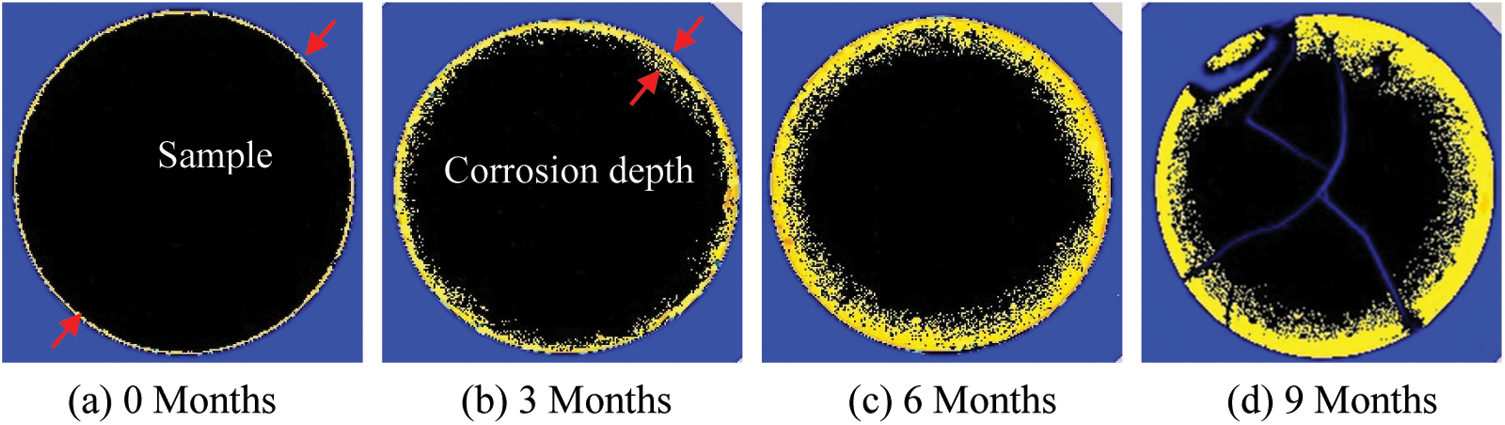
Figure 13: Corrosion depth evolution of CM in 5 w% MgSO4 solution
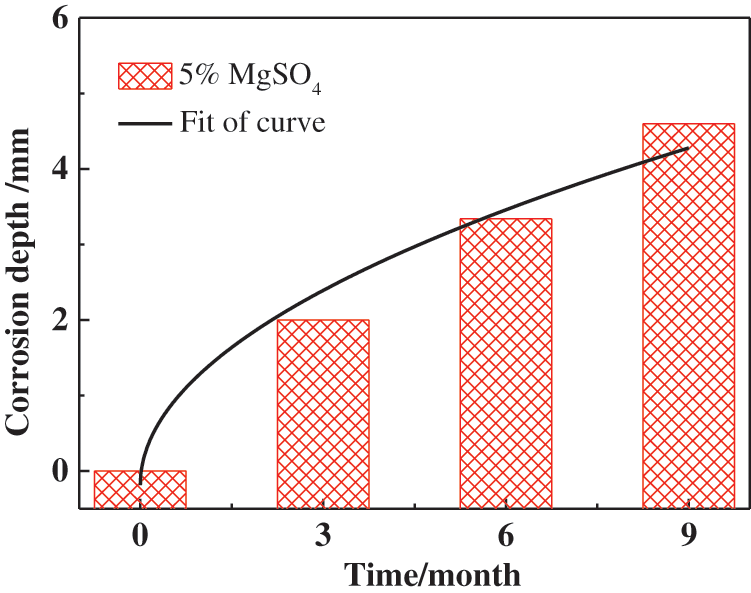
Figure 14: Relationship between depth of corrosion and immersion time of CM in 5% MgSO4 solution
3.6.5 Morphology Change of Interface Transition Zone
Fig. 15 shows the morphology change in the interfacial transition zone of CM sample after immersion in different sulfate solutions for 22 months. There are many cracks in the interfacial transition zone of CM sample after 22 months of corrosion by different sulfate solutions, and the maximum crack (38.5 μm) in the MgSO4 solution is significantly larger than the maximum crack (19.3 μm) in the Na2SO4 solution. This is because CM generated M-S-H gel without cementation in magnesium sulfate solution, which reduced the bonding performance between slurry and aggregate in concrete. The concrete structure became loose and weak, making it more likely to produce cracks. This indicates that the concrete is more severely eroded by magnesium sulfate, which is consistent with the XRD and MIP results above.
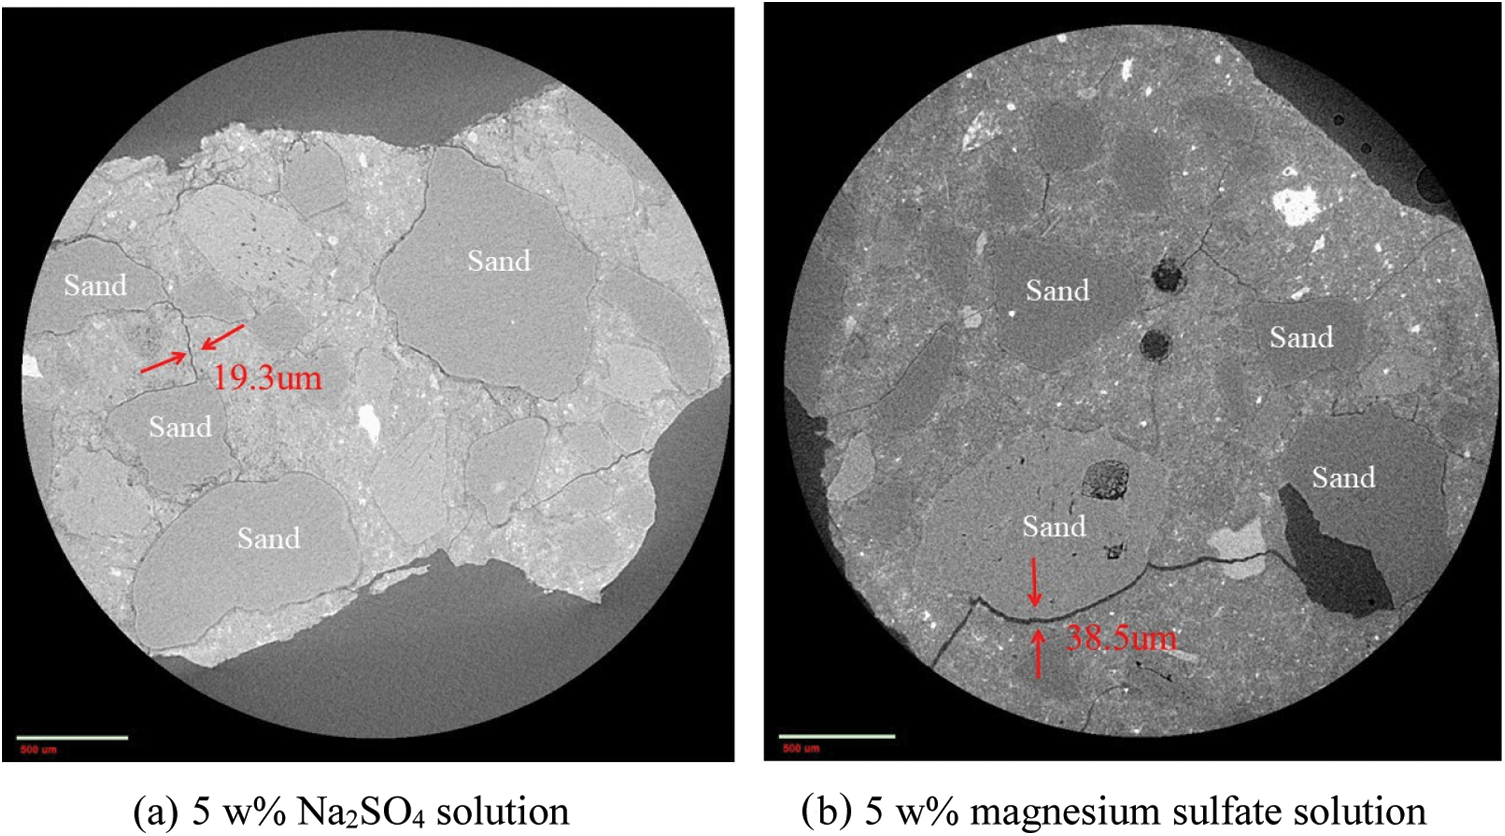
Figure 15: Morphology of the interface transition zone of CM immersed in different sulfate solutions for 22 months
This study aims to explore the deterioration process of concrete in an environment rich in magnesium sulfate and to reveal its mechanism. The following conclusions can be drawn from the experimental study:
(1) The type of sulfate solution has a noticeable influence on the damage and deterioration of concrete. The existence of magnesium ions can lead to the softening of the concrete surface layer, loosening the structure, accelerating the transmission rate of sulfate ions, and forming a more serious composite corrosion.
(2) The corrosion products of concrete in magnesium sulfate solution are not only ettringite and gypsum but also magnesium hydroxide and M-S-H gel. Therefore, the pore size of concrete is coarsened, and the porosity increases, causing a more significant crack in the interface transition zone.
(3) There is a critical dosage of fly ash for the resistance of concrete to magnesium sulfate. When the content of fly ash is less than 20%, it can improve the resistance of concrete to magnesium sulfate and vice versa. Slag can significantly improve the resistance of concrete to magnesium sulfate.
(4) The diffusion of sulfate ions into concrete is a gradual process. Under the same corrosion time, with the increase of concrete depth, the content of sulfate ions in concrete decreases monotonically. In the early stage of corrosion, the amount of sulfate ion in the concrete immersed in a magnesium sulfate solution is slightly less than that of concrete immersed in a sodium sulfate solution. However, in the late stage of corrosion, the sulfate ion content in the concrete immersed in magnesium sulfate solution is significantly higher than that immersed in a sodium sulfate solution.
Autor Contributions: Yonggan Yang designed and conducted the experiments, analyzed the data, and wrote the paper; Binggen Zhan, Qijun Yu and Yunsheng Zhang funded the experiments, Jingfeng Wang, Weiping Zhao and Yanlai Xiong provided the suggestions for the analyzing data; Zihao Kang, Wanqi Bi, Chongyang Yang, Yunfei Bi, Jianzhou Ding and Yuli Chen provided suggestions on the writing of the manuscript.
Funding Statement: This work was financially supported by “the National Natural Science Foundation of China (Grant No. 52008146)”, “the Research Fund of Henan Key Laboratory of Materials on Deep-Earth Engineering (Grant No. MDE2020-01, Henan Polytechnic University)”, “the Fundamental Research Funds for the Central Universities of China (Grant Nos. JZ2021HGTB0089, JZ2020HGQA0205)”, “State Key Laboratory of High Performance Civil Engineering Materials (2021CEM003)”.
Conflicts of Interest: The authors declare that they have no conflicts of interest to report regarding the present study.
References
1. Bary, B., Leterrier, N., Deville, E., Bescop, P. L. (2014). Coupled chemo-transport-mechanical modelling and numerical simulation of external sulfate attack in mortar. Cement and Concrete Composites, 49, 70–83. DOI 10.1016/j.cemconcomp.2013.12.010. [Google Scholar] [CrossRef]
2. Yu, C., Sun, W., Scrivener, K. (2013). Scrivener, mechanism of expansion of mortars immersed in sodium sulfate solutions. Cement and Concrete Research, 43, 105–111. DOI 10.1016/j.cemconres.2012.10.001. [Google Scholar] [CrossRef]
3. Schmidt, T., Lothenbach, B., Romer, M., Neuenschwander, J., Scrivener, K. (2009). Physical and microstructural aspects of sulfate attack on ordinary and limestone blended portland cements. Cement and Concrete Research, 39, 1111–1121. DOI 10.1016/j.cemconres.2009.08.005. [Google Scholar] [CrossRef]
4. Yong, Y., Zhang, Y., She, W., Wu, Z., Liu, Z. et al. (2018). Nondestructive monitoring the deterioration process of cement paste exposed to sodium solution by X-ray computed tomography. Construction and Building Materials, 186, 182–190. DOI 10.1016/j.conbuildmat.2018.07.145. [Google Scholar] [CrossRef]
5. Yang, Y., Zhang, Y., Zhang, W., She, W. (2018). Study on sulfate resistance of concrete with initial damage under drying-wetting cycles. Journal of Sustainable Cement-Based Materials, 7(5), 311–322. DOI 10.1080/21650373.2018.1499564. [Google Scholar] [CrossRef]
6. Alhozaimy, A., Hussain, R. R., Al-Zaid, R., Al-Negheimish, A. (2012). Coupled effect of ambient high relative humidity and varying temperature marine environment on corrosion of reinforced concrete. Construction and Building Materials, 28(1), 670–679. DOI 10.1016/j.conbuildmat.2011.10.008. [Google Scholar] [CrossRef]
7. Hossack, A. M., Thomas, M. D. A. (2015). The effect of temperature on the rate of sulfate attack of portland cement blended mortars in Na2SO4 solution. Cement and Concrete Research, 73, 136–142. DOI 10.1016/j.cemconres.2015.02.024. [Google Scholar] [CrossRef]
8. Luo, Y., Wang, C., Fang, Z., Xiao, L., Zeng, Q. (2019). The TSA degradation process of cement-based materials in the electrical field environment. Construction and Building Materials, 206, 703–716. DOI 10.1016/j.conbuildmat.2019.02.030. [Google Scholar] [CrossRef]
9. Wu, M., Zhang, Y., Ji, Y., Liu, G., She, W. et al. (2020). Effects of fly ash on portland limestone cement under sulfate attack at low temperature. Magazine of Concrete Research, 72(3), 134–148. DOI 10.1680/jmacr.18.00143. [Google Scholar] [CrossRef]
10. Yang, Y., Zhang, Y., She, W., Liu, N., Liu, Z. (2018). In situ observing the corrosion process of cement pastes exposed to different sulfate solutions with X-ray computed tomography. Construction and Building Materials, 176, 556–565. DOI 10.1016/j.conbuildmat.2018.05.093. [Google Scholar] [CrossRef]
11. Yang, Y., Zhan, B., Wang, J., Zhang, Y., Duan, W. (2020). Damage evolution of cement mortar with high volume slag exposed to sulfate attack. Construction and Building Materials, 247, 118626. DOI 10.1016/j.conbuildmat.2020.118626. [Google Scholar] [CrossRef]
12. Ganjian, E., Pouya, H. S. (2005). Effect of magnesium and sulfate ions on durability of silica fume blended mixes exposed to the seawater tidal zone. Cement and Concrete Research, 35(7), 1332–1343. DOI 10.1016/j.cemconres.2004.09.028. [Google Scholar] [CrossRef]
13. Bakharev, T. (2005). Durability of geopolymer materials in sodium and magnesium sulfate solutions. Cement and Concrete Research, 35(6), 1233–1246. DOI 10.1016/j.cemconres.2004.09.002. [Google Scholar] [CrossRef]
14. Ikumi, T., Cavalaro, S. H. P., Segure, I., Fuente, A., Aguado, A. (2016). Simplified methodology to evaluate the external sulfate attack in concrete structures. Materials and Design, 89, 1147–1160. DOI 10.1016/j.matdes.2015.10.084. [Google Scholar] [CrossRef]
15. Cefis, N., Comi, C. (2017). Chemo-mechanical modelling of the external sulfate attack in concrete. Cement and Concrete Research, 93, 57–70. DOI 10.1016/j.cemconres.2016.12.003. [Google Scholar] [CrossRef]
16. Yin, G. J., Zuo, X. B., Tang, Y. J., Ayinde, O., Wang, J. L. (2017). Numerical simulation on time-dependent mechanical behavior of concrete under coupled axial loading and sulfate attack. Ocean Engineering, 142, 115–124. DOI 10.1016/j.oceaneng.2017.07.016. [Google Scholar] [CrossRef]
17. Zhao, G., Guo, M., Cui, J., Li, J., Xu, L. (2021). Partially-exposed cast-in-situ concrete degradation induced by internal-external sulfate and magnesium multiple coupled attack. Construction and Building Materials, 294, 123560. DOI 10.1016/j.conbuildmat.2021.123560. [Google Scholar] [CrossRef]
18. Zhao, G., Shi, M., Fan, H., Cui, J., Xie, F. (2020). The influence of multiple combined chemical attack on cast-in-situ concrete: Deformation, mechanical development and mechanisms. Construction and Building Materials, 251, 118988. DOI 10.1016/j.conbuildmat.2020.118988. [Google Scholar] [CrossRef]
19. Nehdi, M., Hayek, M. (2005). Behavior of blended cement mortars exposed to sulfate solutions cycling in relative humidity. Cement and Concrete Research, 35(4), 731–742. DOI 10.1016/j.cemconres.2004.05.032. [Google Scholar] [CrossRef]
20. Chen, F., Gao, J., Qi, B., Shen, D., Li, L. (2017). Degradation progress of concrete subject to combined sulfate-chloride attack under drying-wetting cycles and flexural loading. Construction and Building Materials, 151, 164–171. DOI 10.1016/j.conbuildmat.2017.06.074. [Google Scholar] [CrossRef]
21. Chen, F., Gao, J., Qi, B., Shen, D. (2017). Deterioration mechanism of plain and blended cement mortars partially exposed to sulfate attack. Construction and Building Materials, 154, 849–856. DOI 10.1016/j.conbuildmat.2017.08.017. [Google Scholar] [CrossRef]
22. Aye, T., Oguchi, C. T. (2011). Resistance of plain and blended cement mortars exposed to severe sulfate attacks. Construction and Building Materials, 25(6), 2988–2996. DOI 10.1016/j.conbuildmat.2010.11.106. [Google Scholar] [CrossRef]
Cite This Article
 Copyright © 2023 The Author(s). Published by Tech Science Press.
This work is licensed under a Creative Commons Attribution 4.0 International License , which permits unrestricted use, distribution, and reproduction in any medium, provided the original work is properly cited.
 Downloads
 Citation Tools