
 Submit a Paper
 Propose a Special lssue
 Open Access
ARTICLE

Evaluation of Water Transfer Capacity of Poplar with Pectinase Treated under the Solar Interface Evaporation
1 Nanjing Forestry University, Nanjing, 210037, China
2 Jiangsu Vocational College of Agriculture and Forestry, Jurong, 212400, China
* Corresponding Author: Dagang Li. Email:
(This article belongs to the Special Issue: Advanced Wood Composites from Renewable Materials)
Journal of Renewable Materials 2023, 11(5), 2265-2278. https://doi.org/10.32604/jrm.2023.025483
Received 15 July 2022; Accepted 15 August 2022; Issue published 13 February 2023
 View Full Text
 Download PDF
Abstract
Poplar wood, which was used as the absorption material for the solar-driven interfacial evaporation, was treated for 3 days, 6 days and 9 days with the pectinase, and then was simulated for photothermal evaporation test at one standard solar radiation intensity (1 kW⋅m−2). The effects of pectinase treatment on cell passage and water migration capacity of poplars were analyzed by the mercury intrusion porosimetry, the scanning electron microscope and fractal theory. It was found that the pit membrane and the ray parenchyma cells of poplar wood were degraded and destroyed after pectinase treatment. Compared with the untreated poplar wood, the evaporation rate of three sections of the specimen was changed. Especially the evaporation rate of radial and tangential direction was significantly increased. At the same time, based on the experimental data and fractal dimension deduction, fractal characteristics could be found in that the structure of poplars treated with pectinase. The porosity decreased with the increase of the fractal dimension in a certain range. It was shown that it is feasible to evaluate solar-driven water migration capacity by using fractal theory.Keywords
Abbreviations
| AGP: | Arabinogalactan protein. |
| NPP: | Poplar specimens that were not treated with pectinase. |
| P3P/P6P/P9P: | Poplar specimens that were treated with pectinase for 3 days, 6 days and 9 days. |
| NPPC/NPPR/NPPT: | Cross section, Radial section and Tangential section of poplar not treated with pectinase. |
The solar-driven interfacial evaporation is a new technology which uses the absorber material to form the liquid-solid-vapor interface to achieve efficient purification of water by solar energy [1,2]. This technology has good application value in alleviating the water environmental pollution and improving the water quality [3]. In recent years, a lot of research had been done on solar-driven interface evaporation technology based on micro-nano structures in the aspects of absorber materials [4,5], photothermal management [6–8] and water transport [9,10]. Among them, the absorption material was the core of the three-phase liquid-solid-vapor interface, which would be the focus of the research. And the commonly used high-efficiency and broad-spectrum absorber materials were plasmon-based and carbon-based [1].
Plasmon-base materials are non-radiative attenuation of plasma-excited electrons in the landau damping mechanism under the laser resonance illumination, which redistributes the energy of electron-electron and electron-phonon scattering process, thus enhancing the optical absorption rate [11]. The reported plasmon-based materials include gold nanoparticles [12], silver nanoparticles [13] and transition metal nitrides [14,15], etc. Due to the complex preparation process and high cost [16], the application range is not wide. In contrast, the carbon-based material is one of the main absorption materials for solar steam conversion for their low cost, excellent light absorption and good stability. Typical carbon-based materials include carbon black, graphite, graphene, graphene oxide, carbon nanotubes and some carbon-containing composites. As a natural carbon-based material, wood has been the research object of solar-driven interfacial evaporation absorbent material, because of its good hydrophilicity, abundant and crisscrossed micro-nano channels, and the charateristics of easily floating on the water surface [17]. Most of the existing research had focused on the design of photothermal management of wood surfaces, such as surface carbonization [18,19], composited carbon black [20,21], graphite [22], graphene oxide [23,24] and other carbon-based materials, to achieve a higher light absorption rate, and enhance water-steam conversion efficiency.
At present, there are three main ways to use external means of clearing wood cell channels and improve water vapor transport capacity, namely chemical treatment, external forces (mechanical force, steam force, freezing force) and biological treatment [25], etc. The aim was to force the wood cell wall pit membrane to rupture, so as to dredge or enlarge the cell fluid flow channel. Among them, various enzyme preparations were used in the enzyme-treated wood to decompose woods’ bordered pit or ray thin-walled cells, so as to improve the permeability of woods [26,27]. Because Pectin (C6H10O5) n is one of the substances that constitute the cytoplasm of higher plants and connect adjacent cell walls [28]. It is speculated that the pectin content should be between 10 and 40 mg⋅g−1 in the wood. It indicates that about 25%–50% cellulose chain is closely bound to pectin, and some Xyloglucan and Arabinogalactan protein (AGP) are mixed into it, and then covalently cross-linked with pectin and closely bound with microfibrils to form cell walls [29,30]. Pectinase contains pectinesterase, polygalacturonidase, lyase, propectinase and other components [31]. After pectinase pretreatment, the pectin macromolecular chain among wood fibers is easy to break, and the structure of the impurity complex is loose, which promotes the separation of wood fibers [32], expands the path of the liquid flow in the wood, and improves its permeability [33].
The advantages of abundant pectinase sources, pollution-free degradation components, suitable for water resources utilization, etc., would be fully utilized in this study to pretreat the fast-growing poplar with straight fiber, simple structure and wide cultivation range. By degrading pectin between wood cells and dredging cell channels of poplar, water permeability of poplar could be improved, and would be tested as a solar-driven interfacial evaporation absorbent material. The effect of pectinase on the permeability of treated poplar wood and the feasibility of applying pectinase to solar-driven interfacial absorbent materials were analyzed by methods of mercury injection, scanning electron microscope and fractal theory.
Poplar wood: Populus × canadensis ‘I-214’, the growing season was 12 years old poplar, from Suqian city, Jiangsu Province (China). Its DBH (Diameter at Breast Height) was about 400 mm, and the width of the growth wheel was about 12–15 mm. The sapwood part was selected as the specimen. After natural drying, the sizes of poplar specimens with different sections were: R × T × L, R × L × T, and T × L × R (30 mm × 30 mm × 10 mm). Five specimens were prepared for each section.
350 ml of PH3.5 buffer was prepared. Then, 1% pectinase (350×1%=3.5 g) was added to the PH3.5 buffer. At 25°C, the viscosity of the mixture was 1.60 mPa⋅s, for reserve. Pectinase, produced by Phygene Company, (Fuzhou, China) CAS no. 9032-75-1, activity ≥ 500 U/mg, the molecular weight is 20–60 kD.
Pectinase pretreatment: the poplar specimens were soaked in pectinase mixture solution at 25°C and 0.08 MP under vacuum pressure for 1 h, with a normal pressure 50°C water bath to activate pectinase. After 3 days (72 h), 6 days (144 h) and 9 days (216 h) of enzymatic action, the poplar specimens were inactivated at 100 for 1 h and dried in vacuum at 60 for 12 h. At this time, the moisture content was determined to be 8%. The wax sealing thickness of each specimen was about 0.1 mm in the thickness direction, which was waterproof. Then, specimens were bagged for reserve. The poplar specimens that were not treated with pectinase were denoted as NPP, and those treated with pectinase for 3 days, 6 days and 9 days were denoted as P3P, P6P and P9P.
2.3 Photothermal Evaporation Test
In order to demonstrate the effectiveness of the pectinase-treated poplar wood on water migration during photothermal evaporation, a photothermal evaporation system was designed as shown in Figs. 1a and 1b. The air conditioner was used to control the indoor temperature and humidity, setting the temperature to 20°C and the humidity to 40%. And hygrothermograph was used to timely monitoring. The poplar specimen was tightly embedded into the square hole of the PVC plate according to the actual size, and was flush with the surface of the PVC plate. Only the floating surface has static contact with water, and the side of the specimen did not contact the liquid surface, as shown in Fig. 1c. The photochemical atmospheric pressure reactor (CEL-HXF300-T3) simulated the solar light source and adjusted to a standard solar radiation intensity of 1 kW⋅m−2 (Optical power meter: CEL-NP2000-2 (10) A) to irradiate the poplar specimen, forming the gas-liquid evaporation interface. The electronic balance (Sartorius0.1 mg) recorded the data every 5 min to accurately weigh the evaporation mass change. FLIR thermal imager recorded one evaporation interface for 5 min to characterize the photothermal intensity of the evaporation interface.
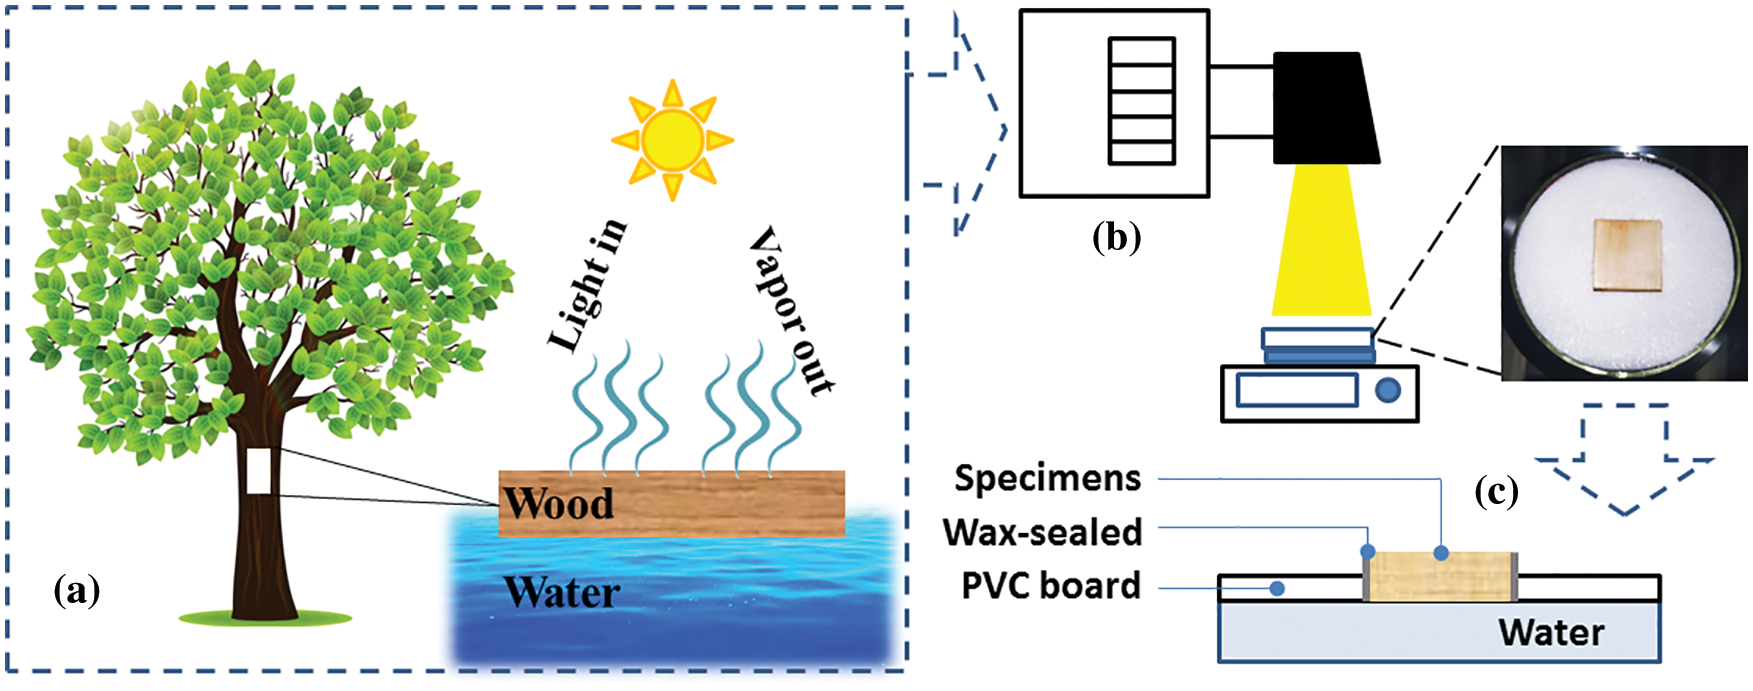
Figure 1: The schematic diagram of photothermal transpiration test. (a) It was inspired by the transpiration of the sun on the trees; (b) The Schematic of test design. (c) Because the diameter of the petri dish is 90 mm, the PVC (5 mm thickness) was made into a circular plate with 90 mm diameter, and a square hole of the same size as the specimen was cut out in the center of the PVC disk. The specimen was embedded in the square hole of the PVC round plate, and the lower surface of the specimen was just flush with PVC. The assembled PVC round plate was put into the Petri dish containing purified water to float, so that the specimen surface was just in contact with the water.
Mercury Intrusion Porosimetry (MIP) was performed using the MicroActive AutoPore V 9600 instrument (Micromeritics Instrument Corporation, USA) to obtain the textural properties of the specimen, including pore volume, porosity and aperture size distribution. At the beginning of the measurement, the pressure of the specimen immersed in non-wet mercury was increased from 0.10 psi to 61000.00 psi. The equilibrium time for each pressure increment was set at 5 s. With the pressure increasing, the mercury intrudes progressively from the big pores to the small pores. The pore volume could be derived from the quantity of the intruded mercury. The pore size distribution could be determined according to the Washburn equation, which gives a relationship between pressures and pore size:
where r is pore radius, p is pressure, γ = 0.48 N/m and is the surface tension of mercury, θ = 130° and is the wetting angle of mercury. The calculation formulas of the other parameters, such as porosity, pore size distribution and so on:
where ε is Porosity, VHg is the actual volume of mercury pressed into the specimen, VS is the volume of the specimen. DV(r) is the volume pore size distribution.
So, the MIP test can be used to compare and analyze the changes of the porosity, permeability and other characteristics of specimens NPP, P3P, P6P and P9P.
2.5 Microstructural Characterization Test
Scanning Electron Microscopy (SEM) was used to observe the microscopic characterization of poplar specimens to understand the effect of pectinase on poplar cell channels. The following steps were taken for the surface treatment of the test specimen: Step one, the specimens were soaked in high-temperature ionized water (80°C) for 24 h until they were completely submerged in water. The purpose is to improve the strength of the wood fiber and facilitate the wood surface treatment. Step two, the specimens were cut into small pieces according to the requirements of SEM and soaked for 24 h to soften the treatment. Ultrathin microtome (TU-213 sliding type, Japan) was used to trim the scanning surface and remove the wood surface fibers. Step three, the specimens were vacuum freeze-dried (−60°C) for 72 h. The last, the specimens were glued to the sample shelf with conductive glue and sprayed with gold. Scanning electron microscopy (FEI, Hillsboro, USA) was used to characterize the micromorphology of the wood.
2.6 Derivation of Fractal Dimension of Wood Porosity
As a porous material, the structure of wood is very complex. At present, wood permeability, porosity and other parameters are mainly determined by experimental measurement and numerical simulation. There is no effective theoretical method to accurately express the water migration capacity in wood. In recent years, there have been many studies on the transport properties of porous materials by fractal theory [34–37]. This paper attempts to deduce the fractal dimension of wood porosity, and to evaluate the water migration capacity of the poplar treated by pectinase.
A unique property of the fractal object is that its measurement M(L) obeys the following scaling relationship with the measurement scale L [38]:
where D is the fractal dimension, M(L) can be the mass, volume, area or length of a curve of an object, and L is the scale.
In the mercury injection test of poplar treated by pectinase, under the action of pressure P, the absorbed volume V of mercury immersed in the specimen is a function of wood pore size r and mercury pressure P, that is, V(r, P), with pore size r as the scale, so the formula above can be changed into:
D(P) is the fractal dimension of mercury pressed into wood pore space under the action of pressure P, and the ratio of mercury pressed volume to linear dimension r is an important fractal method. That is, the fractal dimension D is a function of the mercury pressure P, and the higher the mercury pressure P, the greater the amount of mercury filling the gaps in the wood. Obviously, the fractal dimension must also be a function of the wood species (or, as in the case of pipe diameter r). In this experiment, after pectinase treatment, the tissue channels of poplar were changed, which could be simulated and deduced by referring to the function relation of (5), and verified by comparison with the mercury injection test value.
According to the fractal principle, it is assumed that wood is a set of N capillaries with pore radius r, which can be expressed by the following formula [39]:
where P(r) is the distribution density function of pore radius, a is the proportionality constant, and Df is the fractal dimension of a specimen. Assuming that radius r is equal to capillary length L, the wood pore volume can be calculated as:
According to the Washburn equation
Take the logarithm of both sides, then:
If
Thus, the corresponding relationship between fractal dimension and mercury injection test values (pressure and volume) was established. According to the mercury injection test, the intrusion pressure of the specimen measured and the volume of mercury pressed into the specimen can be fitted to get the slope K value. Eq. (10) was set as:
And then the fractal dimension Df can be calculated:
3.1 Quality Comparison of Photothermal Evaporation Water
As can be seen from Fig. 2, the change of evaporation water quality of poplar wood without pectinase treatment is Cross > Radial > Tangential, which is consistent with the law of wood penetration in all directions. By comparing the three sections under the same conditions, it is found that the photothermal evaporation values of four poplar specimens are basically the same on the cross section of poplar, namely NPPC≈P3PC≈P6PC≈P9PC, among which the value of P6PC is slightly larger; in the test of radial and tangential evaporation quality change, the pectinase treated poplar was significantly greater than that of untreated poplar, indicating that pectinase had a positive effect on improving the permeability of poplar, which should be to achieve the degradation or destruction effect on the bordered pit membrane and ray parenchyma cell inclusions.
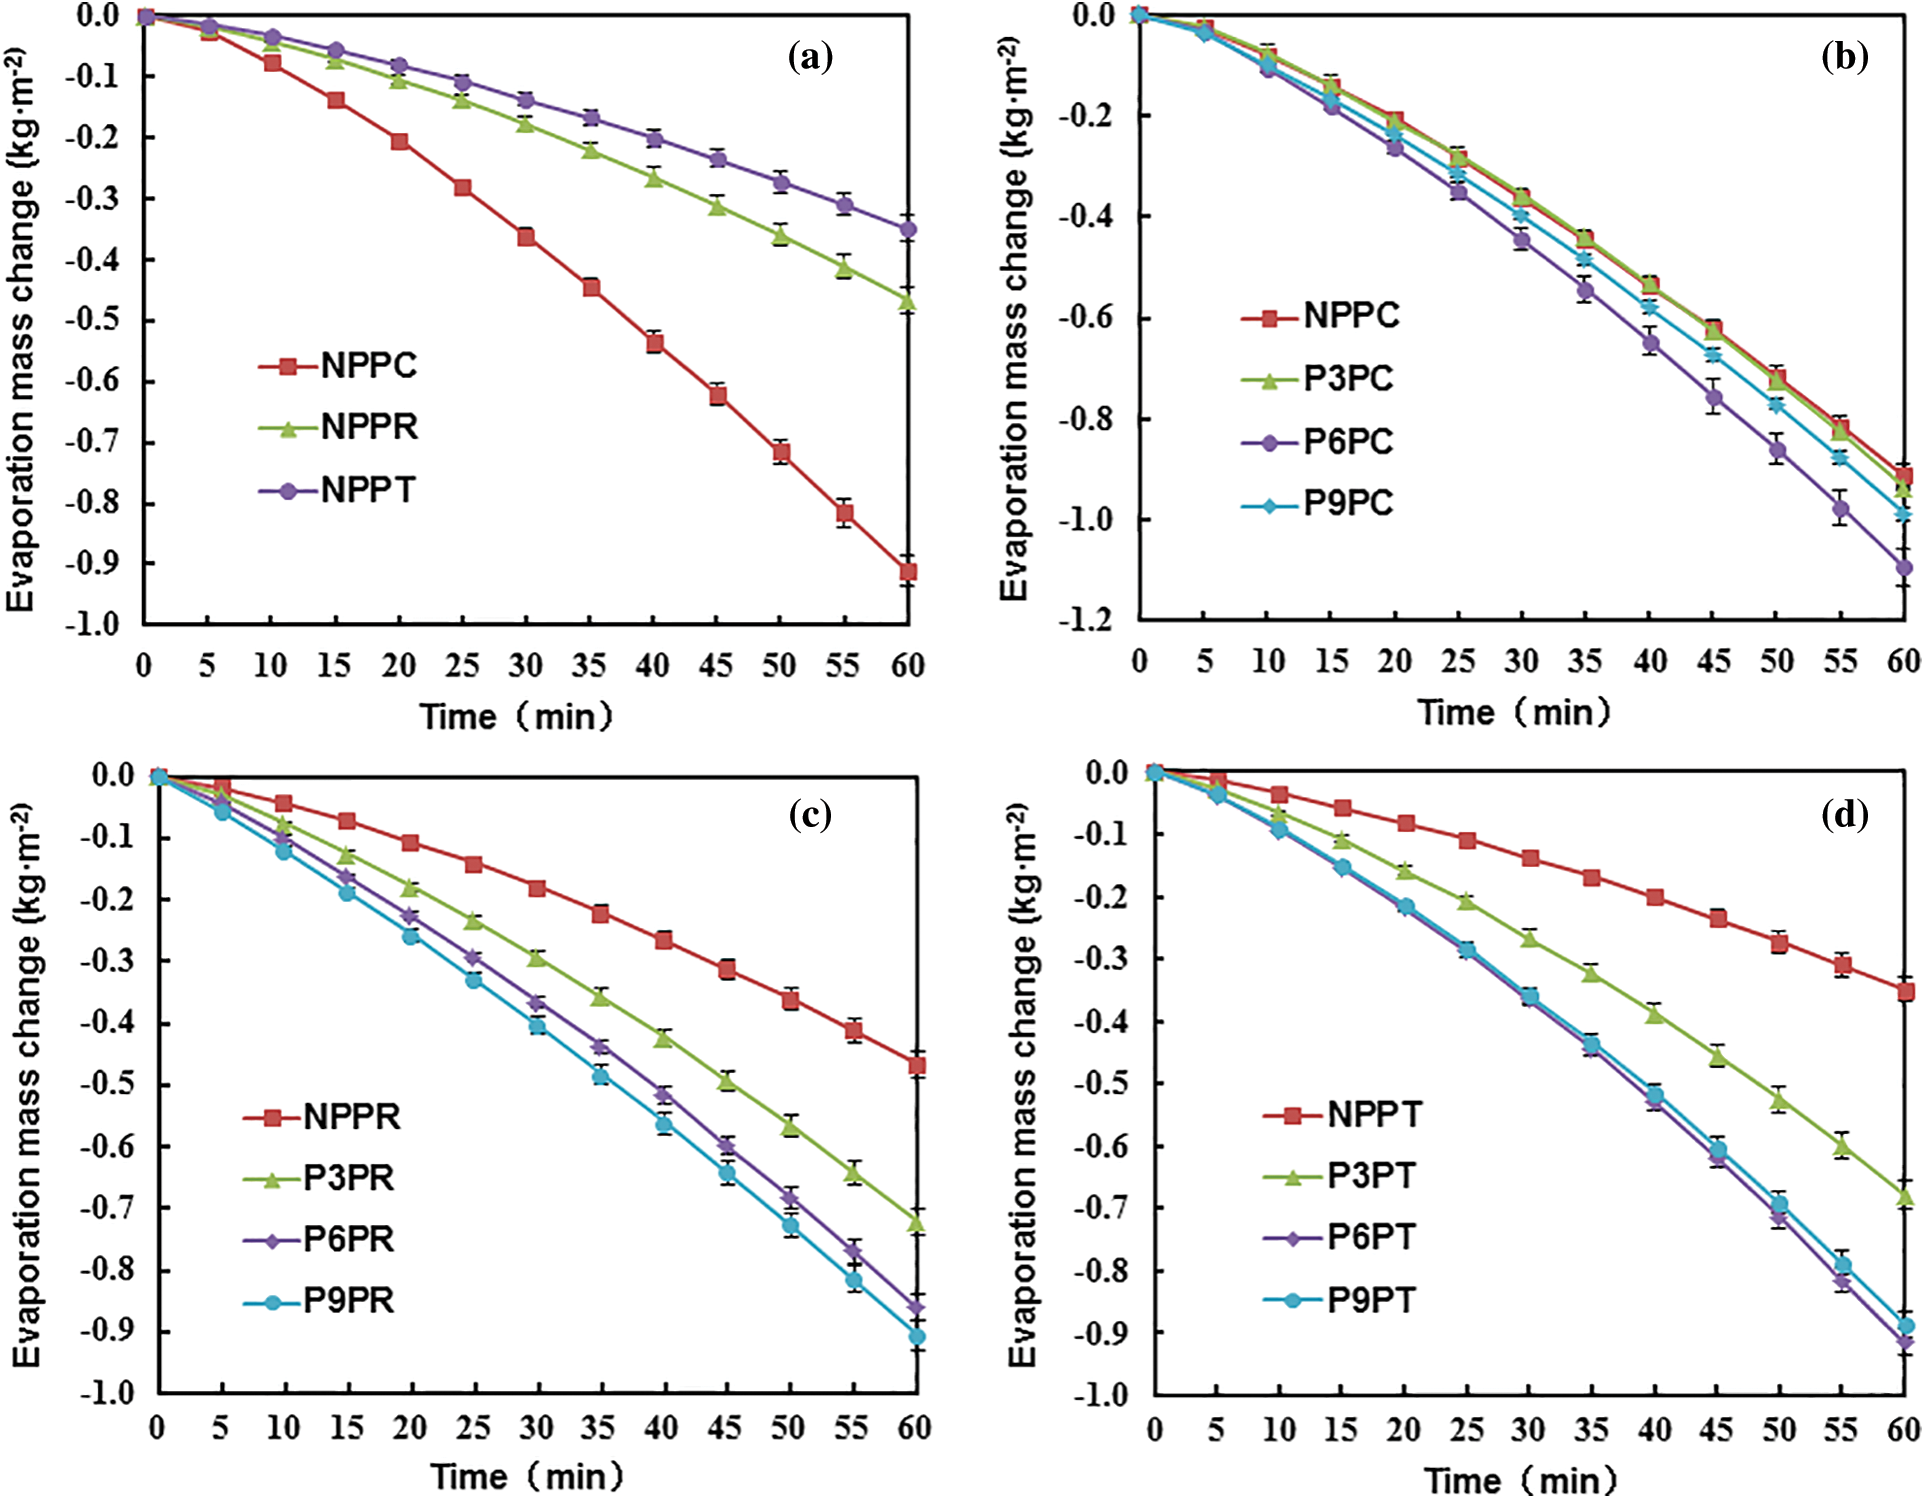
Figure 2: Changes in the quality of evaporation of specimens under 1 kW⋅m−2 light intensity (a) Evaporation quality of untreated poplar in three sections; (b) Change of evaporation mass in cross section of poplar; (c) Change of evaporation mass in radial section of poplar; (d) Change of evaporation mass in tangential section of poplar
Under the 8% moisture content, the photothermal transpiration test of 1 kW⋅m−2 light intensity was carried out on the cross section, radial section and tangential sections of poplar, and the temperature change was observed intuitively by an infrared thermal imager. Considering the pits and ray microstructure, the radial section specimen is taken as an example. The surface temperature changes of poplar (Radial section) specimens NPPR, P3PR, P6PR and P9PR after exposure to light for 0, 10, 20, 30, 40, 50 and 60 min, is shown in Fig. 3, which is the photothermal effect of the C=C conjugated double bond contained in the aromatic and benzene rings of lignin in wood. As can be seen from Fig. 3a, with the change of time, water penetration converges from the edge of the specimen to the middle. Fig. 3b shows that in the middle part of the specimen surface, due to the high light intensity and fast evaporation of water, the surface absorbency of poplar treated with pectinase was higher than that of untreated poplar, which was also confirmed by the water evaporation data of each specimen 60 min later: NPPR is 0.47 kg⋅m−2, P3PR is 0.72 kg⋅m−2, P6PR is 0.86 kg⋅m−2, and P9PR is 0.90 kg⋅m−2, form the relationship of P9PR > P6PR > P3PR > NPPR.
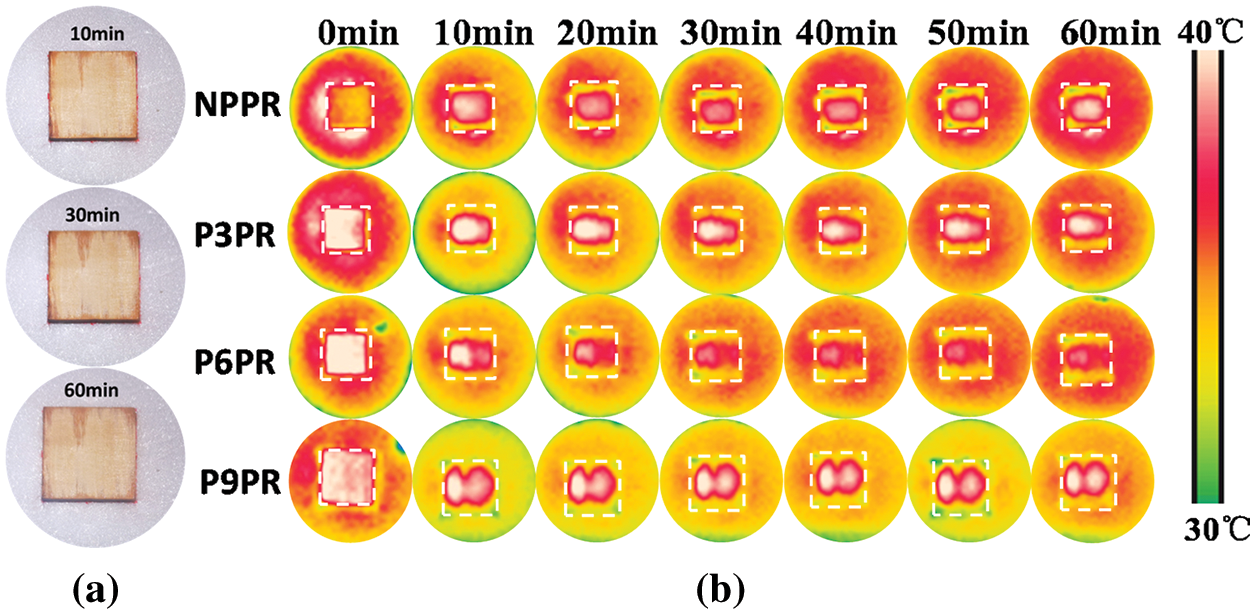
Figure 3: Infrared image of poplar at 1 kW⋅m−2 simulated solar illuminance. (a) Evaporation process; (b) Evaporative thermal imaging process
The overall test results of the pore structure of the specimens are shown in Table 1. It can be seen that the total volume of mercury injected is P3P > P6P > NPP > P9P, and the bulk density is P3P < P6P < NPP < P9P, which positively indicates that the bulk density is negatively correlated with the porosity and the total volume of mercury injected [40]. The permeability of the specimens shows a relationship of P3P > P6P > P9P > NPP, indicating that pectinase had a certain effect on the dredging of internal pores of the wood, which was related to the treatment time of pectinase. At the same time, the relationship of porosity is P3P > P6P > NPP > P9P. So, the porosity and permeability of P3P and P6P are better than that of P9P. This may be related to the blocking of wood cell channels by partially precipitated impurities after 9 day pectinase reaction [33]. In addition, under the influence of pectinase, wood cell tissue has the potential to degrade, the effect of 9 days is higher than that of 6 days and 3 days. Under the influence of mercury injection pressure, it can cause the wood cell wall to “collapse” and create a blockage in the pore, which can be seen in the MIP Permeability data: P9P < P6P < P3P. This also requires us to further verify from the aspect of cell mechanics in subsequent studies.

The mercury injection curves of 4 specimens are shown in Fig. 4, including the accumulated loading curve and pressure relief curve. To further explain the difference of mercury injection, the mercury injection increment curve was plotted. As can be seen from the figure, with the increase of intrusion pressure, mercury first enters larger pores at a lower pressure and smaller pores at a higher pressure. The cumulative absorption of mercury increases and the size of the absorption are structure-dependent.
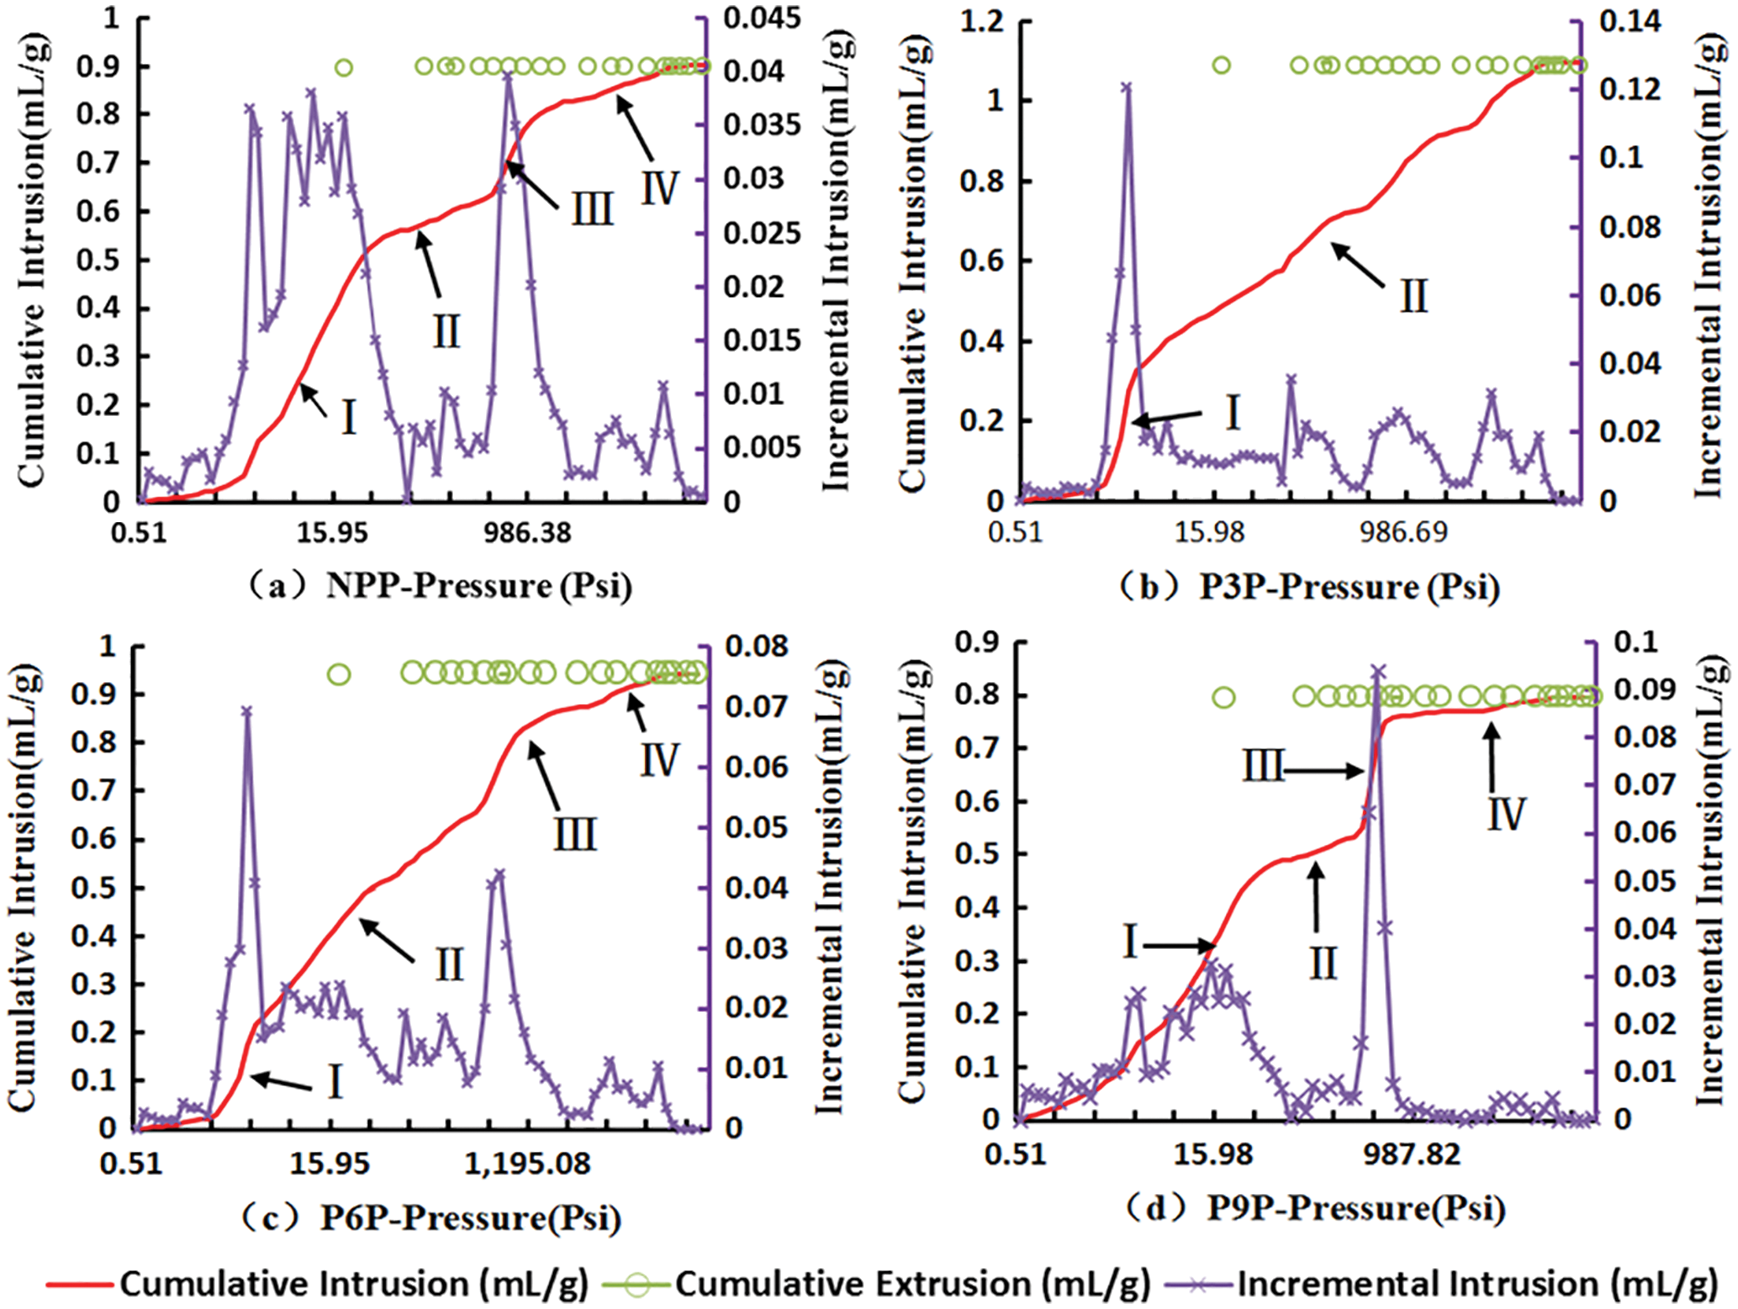
Figure 4: Mercury injection permeability diagram of specimens
For specimen NPP (Fig. 4a), when the mercury pressure reaches 0.51 psi, the mercury liquid first invades the pores of NPP. As pressure increases, mercury absorption increases rapidly due to the presence of large pores (segment I); when the intrusion pressure reaches 24.96 psi, the increase of mercury injection volume becomes stable, indicating that mercury invasion is transitioning from large pore to middle pore (segment II); the mercury injection volume increases rapidly after the breakthrough pressure of 417.92 psi passing through the mesopore (segment III); with the increase of pressure, the mercury liquid flows into the mesopore. With the increase of pressure to 13172.05 psi, mercury begins to enter smaller micropores (segment IV); however, these pores are very difficult to penetrate until the pores are completely filled at a pressure of 32994.45 psi. In Fig. 4b, the mercury injection amount of specimen P3P increases rapidly in the large-pore stage (segment I), and increase steadily with less fluctuation after entering the mid-pore stage (segment II). As shown in Fig. 4c, compared with NPP, the mercury injection amount of P6P increases steadily, but fluctuates more than that of P3P, that is, the times of breakthrough pressure increases.
In general, the cumulative mercury injection volume of P3P and P6P is higher than that of NPP, The total accumulated pressure volume of P9P is low. From the incremental mercury injection curve, with the increase of pressure, the increment peak of untreated specimen NPP is relatively balanced, mainly concentrated in large and medium pore size regions, but the maximum increment value is only 0.04 mL/g. The maximum increment value of the P3P increment peak in the large aperture region is 0.12 mL/g, and the maximum increment value in the medium aperture region is 0.04. The increment value of P6P in the medium and large aperture region is relatively balanced, and the maximum increment value is 0.07 mL/g. The mercury injection volume of P9P in the mesopore region is suddenly higher (Fig. 4d), reaching 0.09 mL/g, but the total mercury injection volume is the lowest, which is related to a small amount of precipitation of pectinase in the cell channel.
3.3 Characterization Analysis of Microstructure
It can be seen from the scanning electron microscopy (SEM) test that the striatal pores of NPP in Fig. 5a are densely arranged in hexagons, typical alternate pitting, and the pit membrane is clearly visible. Pectinase particles have been attached around the pit aperture of the P3P specimen, and the pit membrane has a tendency for degradation, as shown in Fig. 5b. The pit membrane of the P6P specimen almost disappeares (Fig. 5c), and the pit is irregularly round due to the reduction of the tension force of the pit membrane. In Fig. 5d, the P9P specimen has a higher degree of degradation of the pit membrane, but there are also some suspected deposits after the pectinase reaction attached to the wall of the vessel, which may block the channel.
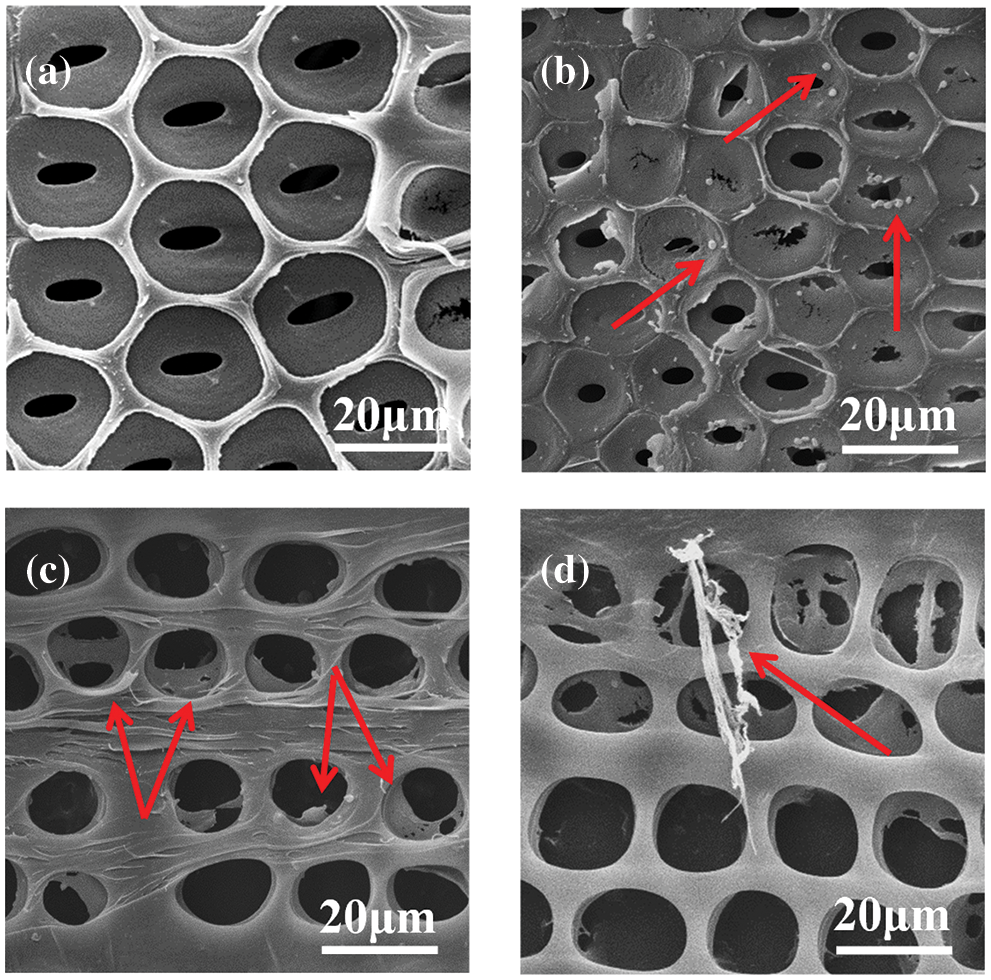
Figure 5: SEM image of pits of specimen. (a) Untreated poplar pits; (b) Pectinase treatment of 3 day pits; (c) Pectinase treatment of 6 day pits; (d) Pectinase treatment of 9 day pits
The transverse ray cells of poplar without pectinase treatment are shown in Fig. 6a, with gelatinous material inside. As shown in Fig. 6b, the gelatinous material is greatly reduced in the ray cells treated with pectinase for 3 days. The ray cells of P6P and P9P are smooth and unobstructed (Figs. 6c and 6d), which further indicates that pectinase has a positive effect on improving the lateral permeability of poplar.

Figure 6: SEM image of ray cell of specimen. (a) Untreated poplar ray cells; (b) Pectinase treatment of 3 day ray cells; (c) Pectinase treatment of 6 day ray cells; (d) Pectinase treatment of 9 day ray cells
3.4 Analysis of Fractal Characteristics of Poplar
The relationship between Pressure and Volume is formed after mercury injection test of pectinase treated poplar woods, as shown in Fig. 7. Regression analysis of NPP, P3P, P6P and P9P is conducted in logarithmic mode the slope K value can be obtained by regression formula. According to formula (11), the relation
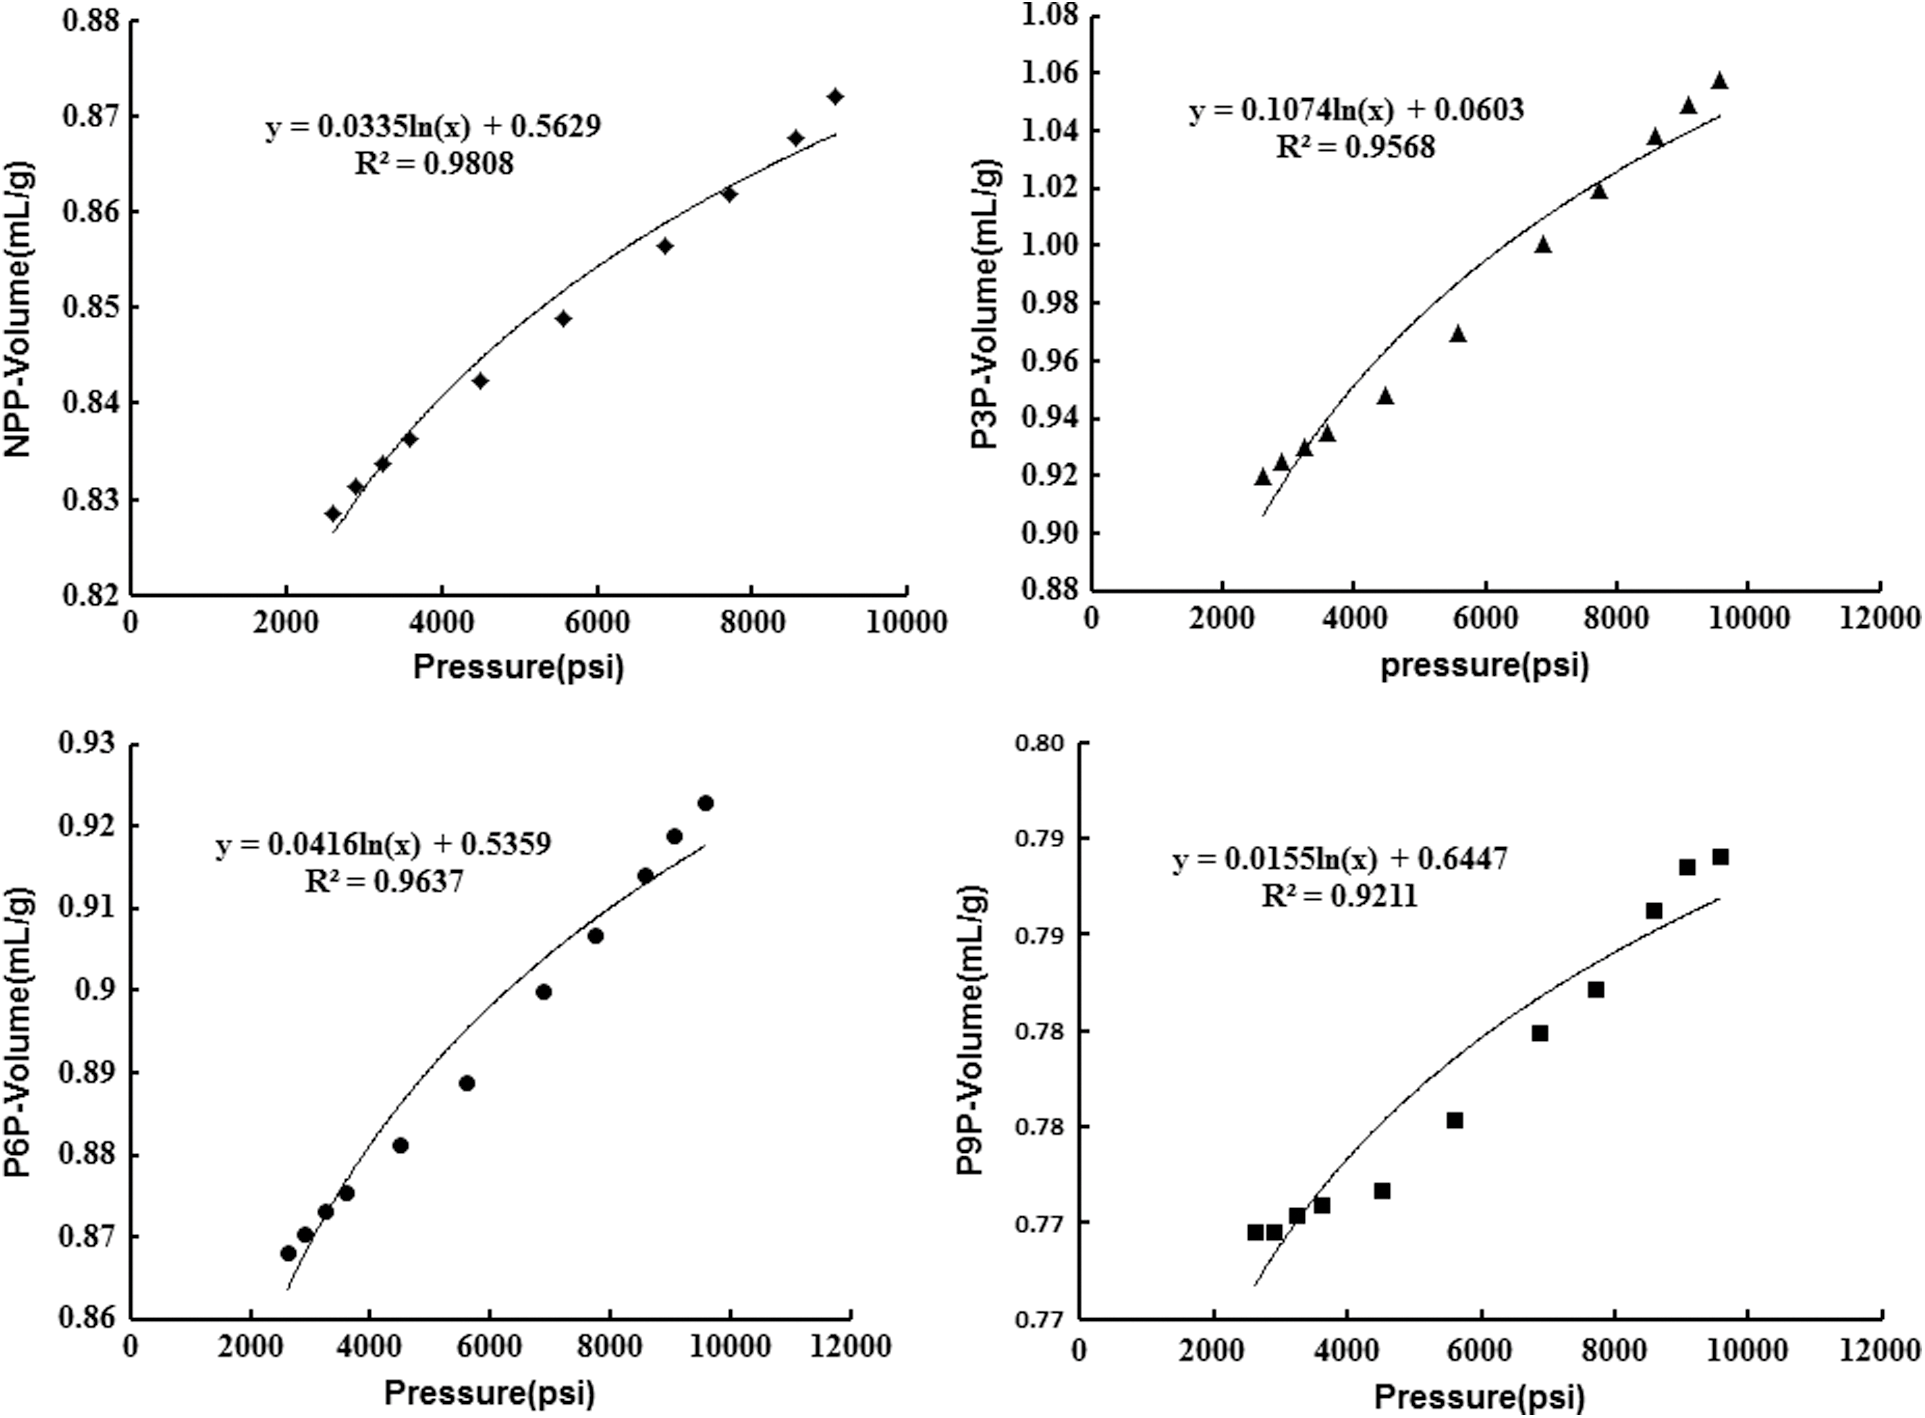
Figure 7: The slope K value of fitting curve

Table 2 shows that the calculation values are highly matched with the experimental data, indicating that the calculation formula of fractal dimension is feasible. At the same time, DP9P > DNPP > DP6P > DP3P, εP9P < εNPP < εP6P < εP3P. Also when fractal dimension D > 2.83, porosity P decreased with the increase of fractal dimension Df [41]. The results showes that the structure of pectinase treated poplar has fractal characteristics, which further verifies the approximate correlation degree of pectinase treatment on poplar photothermal evaporation test data. It shows that fractal theory can be applied in the evaluation of the water migration capacity of woods.
(1) Pectinase can degrade and destroy the pit membrane, ray parenchyma cells and other tissues of poplar, which can improve its permeability, especially improve the transverse permeability of poplar. As a result, pectinase-treated poplar wood can increase water transpiration weight under the solar energy drive.
(2) The longer pectinase treatment time on poplar wood is not the best. It is possible to reduce the wood permeability due to the degradation of substances blocking the channel, and may cause the mechanical properties of wood cell tissues to decline, which also requires us to further verify from the aspect of cell mechanics in subsequent studies.
(3) The structure of poplar with pectinase treated has fractal characteristics. Fractal theory can be applied in the evaluation of the water migration capacity of wood.
Funding Statement: The authors’ funding is supported by the Fundamental Research Funds Jiangsu Vocational College of Agriculture and Forestry (2021KJ20).
Conflicts of Interest: The authors declare that they have no conflicts of interest to report regarding the present study.
References
1. Wei, T., Li, X., Li, J., Zhou, L., Zhu, S. et al. (2018). Interfacial solar vapor generation. Chinese Science Bulletin, 63, 1405–1416 (in Chinese). DOI 10.1360/N972018-00344. [Google Scholar] [CrossRef]
2. Zhou, L., Li, X., Ni, G., Zhu, S., Zhu, J. (2019). The revival of thermal utilization from the Sun: Interfacial solar vapor generation. National Science Review, 6(3), 562–578. DOI 10.1093/nsr/nwz030. [Google Scholar] [CrossRef]
3. Gao, M., Zhu, L., Peh, C. K., Ho, G. W. (2019). Solar absorber material and system designs for photothermal water vaporization towards clean water and energy production. Energy and Environmental Science, 12(3), 841–864. DOI 10.1039/C8EE01146J. [Google Scholar] [CrossRef]
4. He, Y., Li, H., Guo, X., Zheng, R. (2019). Delignified woodbased highly efficient solar steam generation device via promoting both water transportation and evaporation. BioResources, 14(2), 3758–3767. DOI 10.15376/biores. [Google Scholar] [CrossRef]
5. Li, X., Tong, Q., Wang, N. (2021). Study on preparation of CuS/rGO/PVA porous hydrogel with photothermal conversion performance. Shandong Chemical Industry, 50(11), 29–32. DOI 10.19319/j.cnki.issn.1008-021x.2021.11.011. [Google Scholar] [CrossRef]
6. Li, T., Liu, H., Zhao, X., Chen, G., Dai, J. et al. (2018). Scalable and highly efficient mesoporous wood-based solar steam generation device: Localized heat, rapid water transport. Advanced Functional Materials, 28(16), 1707134. DOI 10.1002/adfm.201707134. [Google Scholar] [CrossRef]
7. Gong, F., Wang, W., Li, H., Xia, D., Dai, Q. et al. (2020). Solid waste and graphite derived solar steam generator for highly-efficient and cost-effective water purification. Applied Energy, 261, 114410. DOI 10.1016/j.apenergy.2019.114410. [Google Scholar] [CrossRef]
8. Cheng, S., Yu, Z., Lin, Z., Li, L., Li, Y. et al. (2020). A lotus leaf like vertical hierarchical solar vapor generator for stable and efficient evaporation of high-salinity brine. Chemical Engineering Journal, 401, 126108. DOI 10.1016/j.cej.2020.126108. [Google Scholar] [CrossRef]
9. Wang, Z., Yan, Y., Shen, X., Sun, Q., Jin, C. et al. (2020). Candle soot nanoparticle-decorated wood for efficient solar vapor generation. Sustainable Energy & Fuels, 4(1), 354–361. DOI 10.1039/C9SE00617F. [Google Scholar] [CrossRef]
10. Ni, G. W., Zandavi, S. H., Javid, S. M., Boriskina, S. V., Chen, G. (2018). A Salt-rejecting floating solar still for Low-cost desalination. Energy & Environmental Science, 11(6), 1510–1519. DOI 10.1039/c8ee00220g. [Google Scholar] [CrossRef]
11. Brongersma, M. L., Halas, N. J., Nordlander, P. (2015). Plasmon-induced hot carrier science and technology. Nature Nanotechnology, 10(1), 25–34. DOI 10.1038/nnano.2014.311. [Google Scholar] [CrossRef]
12. Han, P., Jiang, C., Zhang, X. (2019). Research progress of functional materials with photothermal conversion ability. Petrochemical Technology, 48(5), 522–528. [Google Scholar]
13. Fang, J., Liu, Q., Zhang, W., Gu, J., Su, Y. et al. (2017). Ag/diatomite for highly efficient solar vapor generation under one-sun irradiation. Journal of Materials Chemistry A, 5(34), 17817–17821. DOI 10.1039/C7TA05976K. [Google Scholar] [CrossRef]
14. Guler, U., Shalaev, V. M., Boltasseva, A. (2015). Nanoparticle plasmonics: Going practical with transition metal nitrides. Materials Today, 18(4), 227–237. DOI 10.1016/j.mattod.2014.10.039. [Google Scholar] [CrossRef]
15. Ishii, S., Sugavaneshwar, R. P., Nagao, T. (2016). Titanium nitride nanoparticles as plasmonic solar heat transducers. The Journal of Physical Chemistry C, 120(4), 2343–2348. DOI 10.1021/acs.jpcc.5b09604. [Google Scholar] [CrossRef]
16. Hou, B., Cui, Z., Zhu, X., Liu, X. et al. (2019). Functionalized carbon materials for efficient solar steam and electricity generation. Materials Chemistry and Physics, 222, 159–164. DOI 10.1016/j.matchemphys.2018.10.006. [Google Scholar] [CrossRef]
17. Zhu, M., Li, Y., Chen, G., Jiang, F., Yang, Z. et al. (2017). Tree-inspired design for high-efficiency water extraction. Advanced Materials, 29(44), 1704107. DOI 10.1002/adma.201704107. [Google Scholar] [CrossRef]
18. Xue, G., Liu, K., Chen, Q., Yang, P., Li, J. et al. (2017). Robust and Low-cost flame-treated wood for high-performance solar steam generation. ACS Applied Materials and Interfaces, 9(17), 15052–15057. DOI 10.1021/acsami.7b01992. [Google Scholar] [CrossRef]
19. Li, Z., Wang, C., Lei, T., Ma, H., Su, J. et al. (2019). Arched bamboo charcoal as interfacial solar steam generation integrative device with enhanced water purification capacity. Advanced Sustainable Systems, 3(4), 1800144. DOI 10.1002/adsu.201800144. [Google Scholar] [CrossRef]
20. Dao, V., Choi, H. (2018). Carbon-based sunlight absorbers in solar-driven steam generation devices. Global Challenges, 2(2), 1700094. DOI 10.1002/gch2.201700094. [Google Scholar] [CrossRef]
21. Wang, Z., Yan, Y., Shen, X., Sun, Q., Jin, C. (2020). Candle soot nanoparticle-decorated wood for efficient solar vapor generation. Sustainable Energy & Fuels, 4(1), 354–361. DOI 10.1039/C9SE00617F. [Google Scholar] [CrossRef]
22. Jia, C., Li, Y., Yang, Z., Chen, G., Yao, Y. et al. (2017). Rich mesostructures derived from natural woods for solar steam generation. Joule, 1(3), 588–599. DOI 10.1016/j.joule.2017.09.011. [Google Scholar] [CrossRef]
23. Li, Y., Zhu, H., Zhu, S., Wan, J., Liu, Z. et al. (2015). Hybridizing wood cellulose and graphene oxide toward high-performance fibers. NPG Asia Materials, 7(1), e150. DOI 10.1038/am.2014.111. [Google Scholar] [CrossRef]
24. Li, Y., Gao, T., Yang, Z. (2017). Graphene oxide-based evaporator with one-dimensional water transport enabling high-efficiency solar desalination. Nano Energy, 41, 201–209. DOI 10.1016/j.nanoen.2017.09.034. [Google Scholar] [CrossRef]
25. Zhang, Y., Xia, J., Wang, J. (2011). A review of methods of opening wood cell pathways. Journal of Anhui Agricultural University, 38(6), 867–871. [Google Scholar]
26. Schultz, J. A., Coleman, H. D. (2021). Pectin and xylan biosynthesis in poplar: Implications and opportunities for biofuels production. Frontiers in Plant Science, 12(8), 712083. DOI 10.3389/fpls.2021.712083. [Google Scholar] [CrossRef]
27. Imamura, Y., Harada, H., Saiki, H. (1974). Embedding substances of Pit membranes in softwood tracheids and their degradation by enzymes. Wood Science and Technology, 8(4), 243–254. DOI 10.1007/BF00351858. [Google Scholar] [CrossRef]
28. Francois, W., Berdine, C., Henk, A. (2011). Determination of pectin content of eucalyptus wood. Holzforschung, 65(3), 327–331. DOI 10.1515/HF.2011.054. [Google Scholar] [CrossRef]
29. Zhang, B., Zhou, Y. (2015). Plant cell wall formation and regulation. SCIENTIA SINICA Vitae, 45, 544–556. DOI 10.1360/N052015-00076. [Google Scholar] [CrossRef]
30. Zhang, B., Gao, Y., Zhang, L., Zhou, Y. (2021). The plant cell wall: Biosynthesis, construction, and functions. Journal of Integrative Plant Biology, 63(1), 251–272. DOI 10.1111/jipb.13055. [Google Scholar] [CrossRef]
31. Zhu, M., Xie, J., Fang, K., Cao, X. (2021). Study on the degumming of sisal fibers. Journal of Wuhan Textile University, 34(4), 49–52. [Google Scholar]
32. Wu, N., Du, G., X, L. I. (2015). Effects of pectin enzyme pretreatment on wood fiber separation. Journal of Cellulose Science and Technology, 23(1), 21–28. [Google Scholar]
33. Huang, Z., Yu, B., Zhang, L. (1991). Enzyme treatment for improving wood permeability of preservatives. Journal of Beijing Forestry University, 13(2), 1–7. [Google Scholar]
34. Yu, B. (2003). Advances of fractal analysis of transport properties for porous media. Advances in Mechanics, 33(3), 333–346. [Google Scholar]
35. Luo, B., Zhao, G. (2010). Application of fractal theory on wood science. Journal of Beijing Forestry University, 32(3), 204–208. [Google Scholar]
36. Rajagopal, H., Khairuddin, A. S. M., Mokhtar, N., Ahmad, A., Yusof, R. (2019). Application of image quality assessment module to motion-blurred wood images for wood species identification system. Wood Science and Technology, 53(4), 967–981. DOI 10.1007/s00226-019-01110-2. [Google Scholar] [CrossRef]
37. Sun, H., Masi, D., Najser, J., Nedela, V., Navratilova, E. (2020). Fractal characteristics of pore structure of compacted bentonite studied by ESEM and MIP methods. Acta Geotechnica, 15(6), 1655–1671. DOI 10.1007/s11440-019-00857-z. [Google Scholar] [CrossRef]
38. Jose, A., Paulo, R. (1997). The fractal nature of wood revealed by water absorption. Wood and Fiber Science, 29(4), 333–339. [Google Scholar]
39. Zhao, J., Yang, L., Cai, Y. (2021). Combining mercury intrusion porosimetry and fractal theory to determine the porous characteristics of wood. Wood Science and Technology, 55(1), 109–124. DOI 10.1007/s00226-020-01243-9. [Google Scholar] [CrossRef]
40. He, S., Xu, J., Wu, Z., Bao, Y., Yu, H. et al. (2017). Compare of porous structure of moso bamboo and pinus sylvestris L.lumber. Journal of Nanjing Forestry University (Natural Sciences Edition), 41(2), 157–162. DOI 10.3969/j.issn.1000-2006.2017.02.023. [Google Scholar] [CrossRef]
41. Wang, Y., Gu, Y., Wang, S., Duan, X. (2022). Permeability coefficient investigation based on fractal characteristics of porous media soil. HydroScience and Engineering, (3), 50–58. [Google Scholar]
Cite This Article
 Copyright © 2023 The Author(s). Published by Tech Science Press.
This work is licensed under a Creative Commons Attribution 4.0 International License , which permits unrestricted use, distribution, and reproduction in any medium, provided the original work is properly cited.
 Downloads
 Citation Tools