
 Submit a Paper
 Propose a Special lssue
 Open Access
ARTICLE

Preparation of Peanut Shell Cellulose Double-Network Hydrogel and Its Adsorption Capacity for Methylene Blue
1 Department of College of Environment and Bioengineering, Henan University of Engineering, Zhengzhou, 451191, China
2 School of Mathematics and Statistics, Carleton University, Ontario, K1S 5B6, Canada
* Corresponding Author: Yalin Li. Email:
Journal of Renewable Materials 2023, 11(7), 3001-3023. https://doi.org/10.32604/jrm.2023.026604
Received 15 September 2022; Accepted 23 November 2022; Issue published 05 June 2023
 View Full Text
 Download PDF
Abstract
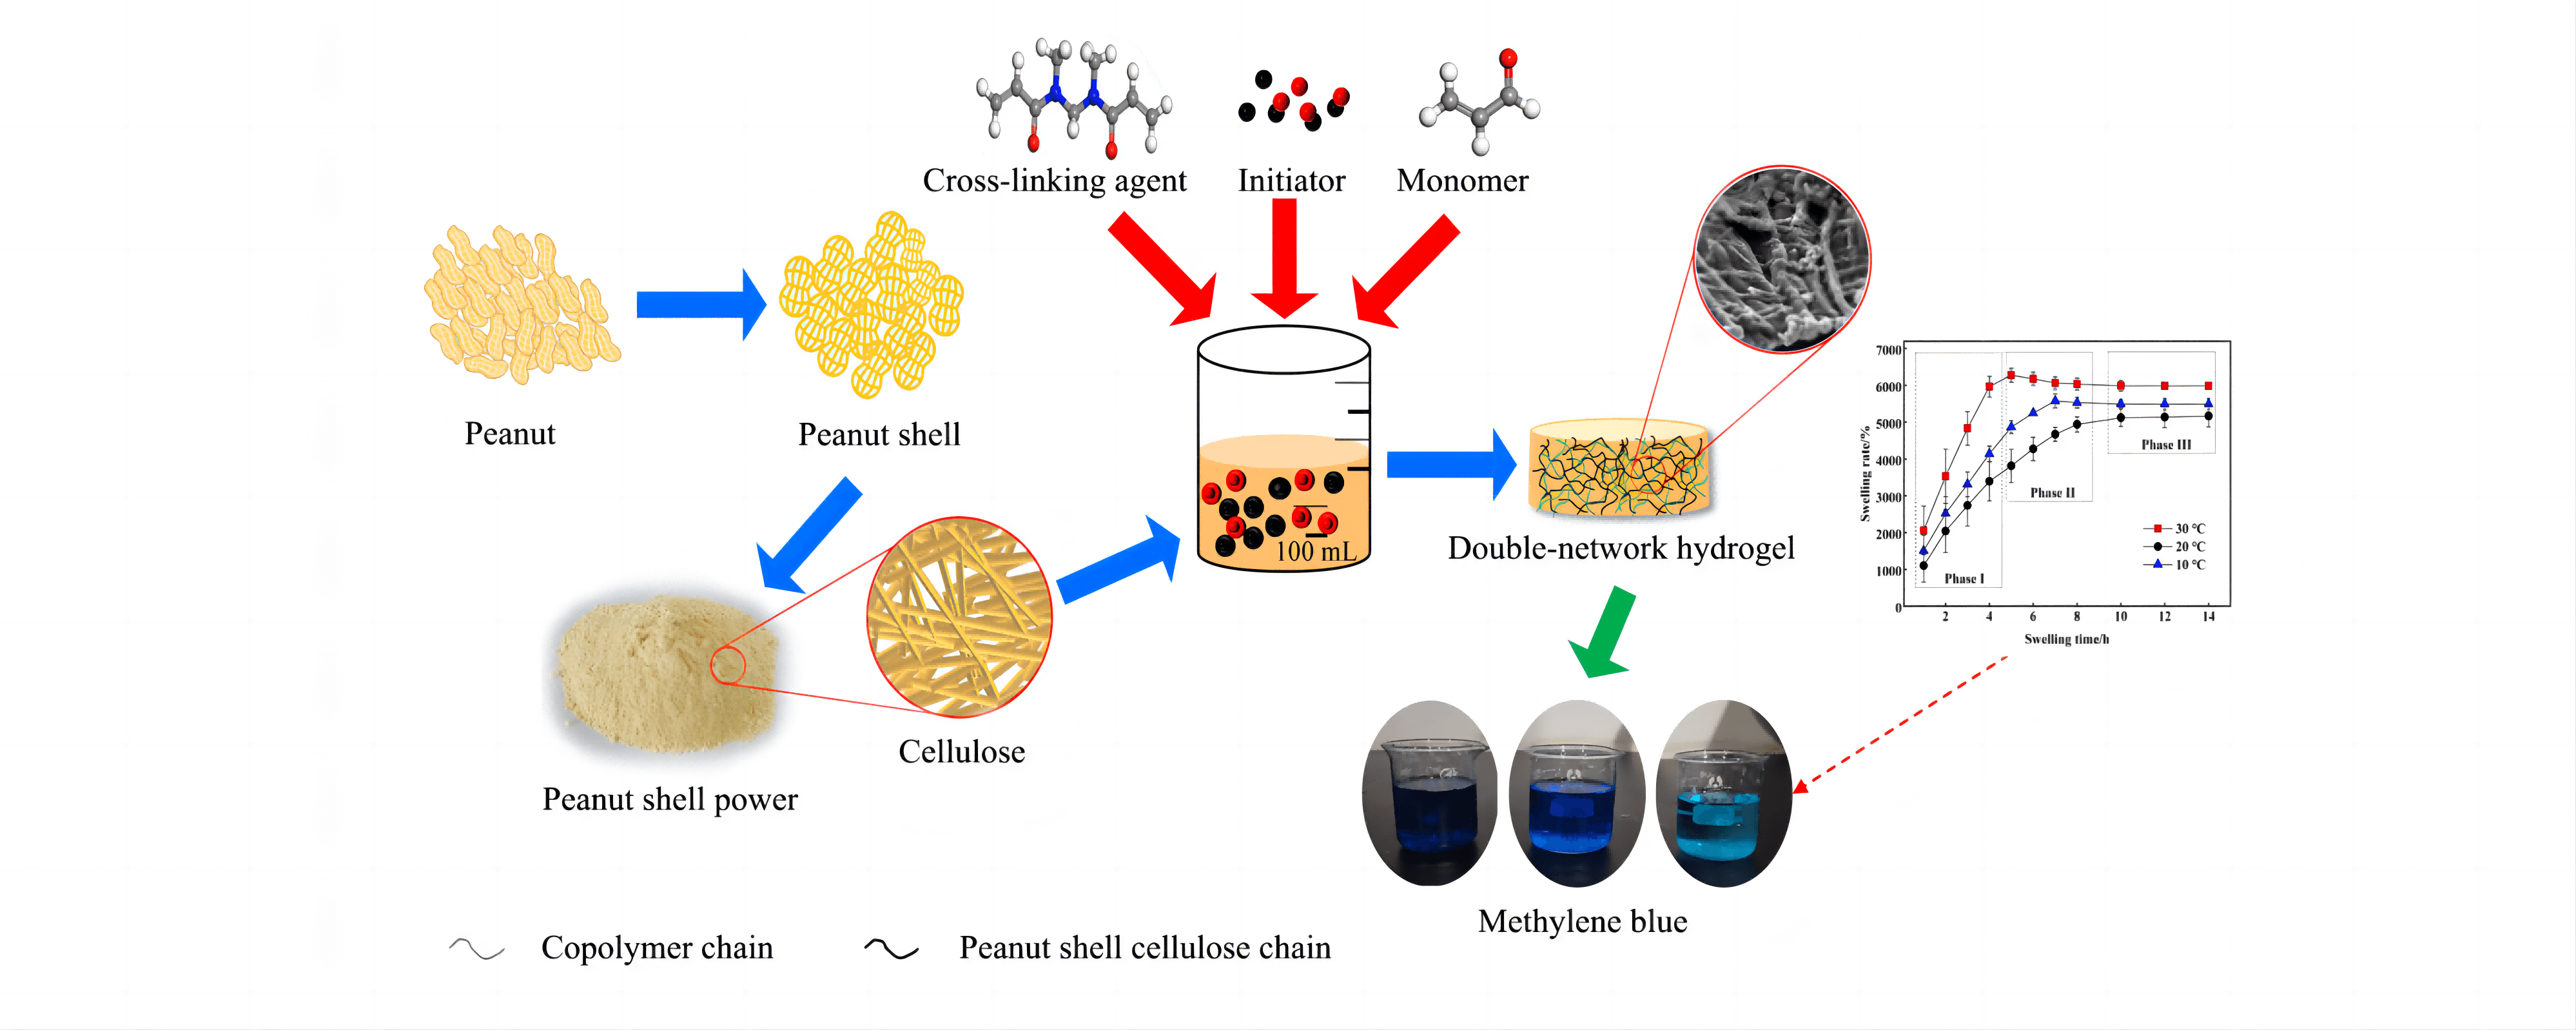
To achieve optimal recovery and value-added utilisation of cellulose in peanut shells, the cellulose in peanut shells was first extracted using the sodium hydroxide-sodium chlorite method. Then, cellulose hydrogel was prepared by graft copolymerisation using N, N’-methylenebisacrylamide as the cross-linking agent, sodium persulfate as the initiator, and acrylic acid as the monomer. Orthogonal optimisation experiments were designed to obtain optimal process parameters for hydrogel preparation with the cellulose dosage of 0.40 g, initiator dosage of 0.20 g, polymerisation temperature of 70°C, cross-linking agent of 0.25 g, and monomer dosage of 3.0 mL. The effect of initiator dosage on hydrogel synthesis was the most significant, followed by monomer dosage and reaction temperature. Characterisation using X-ray diffraction analysis and scanning electron microscopy revealed that the hydrogel was amorphous and exhibited a distinct three-dimensional double network structure. Hydrogel swelling kinetic analysis showed that the hydrogel swelling process was divided into three stages, and fitted the Schott secondary swelling kinetic model. The prepared hydrogel had a good adsorption effect on methylene blue; the adsorption of methylene blue by the hydrogel was 1.259 mg/g at 25°C when the initial concentration of methylene blue was 5 mg/L. The adsorption kinetics of the hydrogel fit the pseudo-first-order kinetic model, pseudo-second-order kinetic model, Eovich model and particle diffusion model. The best fitting effect was obtained with the pseudo-second-order kinetic model. The adsorption isotherm analysis of methylene blue on hydrogel showed that the adsorption process was consistent with Langmuir and Freundlich models. The correlation coefficient of the Freundlich isotherm model was higher, indicating that the adsorption of methylene blue on hydrogel was mainly chemisorption.Graphic Abstract
Keywords
Dyes are one of the most critical pollutants produced by various industries such as textiles, food, printing, rubber, etc. They are complex unsaturated organic compounds whose molecular structure mainly consists of chromophores, autochromes, and matrixes (benzene, perylene, and anthracene rings, respectively) [1]. Most dye structures contain aromatic compounds and the hydrogen on the aromatic group may be substituted to produce more toxic derivatives. These dyes are usually divided into three main categories, cationic, non-ionic and anionic, wherein the cationic dyes are more toxic than other dyes [2]. Most of these dyes are stable, and their effective elimination from wastewater using conventional methods has become a major challenge. In addition, due to the presence of aromatic compounds, dye wastewater is dangerous and poisonous for organisms [3]. Nitrogen and phosphorus containing reagents (e.g., urea) are often used in various processes of printing and dye manufacturing. These nitrogen and phosphorus containing wastewaters are colored and their direct discharge into natural water bodies can prevent sunlight from diffusing into the water. This leads to a significant reduction in dissolved oxygen in the water and causes eutrophication of the water bodies [4,5]. At the same time, the random discharge of dye wastewater can also severely affect human health and the environment [6]. According to statistics, 12% of the annual production of cationic dyes (7 × 10⁵–1 × 10⁶ t) enters the environment through industrial wastewater, which in humans can cause skin irritation, genetic changes, digestion problem, cancer, lethargy, dysfunction of the liver, kidney, brain, nervous and reproductive systems, increased heart rate, nausea, vomiting, diarrhea and mental confusion [7]. Therefore, the removal of dye contaminants from aqueous solutions and the environment is essential to enhance environmental protection and the health of living organisms.
The main methods to remove dyes and other pollutants from wastewater include adsorption, photocatalysis, and electrochemical and chemical oxidation methods [8]. Among them, the adsorption method has the advantages of good performance, low cost, flexible operation and simple operation. In recent years, the use of polymeric adsorbents (e.g., starch, montmorillonite, bone char, activated carbon) for the removal of various pollutants has attracted widespread attention.
Starch is the most abundant natural polymer, which is environmentally friendly. When the adsorbent produced by starch is used in wastewater treatment, various functional groups are introduced into the adsorbent in order to improve the performance of removing target pollutants. Montmorillonite is another highly efficient adsorbent with abundant reserves, low cost, large specific surface area and strong oxygen ion exchange ability. Due to the negative charge on the structure of montmorillonite, it can be used as an efficient adsorbent to remove dyes [3]. Bone char produced by pyrolysis of animal bones in an inert atmosphere consists of 80%–90% of calcium phosphate (in hydroxyapatite form, HAP) and 10% carbon with a high surface area, which can be used as an adsorbent to adsorb dyes [9]. Activated carbon can effectively treat pollutants in wastewater (especially biodegradable pollutants such as heavy metals, dyes, etc.), but its price is high, and it is not selective for disperse dyes and reductive dyes.
In view of this, many researchers have proposed unconventional low-cost adsorbents, including natural materials, bio-sorbents, and industrial and agricultural wastes. These adsorbent materials can be used to remove dyes in solution [10], such as tasteless fruit bark made of activated carbon, used for the adsorption of methylene blue dye. This is a simple adsorption method, which can facilitate the adsorption of a variety of dyes [11].
Hydrogel is also a typical adsorption material. It is a kind of polymer functional material, which is widely used in the food industry, medical and health care, petrochemical industry, agriculture, forestry, horticulture and environmental protection. Its applications are due to its unique three-dimensional mesh cross-linked structure and good biodegradability, as well as its swelling and water retention properties that make it hydrophilic but insoluble in water [12]. Up to now, several hydrogels have been prepared by cross-linking two different polymers in different ways, which have great application value in adsorbing dyes. Other hydrogels have been prepared by chemical crosslinking of sucrose, short fiber and poly (vinyl alcohol) hydrogel. Core-shell structure is used in a variety of dye adsorption materials. Studies have shown that compared to raw hydrogel, all performance aspects of composite hydrogel were improved [13]. In another study, cellulose (CNWs) was introduced into chitosan hydrogel with the polyacrylic acid double network, in order to enhance the adsorption capacity of methylene blue. Compared with the original hydrogel, when the CNWs content was 0–20 w/%, the prepared hydrogel adsorbents all showed excellent adsorption performance for methylene blue (MB) [14]. Zhao et al. [15] prepared modified cellulose hydrogels by mixing and cross-linking acrylamide and acrylic acid. It was found that the cellulose dual-network hydrogel could be used as an adsorbent for heavy metal removal in addition to dye removal [15]. However, due to the presence of a large number of water molecules, the three-dimensional mesh structure of hydrogels is loose and most heterogeneous, resulting in poor mechanical properties. As a result, hydrogels can be easily broken under the action of prolonged swelling or external force, limiting their applications.
Cellulose is the most abundant natural polymer in nature, and is the most commonly used hydrogel precursor material [16] with non-toxicity and good biocompatibility for a wide range of applications. It is a typical D-glucopyranose cyclic linear polymer, which is bridged by β-(l, 4) glycosidic bonds, and the glucose ring in the chain molecule is rich in -OH groups. The hydrogel prepared from cellulose can effectively improve the swelling and water retention of the prepared hydrogel via modification of its functional groups. Additionally, due to its good ductility, cellulose can be employed as a layer in double-network hydrogels to improve the rigidity of the hydrogels [17].
Peanut shells (PS) have a huge output worldwide and occupy an important position in agricultural waste [18]. Nearly half of the PS output in the world is produced by China, more than 15,000,000 tons, of which less than 80% is effectively utilised [19]. Nearly all PS waste is burnt directly, except for a small quantity that is ground into powder and used as feed for livestock and poultry, compost and base materials for edible mushrooms. This does not meet the requirements of China’s “14th Five-Year Plan” for green life and resource-oriented utilisation. Extraction of cellulose from PS for the preparation of hydrogels is very economical and enhances the value-added use of PS on the premise of resource-oriented utilisation, with positive ecological benefits. Compared with other adsorbents, the cellulose content extracted from PS is high, and the prepared dual-network hydrogel is non-toxic, low cost, abundant in reserves, biodegradable, and has good adsorption performance.
In this study, peanut shell cellulose (PSC) was extracted from PS via the NaOH-NaClO2 method, and cellulose was dissolved via NaOH-CO(NH2)2 solvent system. N, N’-methylenebisacrylamide (MBA) was introduced as the cross-linking agent, sodium persulfate (SPS) as the initiator, and acrylic acid (AA) as the monomer for the preparation of a double-network hydrogel (PSC-Hydrogel) by graft copolymerisation. The effects of cross-linking agent dosage, polymerisation temperature, initiator dosage and monomer dosage on the preparation of PSC-Hydrogel were investigated by single factor and orthogonal experiments with swelling rate as the response value, and the optimum preparation conditions were determined. The prepared PSC-Hydrogel was characterised by Fourier transform infrared spectroscopy (FT-IR), X-ray diffractometry (XRD), thermogravimetric analysis (TGA) and scanning electron microscopy (SEM). Additionally, the swelling kinetics of PSC-Hydrogel and adsorption properties for methylene blue dye were analysed in order to provide a theoretical reference for the value-added utilisation of PS.
The raw material of PS was purchased from Lianyungang (Jiangsu, China). After rinsing, dehydration and grinding, it was passed through a 120-mesh nylon sieve. Then, it was subjected to the NaOH-NaClO2 method [20] to obtain PSC, which was further processed by the NaOH-CO(NH2)2 method to obtain a homogenous and transparent cellulose solution with a cellulose content of 41.39%. Acrylic acid (AA, 79-10-7, 72.06(MW), >99%(GC)), sodium persulfate (SPS, 7775-27-1, 238.1(MW), AR), N, N’-methylenebisacrylamide (MBA, 110-26-9, 154.17(MW), AR), sodium hydroxide (NaOH, 1310-73-2, 40(MW), 96%), urea (CO(NH)2)2, 57-13-6, 60.06(MW), 99%), and sodium chlorite (NaClO2, 7758-19-2, 90.44(MW), 80%) were purchased from Macklin Biochemical Technology Co., Ltd. (Shanghai, China). Methylene blue (MB, 7220-79-3, 373.90(MW), AR) was analytically pure, and purchased from Enokai Technology Co., Ltd. (Beijing, China).
The reaction mixture was placed in a constant temperature water bath and magnetically stirred (HSJ, Jiangsu Branch Vein Instrument Manufacturing Co., Ltd., Taizhou, China). The prepared hydrogels were completely dried in a vacuum freeze dryer (LGJ-10, Beijing Yuecheng Jiaye Technology Co., Ltd., Beijing, China). Swelling experiments were carried out in an artificial climate box (BIC-300, The medical equipment factory of Shanghai Bosun Industrial Co., Ltd., Shanghai, China). Determination of methylene blue concentration was achieved using an ultraviolet spectrophotometer (UV-6300, Shanghai Meproda Instrument Co., Ltd., Shanghai, China).
2.3.1 Preparation of Cellulose Hydrogels
The hydrogel preparation process is shown in Fig. 1A. Briefly, 5.0 g of pre-treated PS powder was accurately weighed and placed in a 250 mL beaker with 150 mL of 1 M NaOH solution, which was heated in a constant temperature water bath at 75°C for 2 h. The solution was filtered through a Buchner funnel, and washed with distilled water until the pH was neutral. The solid phase was removed using a funnel and 50 mL of a mixed solution containing CH3COOH (31 mL/L) and NaClO2 (15 g/L) was added, where the volume ratio of CH3COOH to NaClO2 was 1:1. Then, the mixed solution with solid phase was placed in a constant temperature water bath at 75°C for 1 h to remove lignin from PS. The mixed solution was filtered using a Buchner funnel, and the filtered solid phase was washed with distilled water until the pH was neutral. The treated PS powder was dried in an electric thermostatic drying oven at 60°C to obtain PSC. The content of cellulose was 41.39%.
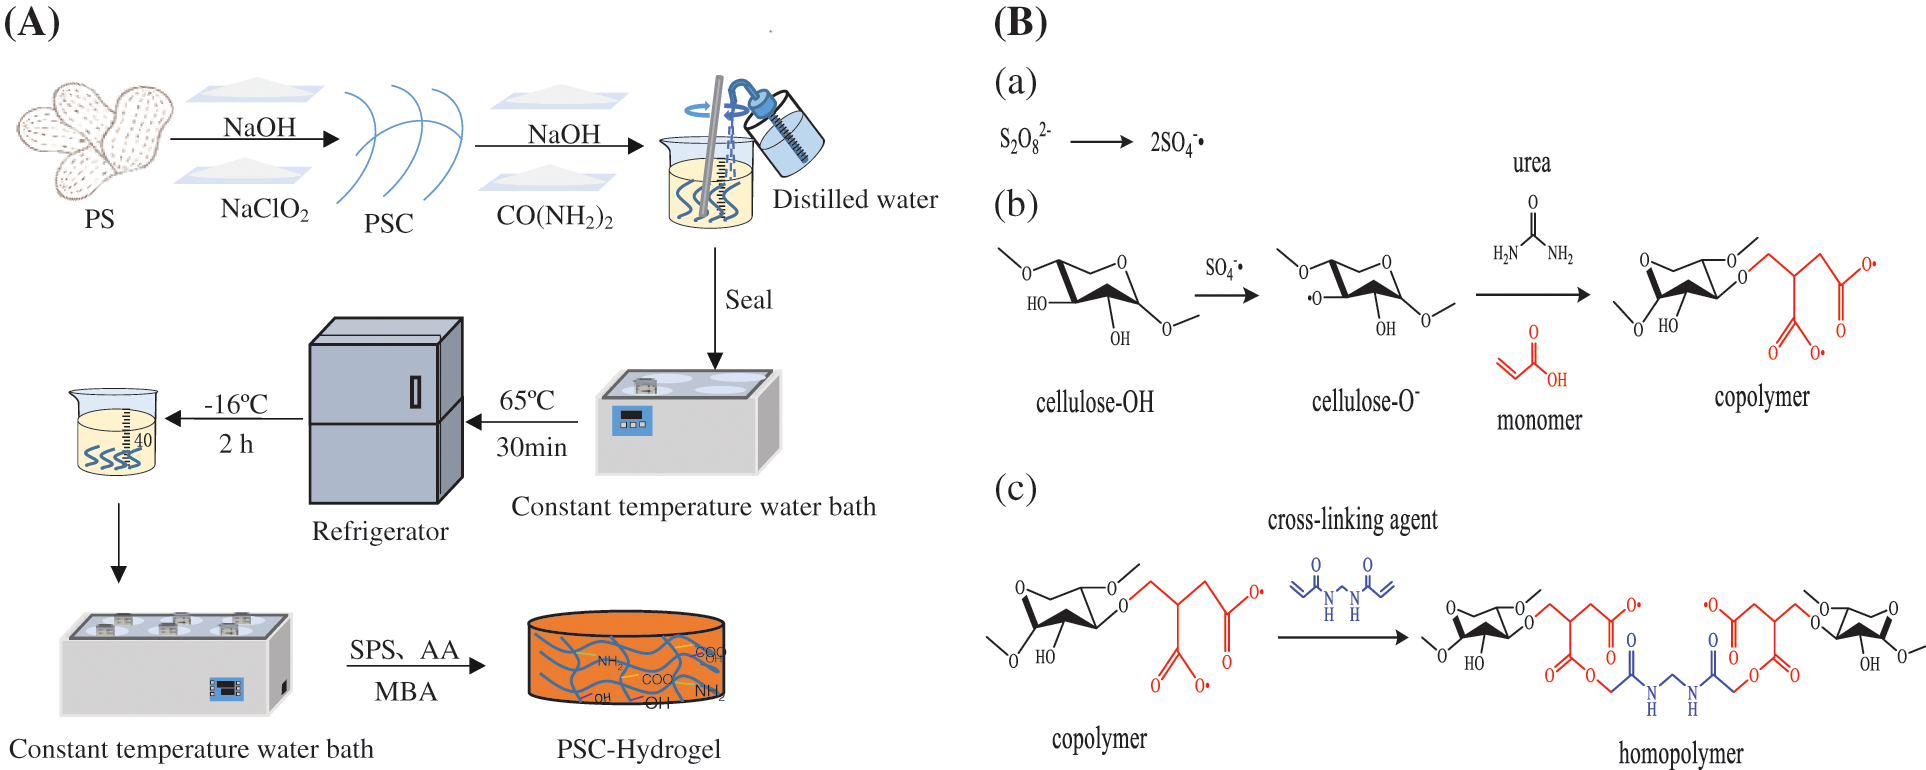
Figure 1: The (A) preparation process and (B) synthesis scheme of double network hydrogels
Next, 1.0 g of PSC powder was weighed into a beaker, and 7.0 g of NaOH, 12.0 g of CO(NH2)2 and 81 mL of deionised water were added. The mixture was stirred evenly, covered with cling film, and placed in a constant temperature water bath at 65°C for 30 min to fully dissolve the cellulose in PS. Then, it was removed and placed in the refrigerator quickly and cooled to −16°C for 2 h to obtain PSC solution.
To prepare the PSC-hydrogel, 40 mL of PSC fibre solution was measured in a beaker, which was then placed in a constant temperature (55°C, 60°C, 65°C, 70°C, 75°C, 80°C) water bath, stirred for 5 min, and then AA was added. SPS and MBA were added under continuous stirring until the solution appeared viscous. The formed hydrogel product was PSC-Hydrogel, which was freeze-dried to a constant weight to obtain a dried gel sample.
The synthesis of PSC-Hydrogel is shown in Fig. 1B. The basic principles of hydrogel synthesis using graft cross-linking and polymerisation cross-linking were cellulose extraction using NaOH-NaClO2 method, and solubilisation of cellulose by NaOH-CO(NH2)2 solvent system. Here, SPS was employed as an initiator, which underwent thermal decomposition under certain temperature conditions, generating free radicals to extract hydrogen atoms from -OH of the cellulose backbone, which in turn formed active-OR. AA as a monomer by reactive radicals. A graft copolymer was formed by open C=C grafting on the cellulose backbone that generated the first layer of rigid network structure. MBA was used as the cross-linking agent to promote cross-linking of the branched chains to form a second layer of flexible mesh structure of the hydrogel. A double network hydrogel was produced by multiple components polymerisation and two-layer network interpenetration.
2.3.2 Single-Factor Experimental Design
In this study, a single-factor four-level experimental design was used. PSC extract volume was fixed at 40 mL, and the effects of the amount of MBA (0.20, 0.25, 0.30, 0.35, 0.40 g), polymerisation temperature (55°C, 60°C, 65°C, 70°C, 75°C, 80°C), amount of SPS (0.05, 0.10, 0.15, 0.20, 0.25 g), and amount of AA (1.5, 2.0, 2.5, 3.0, 3.5, 4.0 g) on the swelling rate of hydrogels were explored, respectively.
2.3.3 Orthogonal Experimental Design
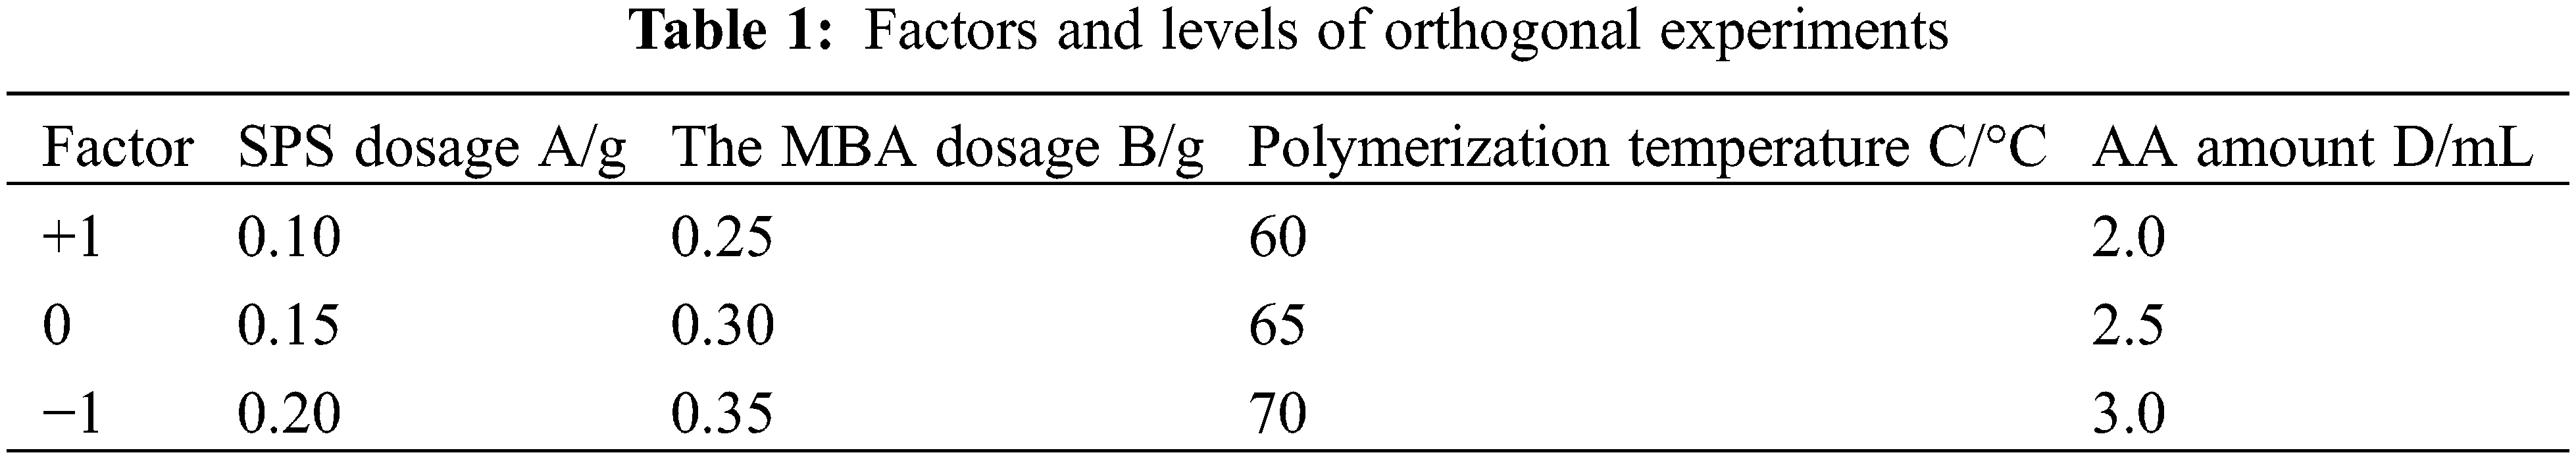
Based on the analysis of single-factor experiments, an orthogonal experimental design was carried out using Minitab statistical software. SPS dosage (A), MBA dosage (B), polymerisation temperature (C) and AA dosage (D), were used as the investigating factors. L9 (34) orthogonal experiments were designed to determine the optimal parameters with hydrogel swelling rate as the response value. The experimental factors and levels are shown in Table 1.
2.3.4 Determination of Swelling Rate of Hydrogels
In a typical procedure, 0.2–0.5 g of dried hydrogel was weighed in a 250 mL beaker, and 200 mL of deionised water was added. The hydrogel was allowed to swell in an artificial climate chamber at constant temperature (25°C) and humidity (55%). It was removed every 12 h, placed on a 100-mesh nylon sieve to drain, and the residual water from the surface was gently absorbed with absorbent paper. Then, it was immediately weighed and returned to the chamber. The above process was repeated until the hydrogel mass was constant, and the final swelling rate of the hydrogel was used as the equilibrium swelling rate, which was calculated by Eq. (1).
where Sr(%) is the swelling rate of PSC-Hydrogel, Ws (g) is the mass of PSC-Hydrogel when swelling equilibrium was reached, and W0 (g) is the mass of PSC-Hydrogel before swelling.
2.3.5 Determination of Dye Adsorption Capacity by Hydrogels
Briefly, 0.2 g of freeze-dried PSC-Hydrogel was accurately weighed in a 100 mL beaker, and 80 mL of 5 mg/L methylene blue (MB) solution was added. Then, adsorption was carried out in an artificial climate chamber at constant humidity (55%) and various temperatures (15°C, 25°C, 35°C). The adsorption of PSC-Hydrogel was measured and calculated at certain time intervals. The Hydrogel adsorption capacity of MB was calculated by Eq. (2).
where Qt (mg/g) is the adsorption capacity of PSC-Hydrogel for MB, c0(mg/L) is the initial concentration of MB, ct(mg/L) is the concentration of MB at a specific time, m(g) is the mass of dried PSC-Hydrogel, and V(L) is the volume of MB solution.
2.3.6 Fourier Transform Infrared Spectrometer (FT-IR) Characterisation
The PS and freeze-dried PSC-Hydrogel were ground into a powder using a mortar and sieved through 120 mesh sieves. Their functional groups were characterised using Fourier transform infrared spectrometer (Nicolet 6700, Thermo Fisher, USA) with a scanning range of 500–4000 cm−1.
2.3.7 Thermogravimetric Analysis (TGA) Characterisation
The thermal analysis of samples was performed using a synchronous thermal analyser (STA449 F3, Netzsch Inc., Bavaria, Germany) with a ramp-up rate of 30 °C/min and a ramp-down range of room temperature to 800°C.
2.3.8 X-Ray Diffraction (XRD) Characterisation
The freeze-dried samples were ground into a powder using a mortar and passed through a 300-mesh sieve. Their surface chemical composition was characterised using an X-ray diffractometer (D8 ADVANCE, Bruker Corporation, Milton, ON, Canada) with Cu Kα rays at a current of 30 mA, voltage of 35 kV, and scanning range of 2θ = 20°–80°.
2.3.9 Scanning Electron Microscope (SEM) Characterisation
A small amount of freeze-dried sample was placed on a copper plate with the cross-section facing upwards, fixed with conductive adhesive, sprayed with gold, and then observed under a scanning electron microscope (Quanta 250, FEI, Ltd., Brno, Czech Republic) for the apparent morphology of the samples.
2.3.10 Brunauer-Emmett-Teller (BET) Surface Area Characterisation
The BET surface area was determined from the N2 adsorption-desorption isotherm at 77.3 K. The surface area and pore volume data were collected using a surface area and porosity analyser (ASIQM 0010-14, Quantachrome Corp., Florida, USA). The samples were degassed for 12 h at 100°C prior to the adsorption process. In order to analyse the porous structure of the synthesized samples, the BJH method was employed.
3.1 Single-Factor Experimental Results
3.1.1 Influence of Cross-Linking Dosage on Swelling Property of the Prepared Hydrogels
The hydrogel samples were prepared by using 40 mL of PSC solution, with the amount of AA set to 2.0 mL, the amount of SPS set to 0.40 g, and the polymerization temperature set to 65°C. The amount of MBA was varied. Afterwards, the hydrogel samples were dried to a constant weight and the swelling rate was measured. Three groups were measured in parallel for each sample. The effect of MBA content on hydrogel swelling rate is shown in Fig. 2A. The cross-linking agent was mainly used to cross-link cellulose with AA during the hydrogel preparation process, which is a known factor that affects the formation of the hydrogel mesh structure. At 0.10 g dosage of MBA or 0.15 g of MBA, the network structure of the polymer was not fully formed due to insufficient dosage, and the products existed in water-soluble form. The results showed that the hydrogel state products were formed at 0.20 g of MBA. The cross-linking reaction prompted the initial construction of the three-dimensional mesh structure of the hydrogel.
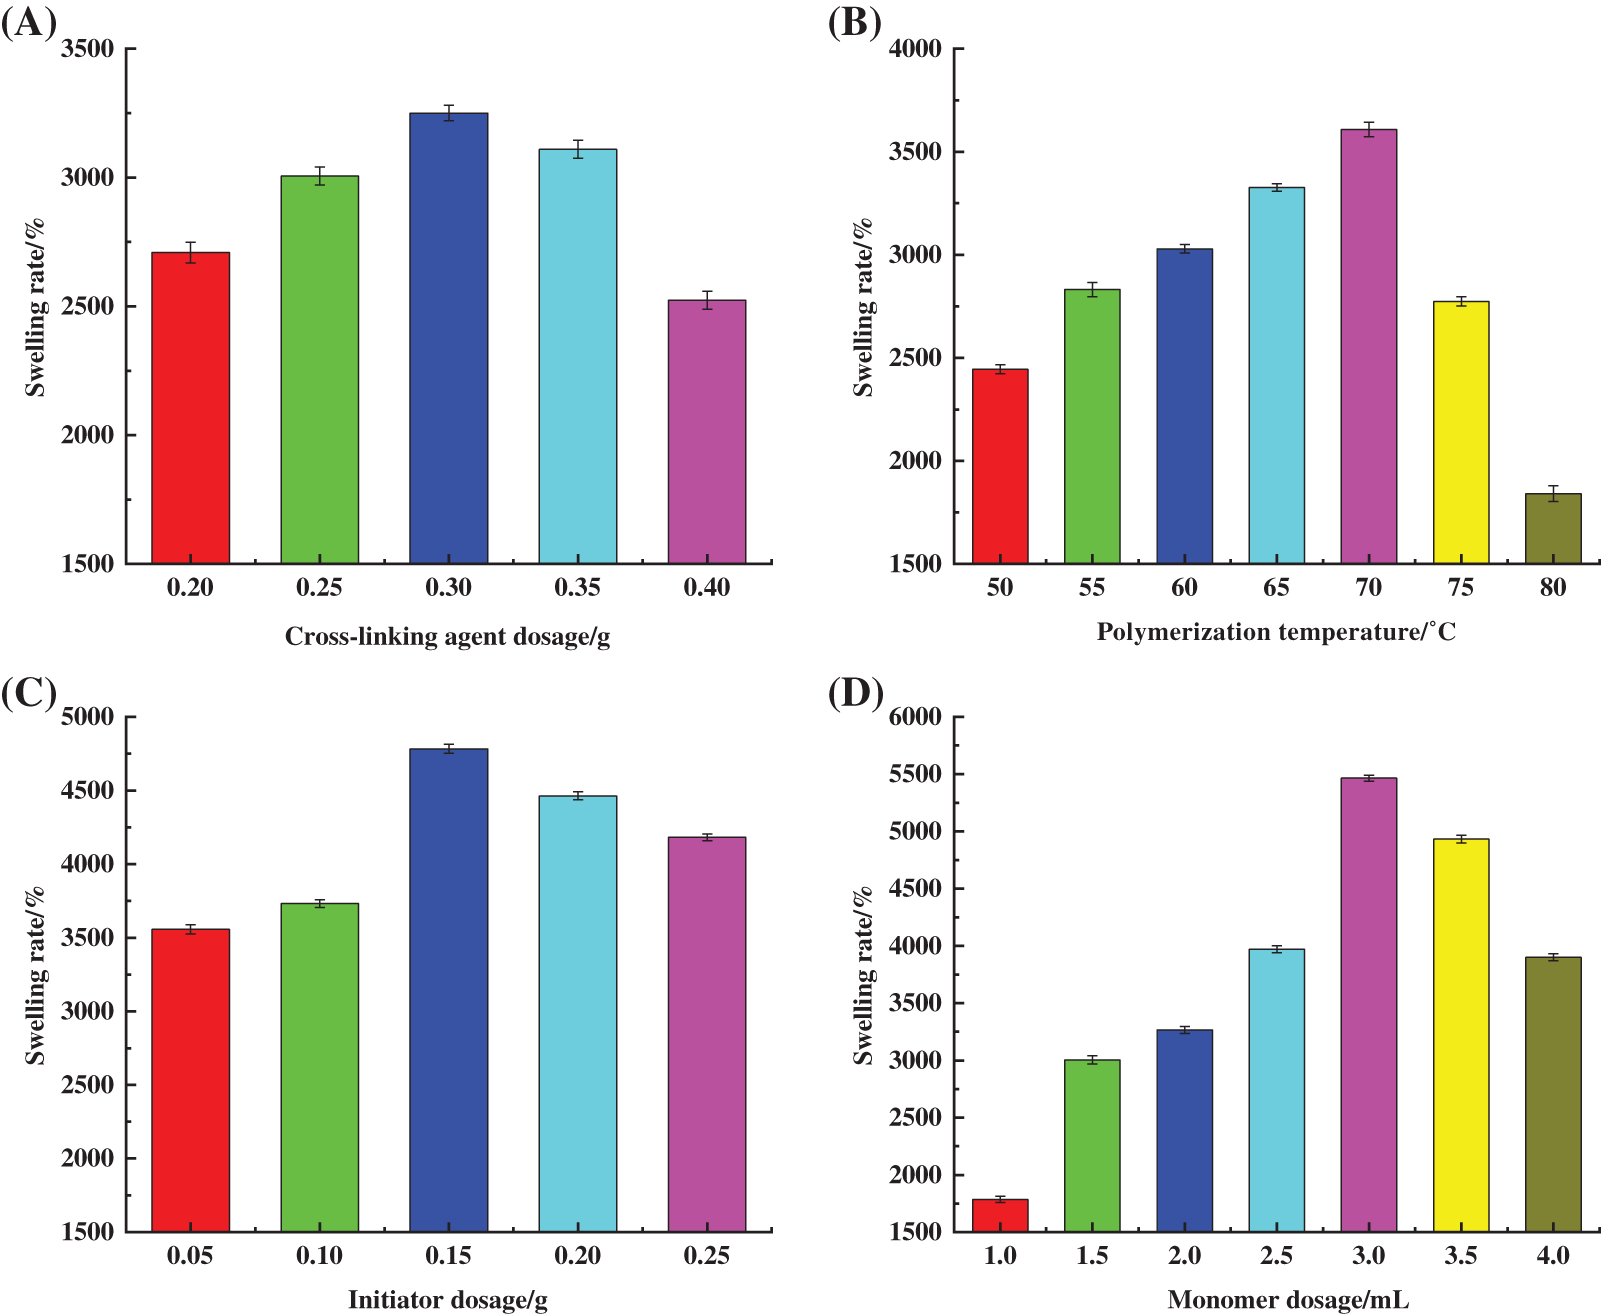
Figure 2: Effect of (A) cross-linking agent dosage, (B) polymerization temperature, (C) initiator dosage, (D) monomer dosage on swelling property of hydrogels
As shown in Fig. 2A, Sr grew faster with the increase in MBA dosage and reached a maximum of 3250.24% at 0.30 g MBA dosage. According to Flory network theory [21], the dosage of cross-linking agent is a key factor influencing the cross-linking density and fluid absorption rate of hydrogels. In this study, the increase in MBA dosage improved the cross-linking density and increased the network nodes in the reaction. The observed effects were conducive to maintaining the water-holding properties of hydrogels. As MBA dosage increased, the integrity of the network structure in the hydrogel gradually improved, as well as its swelling properties. Above 0.03 g MBA dosage, Sr decreased due to excess MBA present that promoted an overly cross-linked hydrogel network, increased nodes in the polymerisation network, and reduced cross-linked spacing and free spaces [22]. Furthermore, the rigidity of the hydrogel was enhanced, limiting the extension degree of the cellulose chain during the swelling process, while AA in the system underwent self-polymerisation to form short-chain linear polymers, resulting in the reduced water-holding capacity of the hydrogel.
3.1.2 Influence of Polymerisation Temperature on Swelling Property of the Prepared Hydrogels
The hydrogel samples were prepared by using 40 mL of PSC solution, with the amount of monomer AA set to 2.0 mL, the amount of initiator SPS set to 0.40 g and the amount of MBA set to 0.30 g. The polymerization temperature was varied. Afterwards, the hydrogel samples were dried to a constant weight and the swelling rate was measured. Three groups were measured in parallel for each sample. The effect of polymerisation temperature on the swelling properties of the prepared hydrogel is shown in Fig. 2B. Temperature influences the graft copolymerisation reaction [23], as well as the degree of movement of active molecules in the reaction, rate of thermal decomposition of initiator, and degree and rate of cross-linking polymerisation. As shown in Fig. 2B, in the range of 50°C–80°C, Sr showed an increasing trend that decreased at the higher temperature. At a polymerisation temperature of 70°C, Sr was 3608.6%.
The decomposition rate of SPS was low when the temperature was lower than 40°C with a slow rate of polymerisation reaction, low degree of polymer cross-linking, and poor water absorption due to “defects” in network structure formation. In contrast, the decomposition rate of SPS accelerated with the increase in temperature due to the enhanced thermal motion of reactant molecules and the possibility of free radical collision. This promoted the formation of the hydrogel’s internal network structure and the gradual improvement of swelling performance. However, at high temperatures, the decomposition of the initiator and degree of polymerisation between the components increased in the system, which resulted in a violent reaction. This hindered the formation of a uniform and effective network structure, and reduced the hydrogel’s swelling properties.
3.1.3 Influence of Initiator Dosage on Swelling Property of the Prepared Hydrogels
The hydrogel samples were prepared by using 40 mL of PSC solution, with the amount of monomer AA set to 2.0 mL, the amount of MBA set to 0.30 g, and the reaction temperature set to 70°C. The amount of initiator SPS was varied. Afterwards, the hydrogel samples were dried to a constant weight and the swelling rate was measured. Three groups were measured in parallel for each sample. The effect of the initiator dosage on the swelling performance of the hydrogel is shown in Fig. 2C. The results showed that Sr increased significantly with an increase in SPS dosage and reached a maximum value of 4783.2% at an SPS dosage of 0.15 g. Additionally, as an active central substance that generates radicals for the polymerisation reaction, SPS affected the rate of the polymerisation reaction, which determined the relative molecular mass of PSC-Hydrogel. SPS can undergo thermal decomposition at a certain temperature as shown in Eqs. (3) and (4) [24].
SO4−⋅ produced during decomposition initiated the graft polymerisation of cellulose. The mechanism is shown in Eqs. (5)–(7).
When the SPS dosage was less than 0.15 g, fewer active sites were triggered with a low degree of cross-linking, resulting in the poor formation of a three-dimensional reticular spatial structure inside the hydrogel and a lower value of Sr [25]. Furthermore, as SPS increased, both the number of active sites and active radicals on cellulose chains increased. Thus, the collision probability between radicals and monomers showed a significant increase, and the graft polymerisation reaction between cellulose chains and monomers was sufficient [26]. This led to the formation of a relatively complete spatial network structure with a consequent increase in Sr. When SPS dosage exceeded 0.15 g, heat-activated SPS generated a large amount of SO4−⋅ to promote the reactive centre sites, and elevate the rates of co-polymerisation and self-polymerisation reactions. This led to uneven polymerisation and the formation of irregular network structures. At the same time, the excessive amount of SO4−⋅ reacted with S2O82− in a burst reaction [27], resulting in a significant reduction in Sr. Excess amount of SPS increased chain termination reactions, reducing the relative molecular weight of the hydrogel polymer, and hindering the ability of cellulose to form the hydrogel.
3.1.4 Influence of Monomer Dosage on Swelling Property of the Prepared Hydrogels
The hydrogel samples were prepared by using 40 mL of PSC solution, with the amount of SPS set to 0.15 g, the amount of MBA set to 0.30 g, and the reaction temperature set to 70°C. The amount of AA was varied. Afterwards, the hydrogel samples were dried to a constant weight and the swelling rate was measured. Three groups were measured in parallel for each sample. The effect of monomer AA dosage on the swelling property of the prepared hydrogel is shown in Fig. 2D, where Sr gradually increased with an increase in AA dosage, and a maximum of 5464.7% was reached at the dosage of 3.0 mL. This was due to AA molecules undergoing self-polymerisation or graft copolymerisation with cellulose under the action of SPS and MBA. Moreover, the AA molecules contained a large amount of hydrophilic -COOH groups making the hydrogel absorb a significant amount of water without dissolution [28].
Sr decreased when the AA dosage was greater than 3.0 mL. This was because the higher AA dosage resulted in a continuous rise in the number of -COOH and -COO-Na+ groups in the hydrogel. The presence of -COOH and -COO-Na+ groups created a large number of intermolecular and intramolecular hydrogen bonds inside the formed three-dimensional network. This resulted in an excessively dense cross-linking network, which inhibited the water-absorbing and swelling behaviour of the hydrogel [29]. Additionally, the continuous increase in the number of -COOH and -COO-Na+ groups also led to an increase in the soluble fraction of the hydrogel, which was detrimental to the swelling of the hydrogel.
3.2 Orthogonal Experimental Results
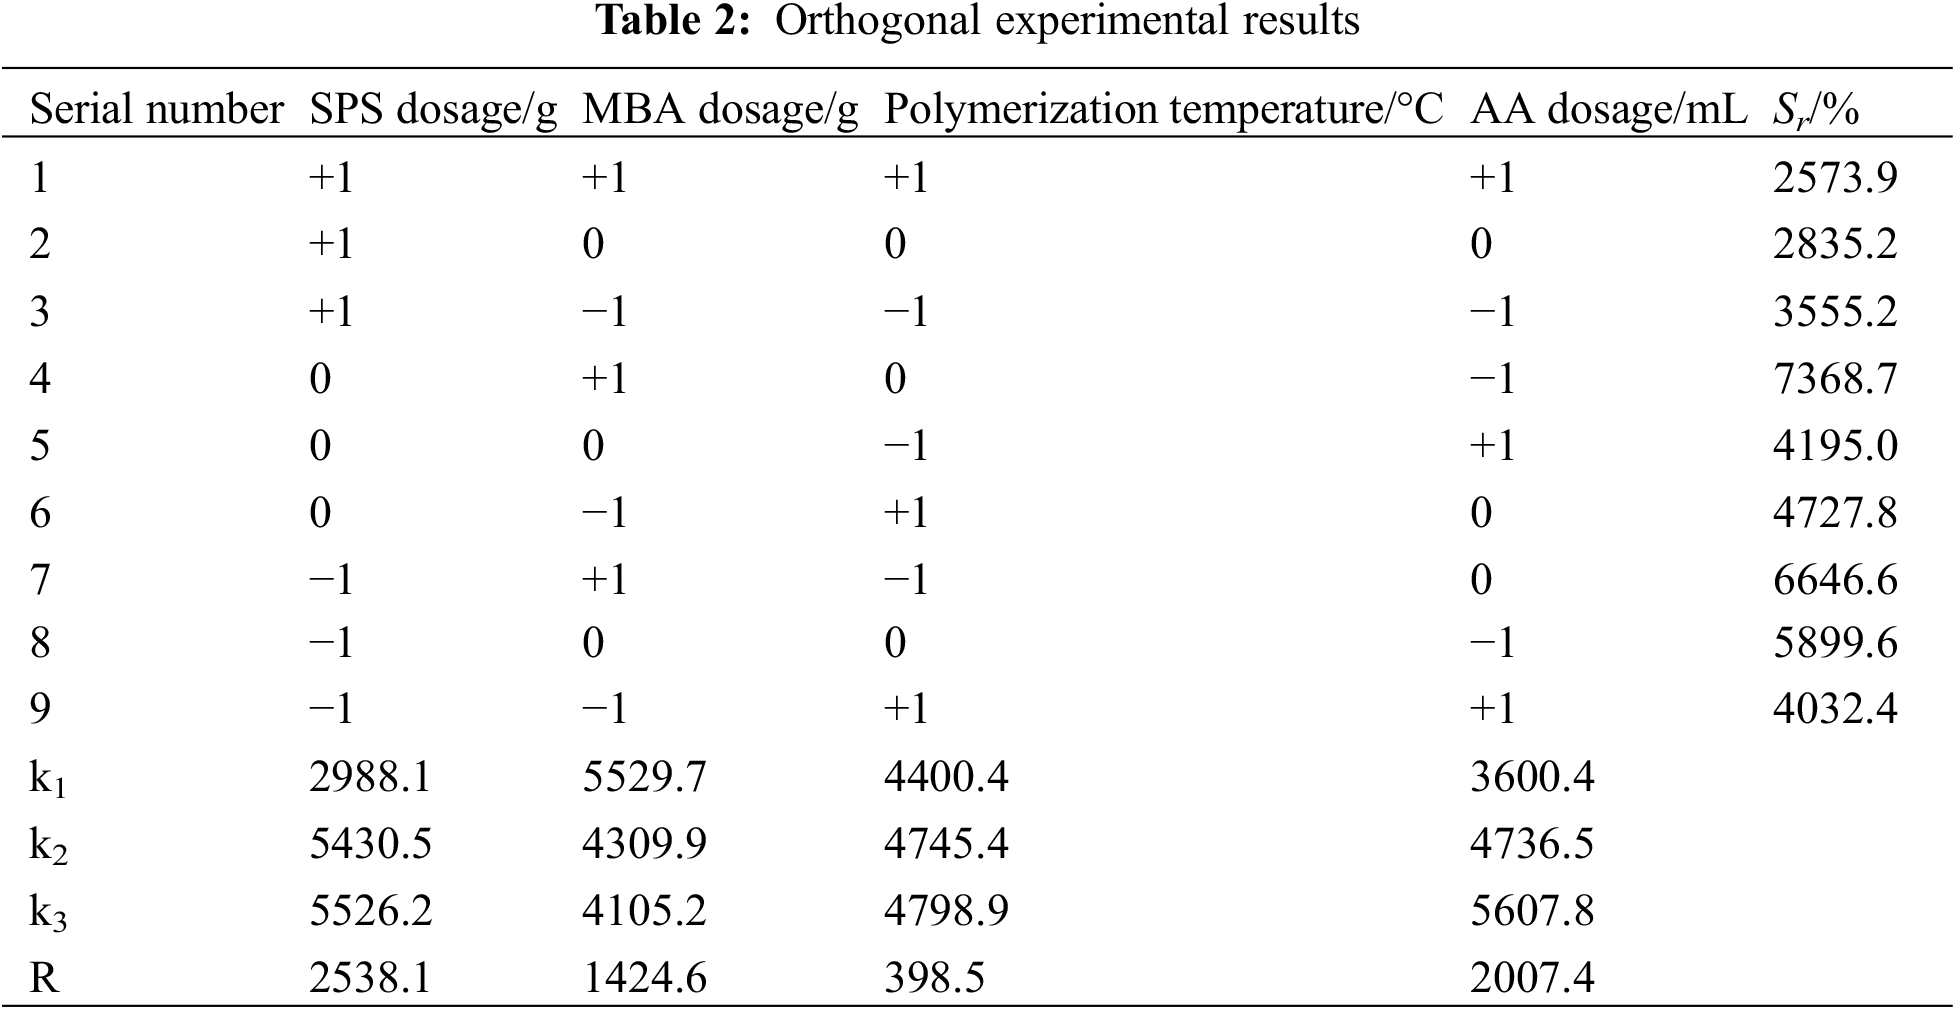
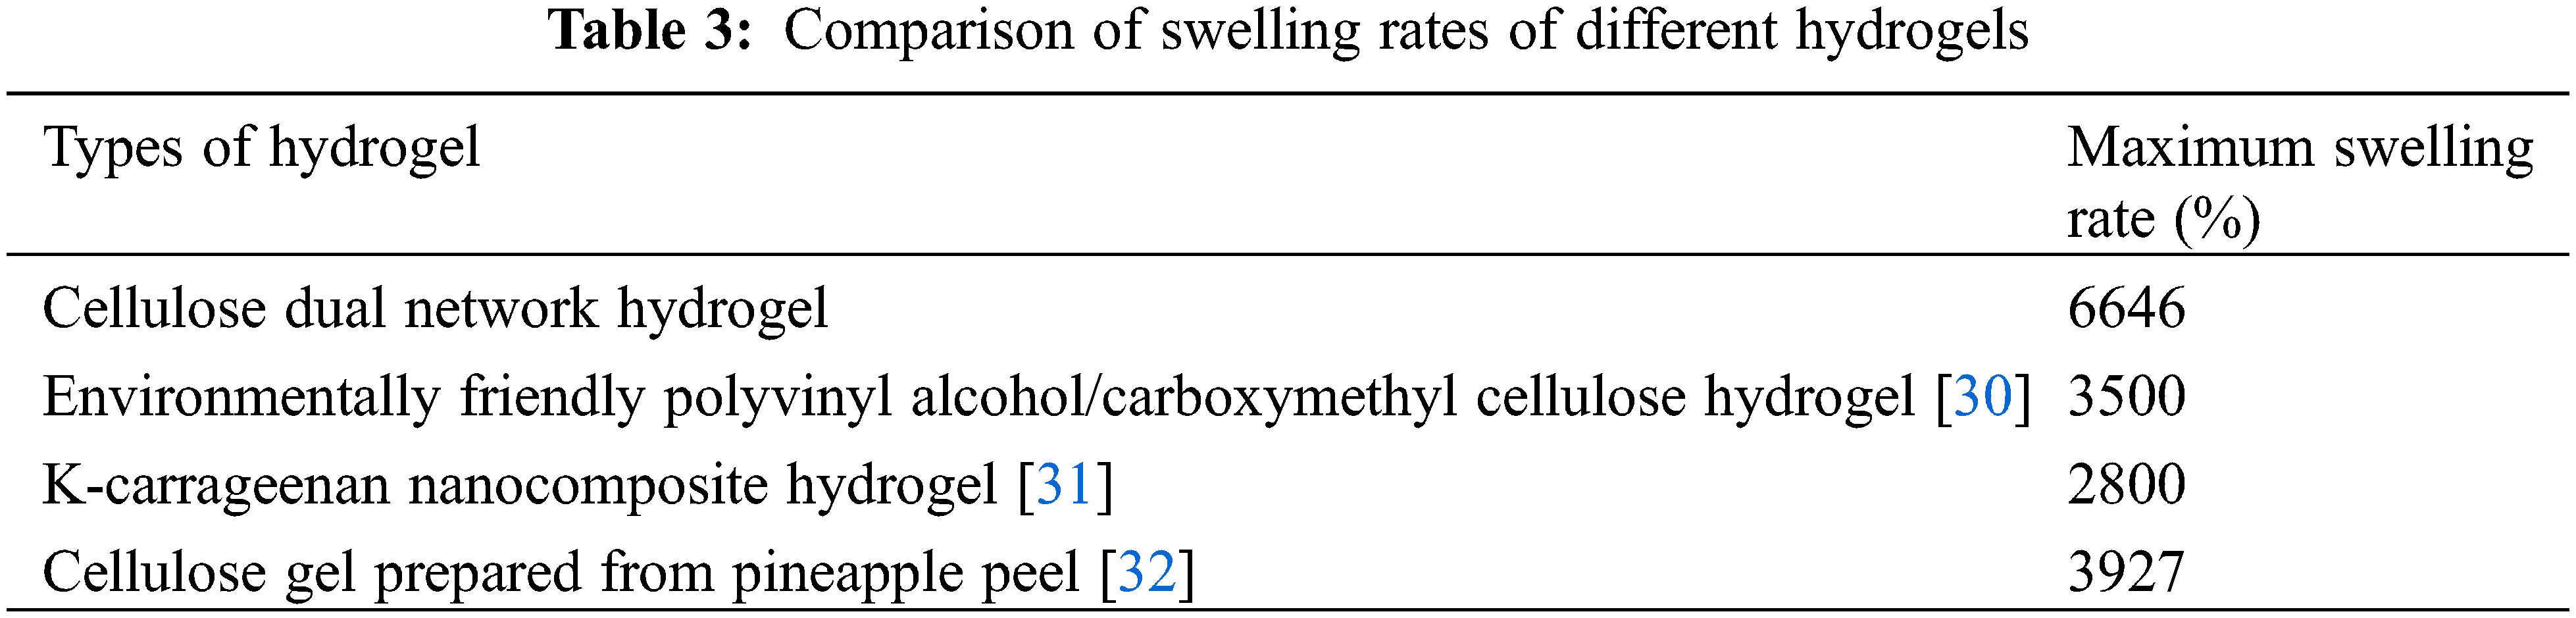
The experiments were analysed visually using orthogonal experiments with SPS dosage, MBA dosage, polymerisation temperature, and AA dosage as independent variables and Sr as the response value. The results are shown in Table 2. The degree of influence of every single factor on Sr was as follows, SPS dosage > AA dosage > MBA dosage > polymerisation temperature, where the optimal conditions for hydrogel preparation were: cellulose dosage of 0.40 g, SPS dosage of 0.20 g, polymerisation temperature of 70°C, MBA dosage of 0.25 g, and AA dosage of 3.0 mL. All the subsequent hydrogels were prepared under these conditions. The highest swelling rate of the hydrogel was 6646%, which was higher than that of the hydrogels prepared by other methods, as shown in Table 3.
3.3 XRD Characterisation Results of the Prepared Hydrogels
PS, PSC, and PSC-Hydrogel were characterised by XRD, and the results are shown in Fig. 3A. The characteristic diffraction peaks of PS mainly appeared at 2θ = 15.63°, 22.13° and 26.68°, which corresponded to the typical cellulose type I structure [33]. After extraction, the characteristic diffraction peaks of PSC remained at 2θ = 15.63°, 22.13° and 26.68°. It was obvious that the peak area changed and the cellulose crystalline shape changed to a cellulose type II structure. Both PS and PSC crystallinity originated from the intramolecular hydrogen bonding of -OH and -COOH groups in their structures [34].
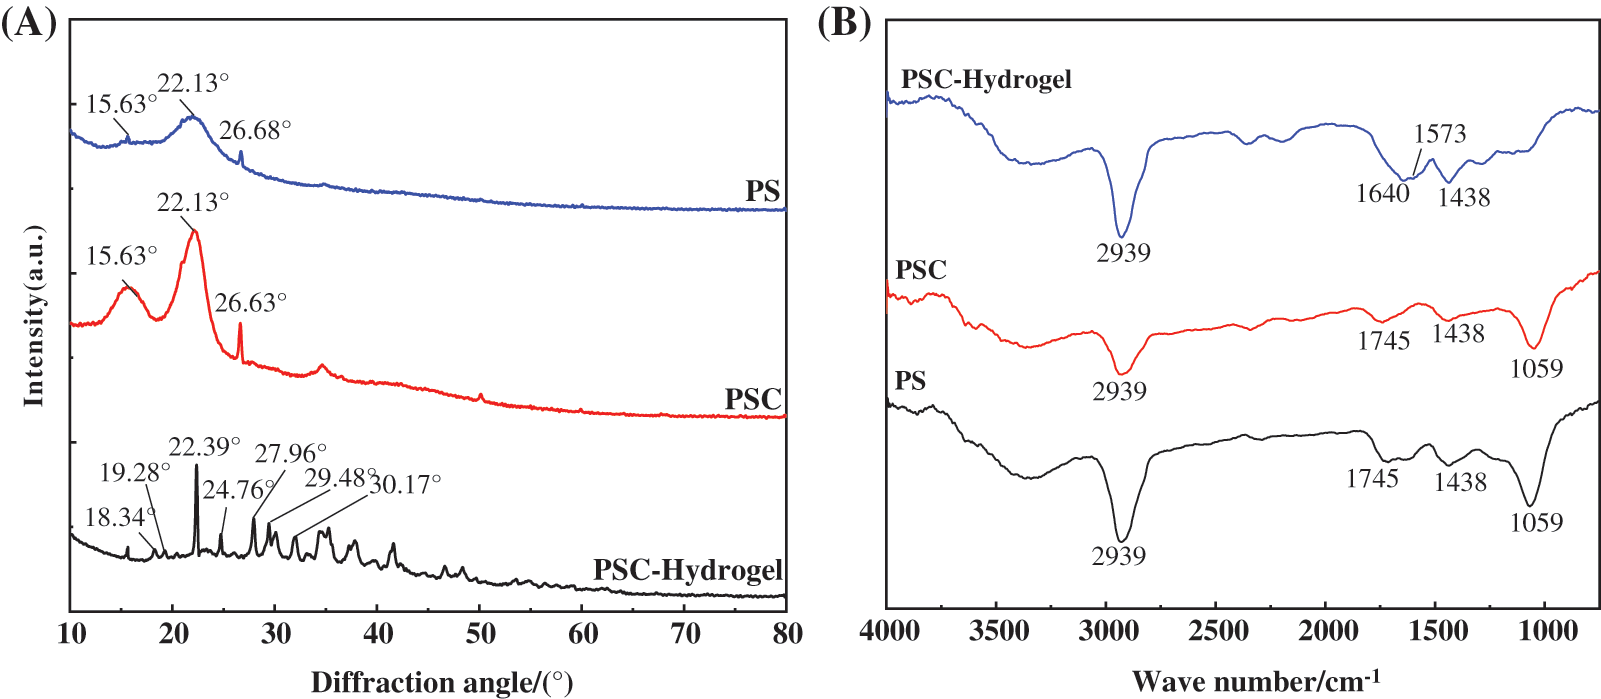
Figure 3: (A) XRD pattern and (B) FT-IR spectra of PS, PSC and PSC-Hydrogel
Crystallinity calculations revealed that the crystallinity index of PS was only 4.53%, while the crystallinity index of PSC was 10.25%, which was 5% higher compared with PS. This was because PS contained a large number of amorphous substances, which could remove the attached substances such as lignin and hemicellulose wrapped on the outer layer of cellulose during the extraction process of NaOH-NaClO2, exposing cellulose and enhancing its crystallinity [35].
According to the XRD pattern, the intensity of the crystalline diffraction peak of PSC-Hydrogel cellulose type II was significantly weaker than that of PSC, indicating that the original crystalline structure of cellulose was destroyed during the cross-linking polymerisation reaction of the hydrogel. This resulted in reduced crystallinity, which increased the chance of water molecules entering the network structure of the solvated hydrogel, and increased the hydrogel’s water-holding capacity.
Additionally, in the case of PSC-Hydrogel, the original PSC diffraction peak at 2θ = 26.68° shifted to 2θ = 27.96° with reduced intensity, indicating that the hydrogen bonding between the hydrogel polymer chains was weakened due to the conversion of -OH groups of cellulose to C-O-C during the graft polymerisation process [36], resulting in a new diffraction peak.
In addition, crystalline diffraction peaks of Na2CO3 were found at 2θ = 22.39°, 27.96°, 29.48° and 30.17° in the spectrum. This was presumably because, during the extraction of cellulose, hydrated Na+ intruded into the original crystalline region of cellulose. Finally, crystalline diffraction peaks containing C, H, and O elements were found at 2θ = 18.34°, 19.28° and 24.76°, which were the characteristic peaks of organic compounds.
3.4 FT-IR Characterisation Results of Hydrogels
PS, PSC, and PSC-Hydrogel were characterised by FT-IR analysis, and the spectra are shown in Fig. 3B. IR absorption spectra of PC and PSC were comparable, with a broad absorption band at 1059 cm−1 corresponding to the asymmetric stretching vibration of C-O-C [37], a peak at 1438 cm−1 corresponding to the shear vibration of -CH2, a peak at 1745 cm−1 corresponding to -C=О stretching vibration [38], and the stretching vibration peak of C-H at 2933 cm−1 [39]. These results indicated that no derivatisation reaction occurred during the cellulose extraction process.
In the case of PSC-Hydrogel, compared with PS and PSC, the asymmetric stretching vibration peak of C-O-C at 1059 cm−1 and -C-О stretching vibration peak at 1745 cm−1 disappeared, indicating that the grafting reaction consumed the groups on PSC. Furthermore, the weak -NH2 characteristic peak at 1573 cm−1 and C-О stretching vibration peak of the amide group at 1640 cm−1 indicated that monomer AA and cross-linking agent MBA were involved in the reaction and the functional groups were successfully grafted onto the fibre macromolecular chains [40].
3.5 SEM Characterisation Results of Hydrogels
In order to investigate the mechanism of the hydrogel with high swelling ability, SEM characterisations of PS, PSC and PSC-Hydrogel were performed, and the results are shown in Fig. 4. It was observed that the surface of untreated PS (Fig. 4a) showed a rough irregular shape, which was the structure formed by the cellulose in PS wrapped by lignin and hemicellulose. The dense structure of the extracted PS surface in Fig. 4b was disrupted, and cellulose was separated and exposed. The local magnification shown in Fig. 4c describes the strip clusters of cellulose, which was also observed in the SEM image of PSC-Hydrogel (Fig. 4d). The surface of PSC-Hydrogel displayed uneven and interconnected morphology. The cellulose formed an obvious first-layer network structure due to the graft copolymerisation reaction with monomer AA, and the second-layer flexible network contributed by MBA was interpenetrated with the first-layer network. The double network structure facilitated the infiltration of water molecules, thus, greatly improving the swelling property of PSC-Hydrogel.
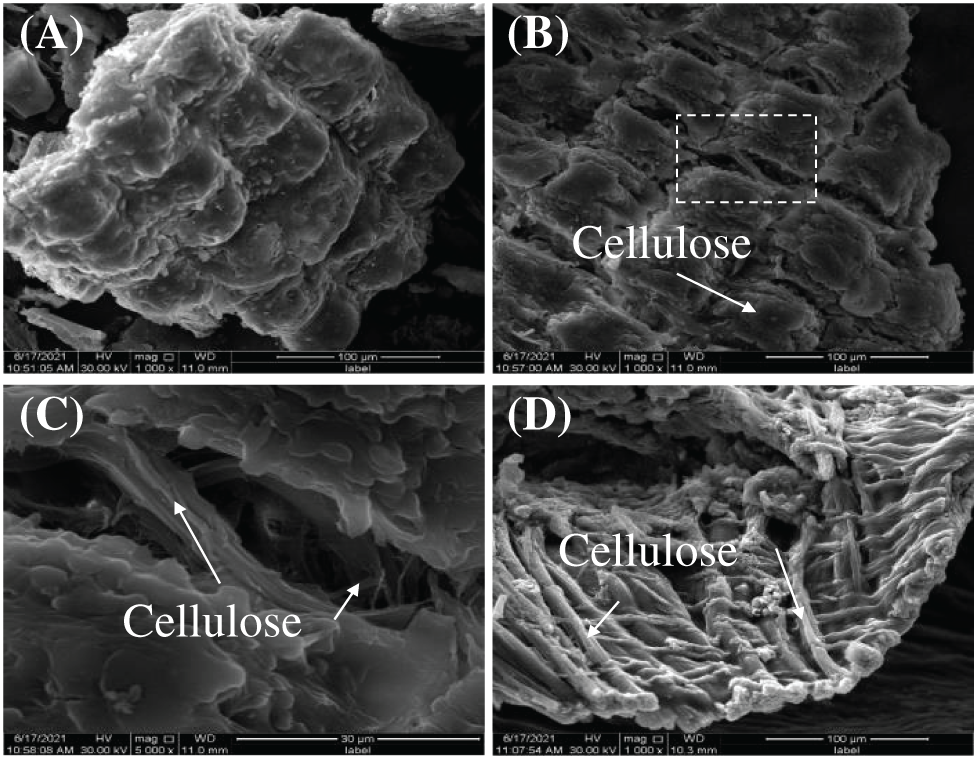
Figure 4: SEM images of (a) Peanut shell 1000×, (b) Peanut shell cellulose 1000×, (c) Peanut shell cellulose 5000×, and (d) Hydrogel 1000×
3.6 TGA Characterisation Results of Hydrogels
TGA analysis results of PSC-Hydrogel are shown in Fig. 5. The weight loss process of PSC-Hydrogel was divided into three stages. The first stage was from room temperature to 150°C. This was caused by the loss of water inside the hydrogel, which contributed to 74.98% of the sample’s total mass. The second stage was from 150°C to 350°C, which consisted of the destruction of -CONH2 in PSC-Hydrogel and -COOH in AA, with the weight loss caused by the destruction of -C-O-C- on the graft chain. The third stage was from 350°C to 600°C, where the disruption of the cross-linked structure in PSC-Hydrogel and weight loss were due to carbonisation of organic components.
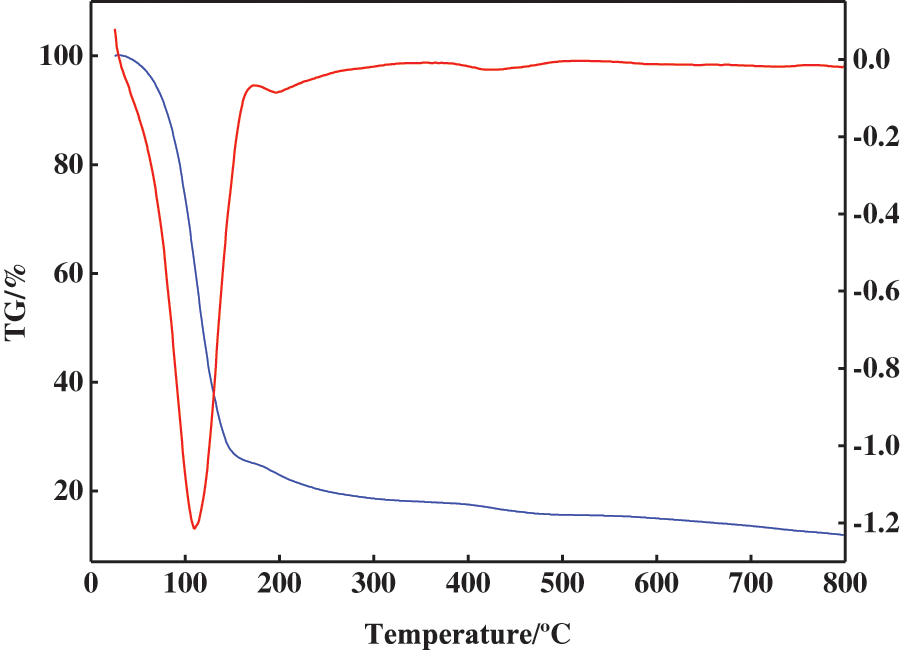
Figure 5: TGA analysis of hydrogels
3.7 Hydrogel Swelling Kinetic Analysis
To further explore the swelling behaviour of the prepared hydrogels, the swelling rate changes were measured at different temperatures (10°C, 20°C and 30°C), and the results are shown in Fig. 6A. The change in the trend of Sr at different temperatures was similar, where rapid growth was observed in the first stage, then slowed in the second stage, and equilibrated in the third stage. In the first stage, water molecules first diffused to the inside of the hydrogel, triggering the rapid stretching of polymer chains. Thus, the internal spatial structure of the hydrogel expanded with a large number of water molecules invading and forming a significant amount of hydrogen bonds with hydrophilic groups such as -COOH, resulting in hydrogel swelling. As the swelling proceeded, the swelling entered the second stage, where the internal network of the hydrogel was stressed to produce elastic contraction [41]. Then, the polymer chain extension became hindered, and the hydrogel swelling rate slowed. When the two tendencies of the polymer chain, stretching and contraction, were in conflict, the swelling entered the third stage, where the internal space of the hydrogel was stable and the swelling reached equilibrium.
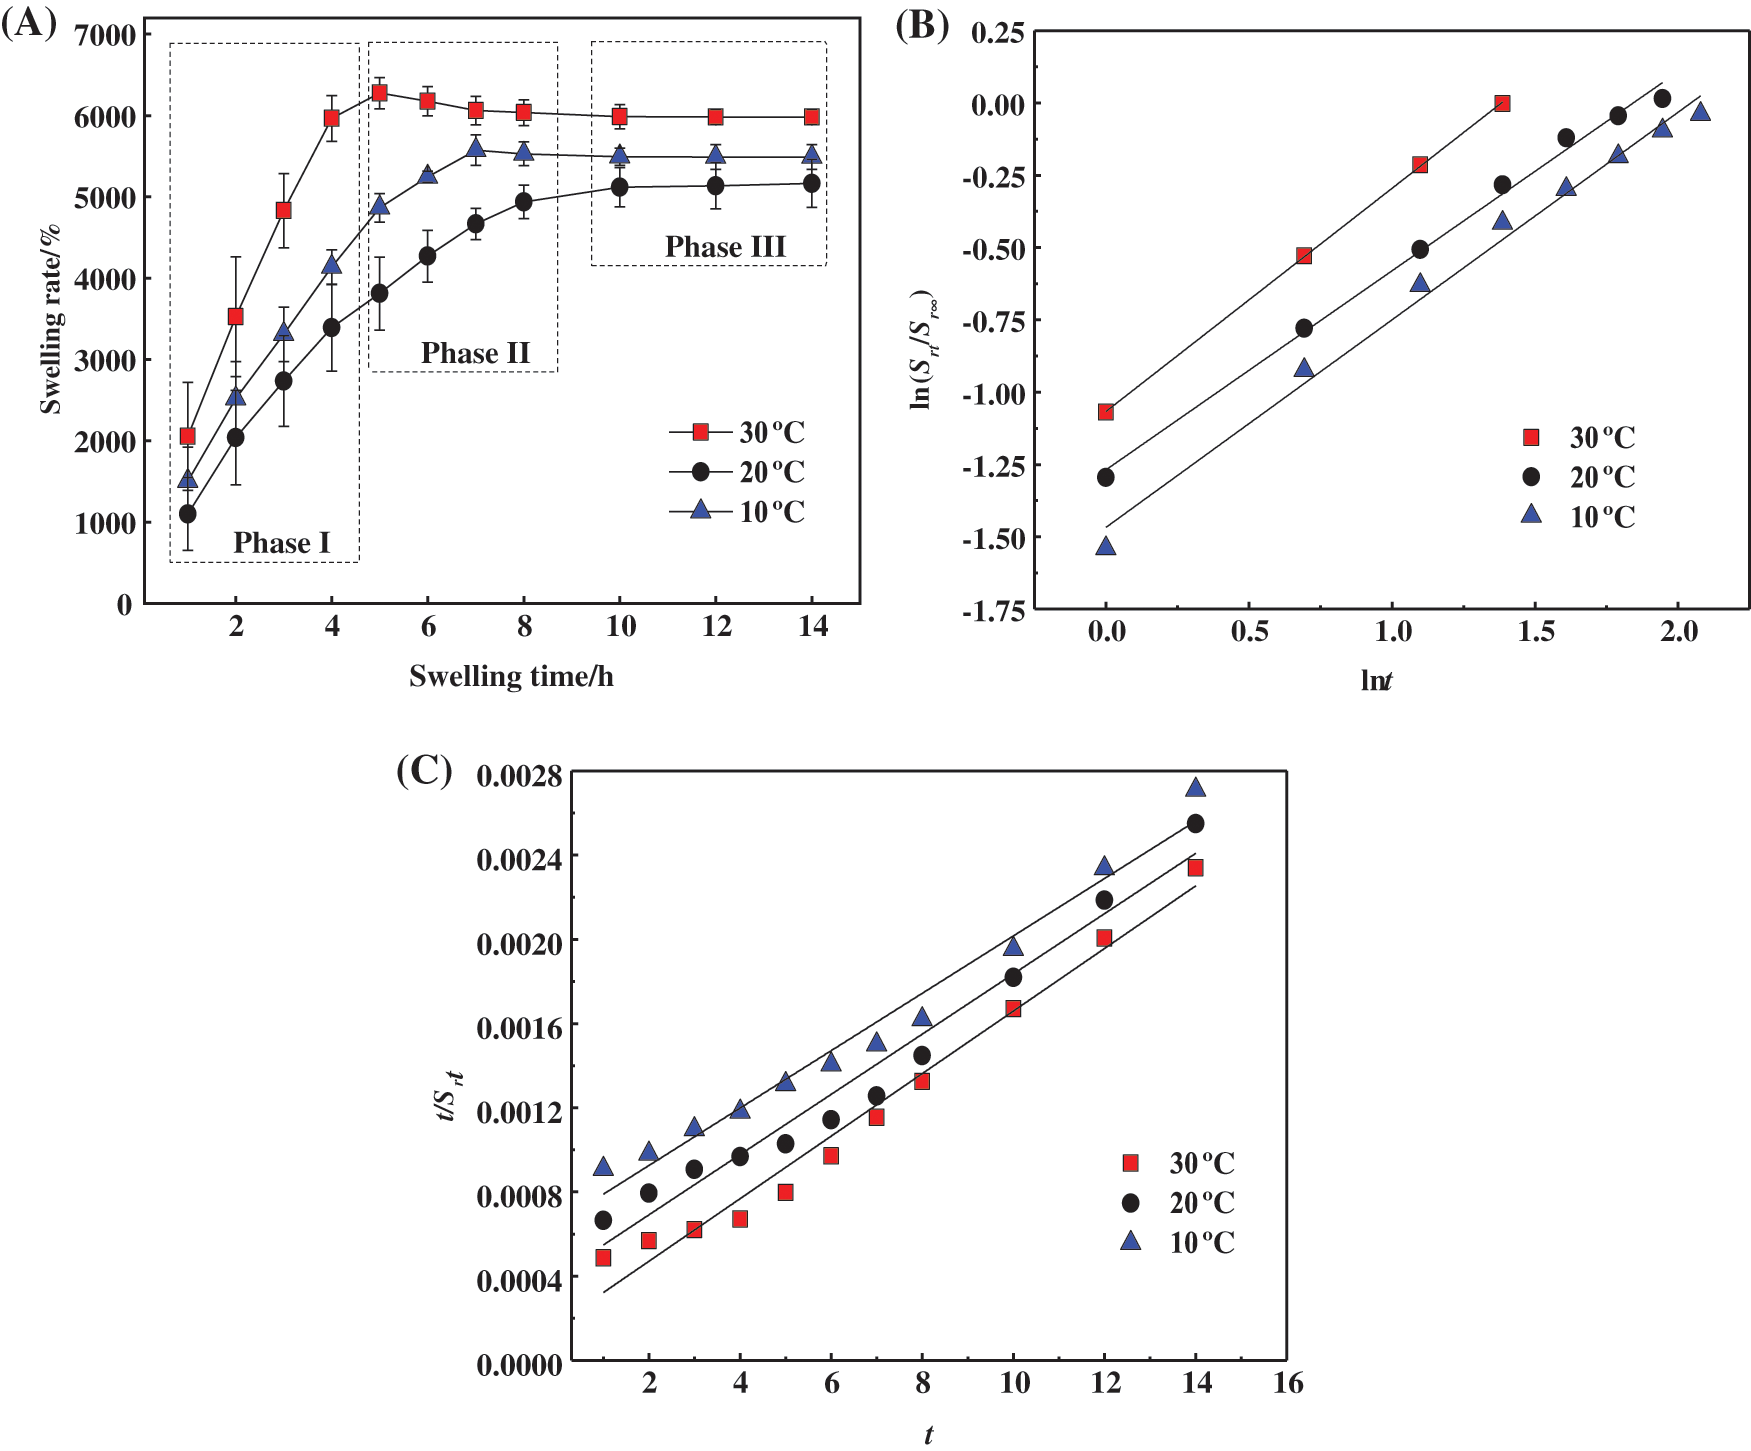
Figure 6: (A) Swelling rate of hydrogels at different temperatures. (B) Fitting curve of Schott’s second-order kinetic equation for the whole swelling process. (C) Fitting curve of Fickian diffusion model for the first stage of swelling
In order to explain the swelling behaviour of PSC-Hydrogel more reasonably, the whole process of hydrogel swelling was analysed using Schott’s secondary kinetic equation Eq. (8) [42], and the results are shown in Fig. 6A.
where Srt (%) is the swelling rate of PSC-Hydrogel at time t, Sr∞ (%) is the equilibrium swelling rate of PSC-Hydrogel, t (h) is the swelling time, and ks is the swelling rate constant.
As shown in Fig. 6B, the entire process of dissolution and Schott’s secondary kinetic equation fitting curve matched well, and the relevant parameters are shown in Table 4.
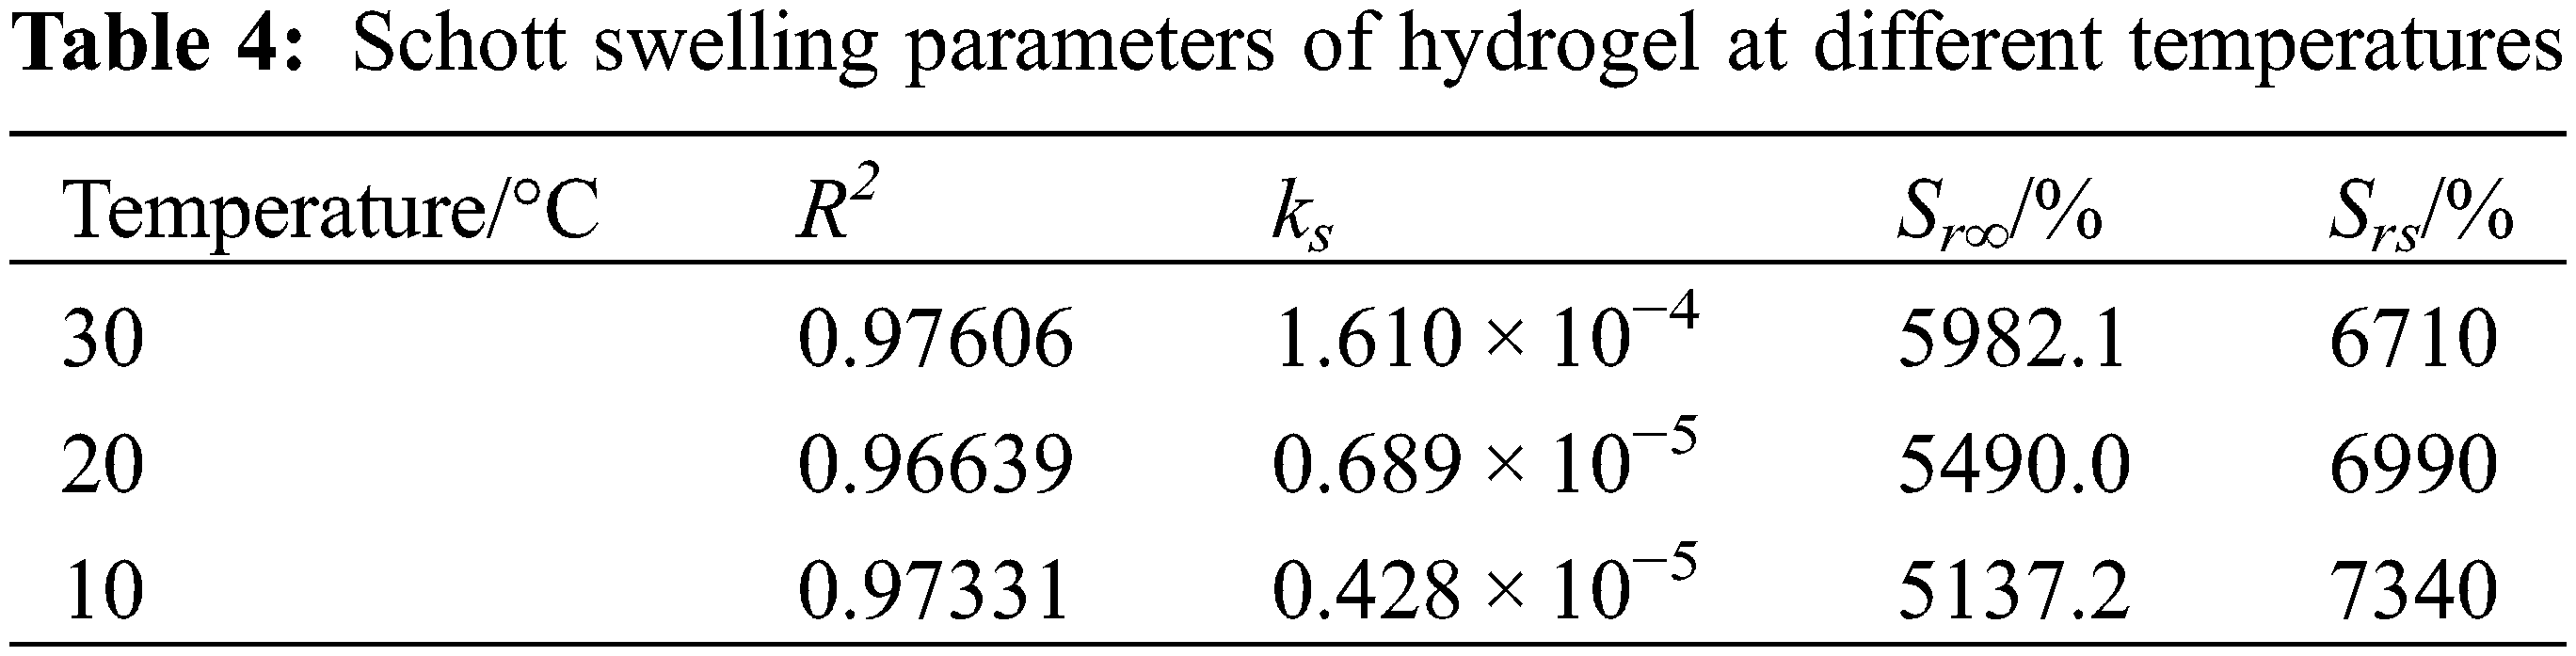
As listed in Table 4, the correlation coefficients R2 of the linear fitted curves of hydrogel swelling under different temperature conditions were greater than 0.9, which had a certain linear correlation and ks values were realistic. However, the theoretical equilibrium swelling rate Srs was large, which indicated that the whole swelling process of PSC-Hydrogel could not be simulated using the Schott secondary swelling kinetic model.
Considering the theoretical differences in the principles of the three stages of hydrogel swelling, the Fickian diffusion model Eqs. (9) and (10) were used to fit the first stage of swelling separately [43], and the results are shown in Fig. 6C.
where Srt (%) is the swelling rate of PSC-Hydrogel at time t, Sr∞ (%) is the equilibrium swelling rate of PSC-Hydrogel, t (h) is the swelling time, k is the swelling rate constant, and n is the characteristic index.
Fig. 6C shows that the first stage of hydrogel swelling exhibited good coincidence with the fitted curve of the Fickian diffusion model, and the relevant parameters are listed in Table 5.
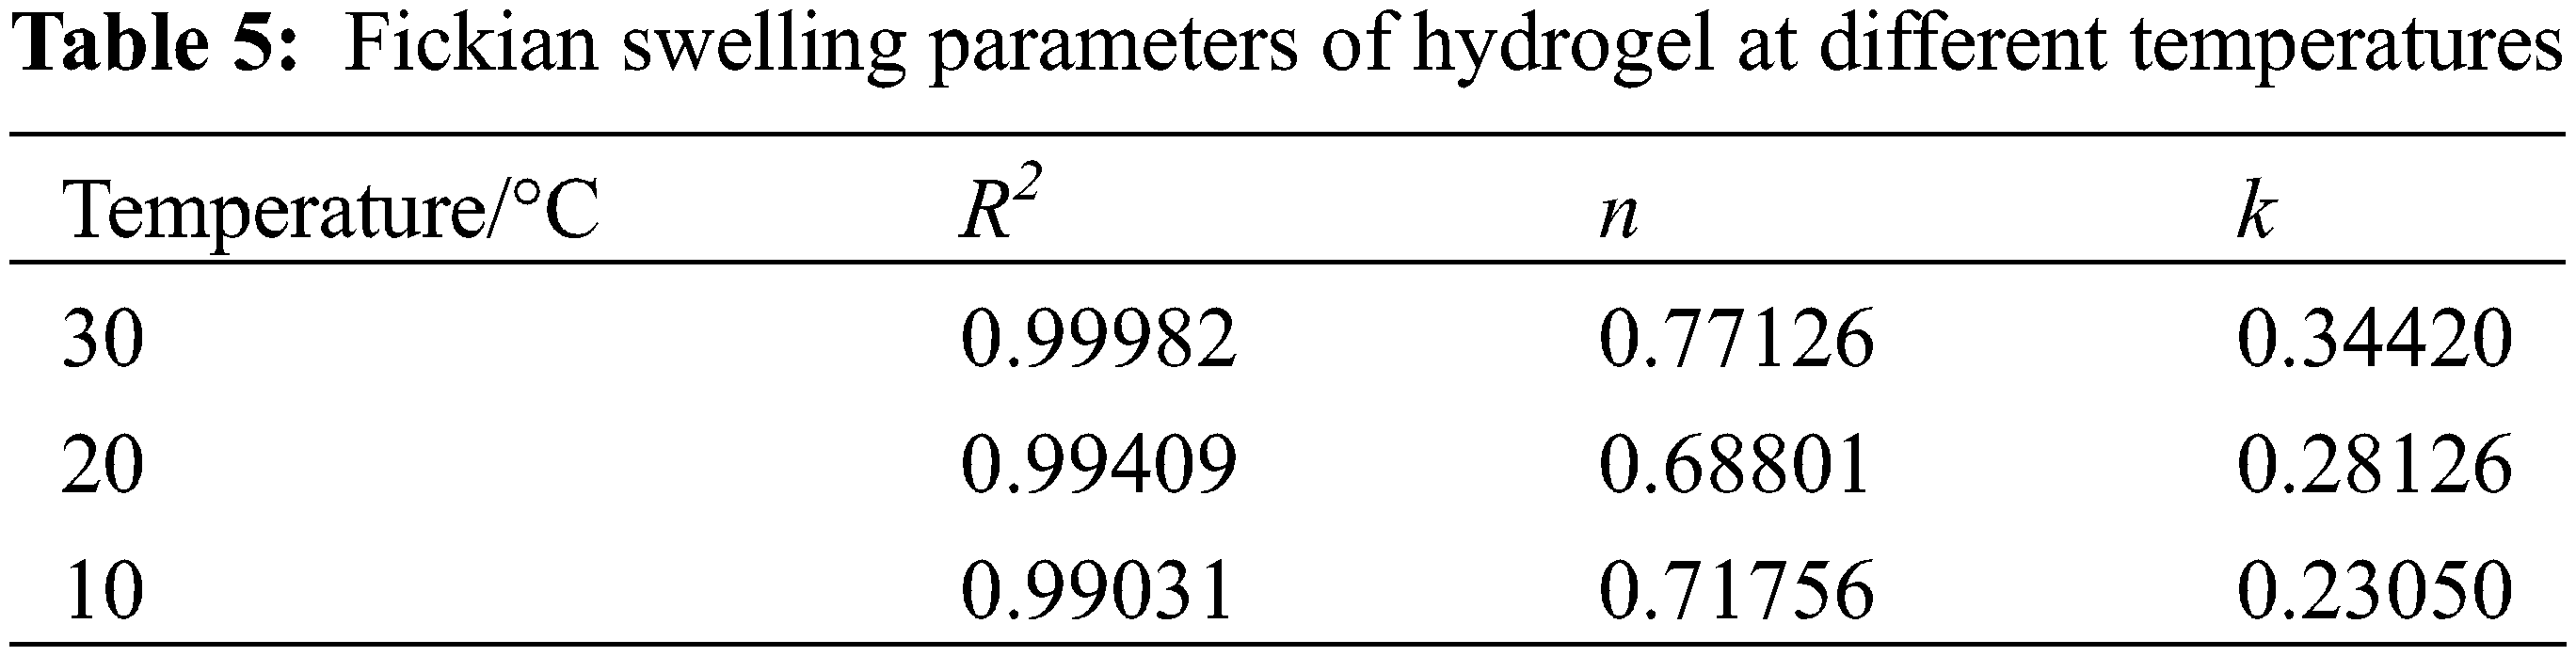
As shown in Table 5, the correlation coefficients R2 of the fitted curves for the first stage of hydrogel swelling at different temperatures were all greater than 0.99, 0.5 < n < 1.0. This indicated that hydrogel swelling in the first stage satisfied the Fickian diffusion model, and the swelling was determined by both water diffusion and polymer chain stretching inside the hydrogel [44].
3.8 Adsorption Property Analysis of the Prepared Hydrogels
Keeping other variables constant, 0.2 g of PSC-Hydrogel was placed into 80 mL of 5 mg/L MB solution and the adsorption experiments were performed at different temperatures. The actual adsorption performance of the hydrogels for MB at 25°C for different adsorption times is shown in Fig. 7.
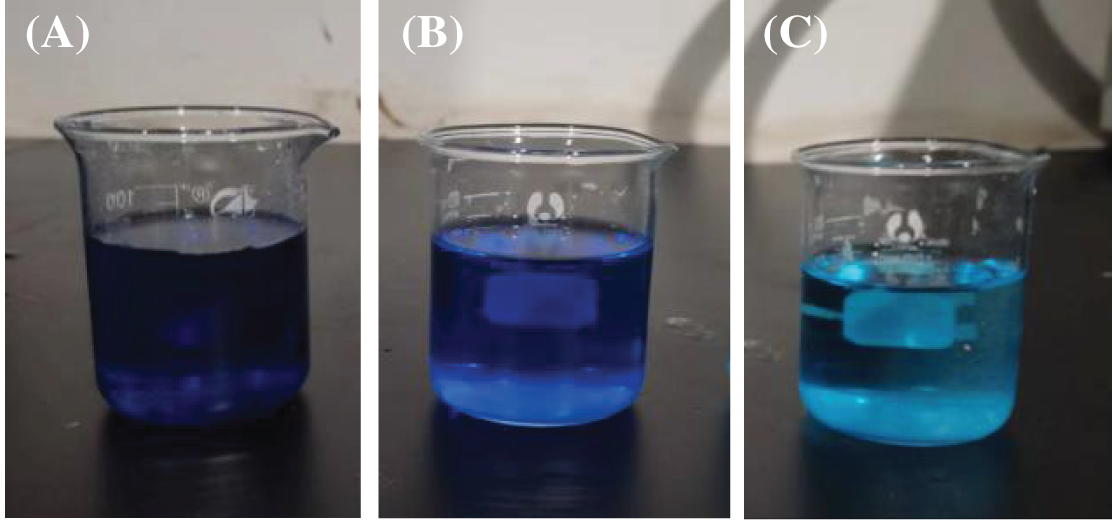
Figure 7: Comparison of hydrogel adsorption of MB at different times: (a) 0 h; (b) 18 h; (c) 48 h
The results of the adsorption property of PSC-Hydrogel towards MB dye at different temperatures are shown in Fig. 8A. The change trend of Qt at different temperatures was comparable, and the adsorption processes all showed a similar trend of fast and then slow, and finally equilibration. During 1∼7 h, PSC-Hydrogel adsorbed MB rapidly and the blue colour of the MB solution became lighter. This was due to the rapid water absorption of hydrogel swelling with increased stretching of cellulose macromolecule chains, the opening of adsorption sites inside the hydrogel space, and increased binding of MB dye molecules to the adsorption sites. During 7∼26 h, the adsorption sites on the PSC-Hydrogel structure were gradually occupied, the surface attraction between MB molecules and PSC-Hydrogel gradually decreased, and the adsorption rate of PSC-Hydrogel on MB gradually decreased. After 26 h, the adsorption sites on the hydrogel surface were saturated, and the adsorption of MB on the hydrogel reached equilibrium.
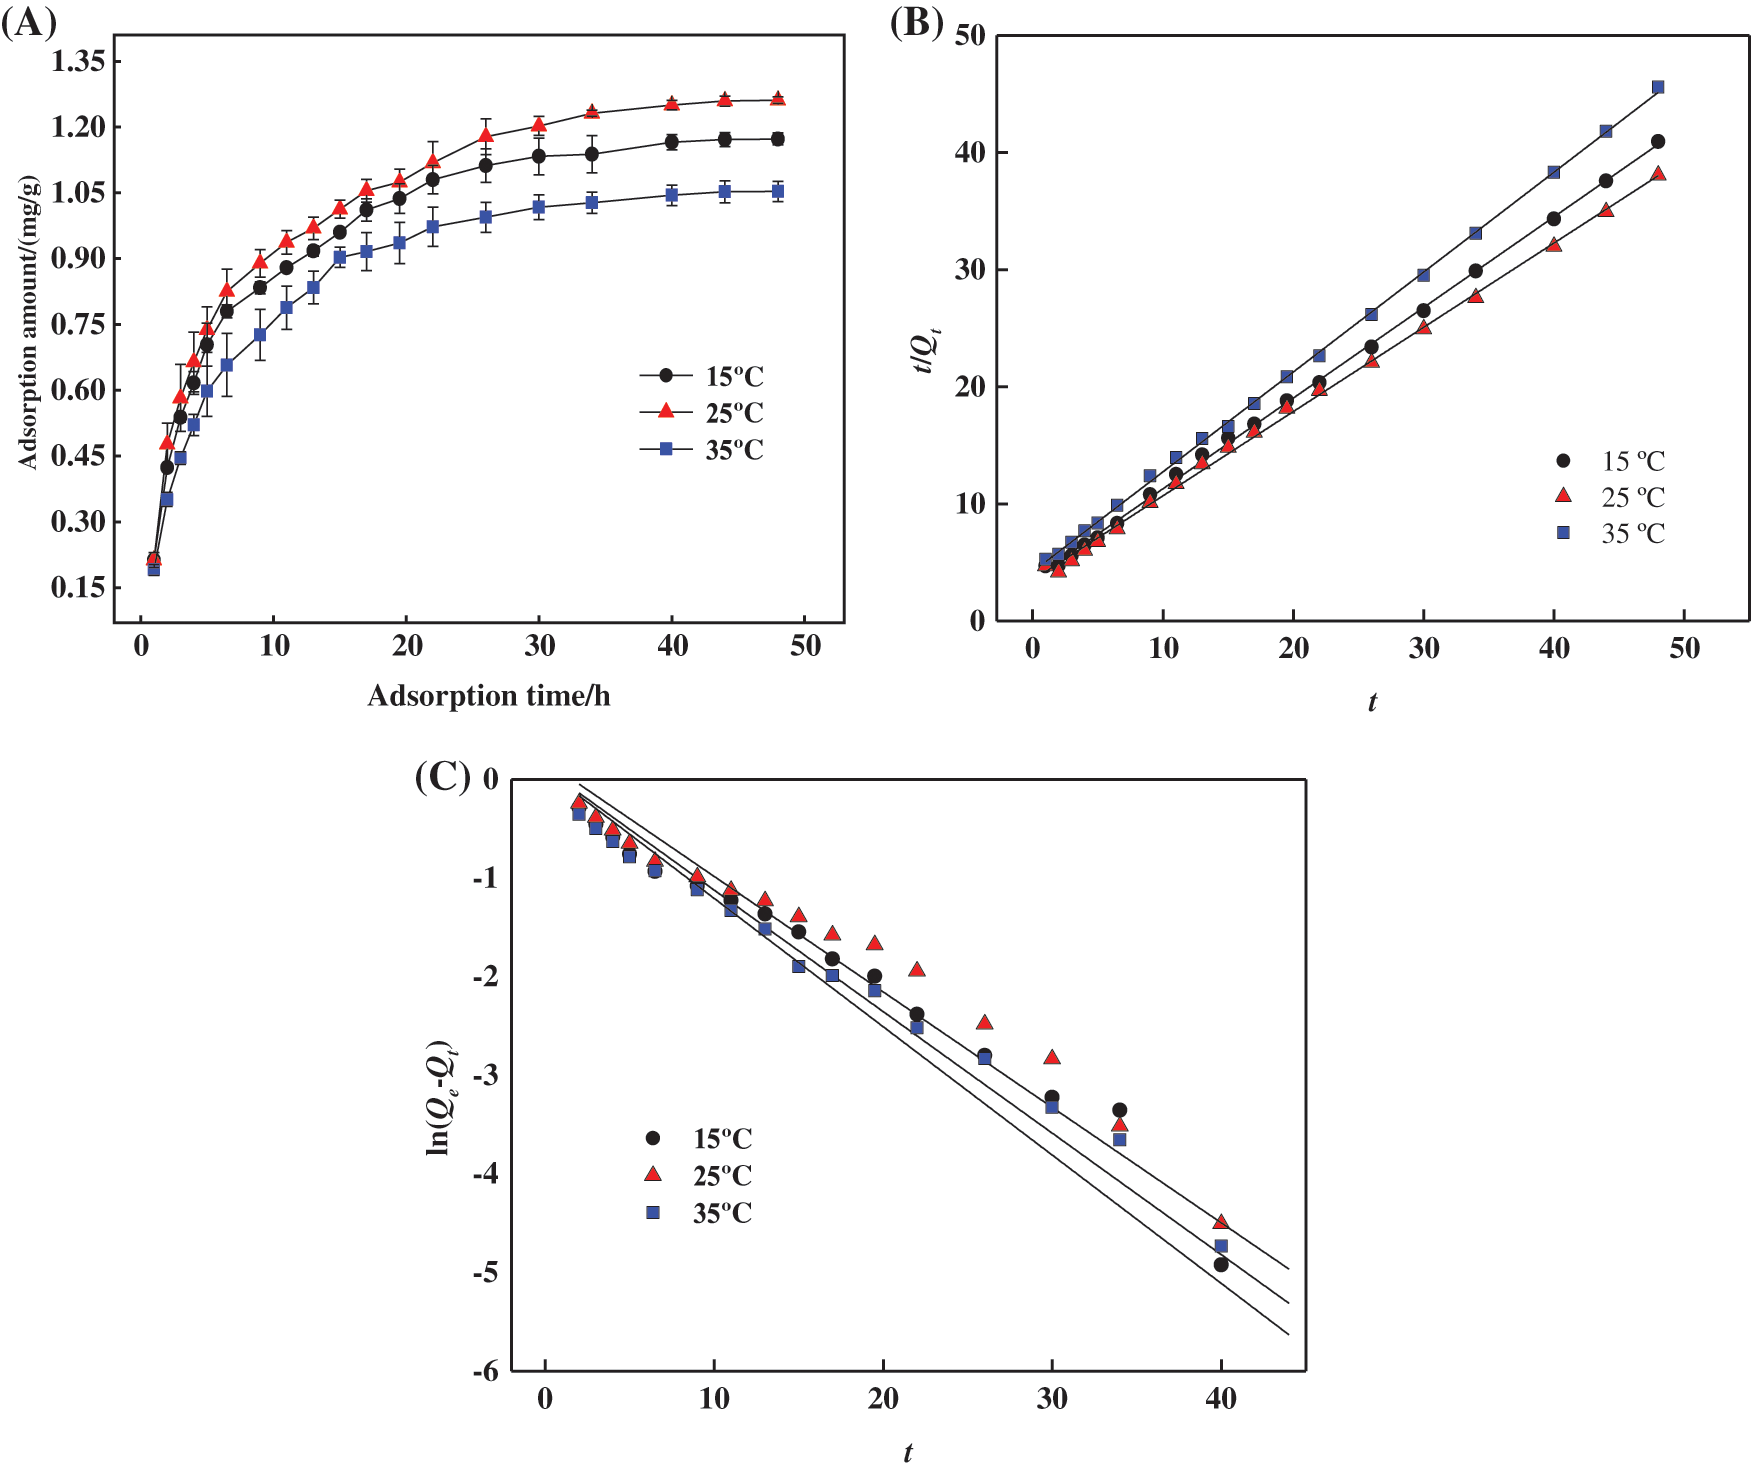
Figure 8: (A) Adsorption capacities of aqueous hydrogel for MB at different temperatures. (B) Pseudo primary kinetic equation fitting curve for adsorption of MB by hydrogels. (C) Pseudo secondary kinetic equation fitting curve for adsorption of MB by hydrogels
To further explore the adsorption behaviour of PSC-Hydrogel, the pseudo primary model Eq. (11) and pseudo secondary model Eq. (12) were used to evaluate the MB adsorption process, and the results are shown in Figs. 8B and 8C.
where Qe(mg/g) is the adsorption amount at PSC-Hydrogel adsorption equilibrium, k1 is the adsorption pseudo primary kinetic model coefficient, and k2 is the pseudo secondary kinetic model coefficient.
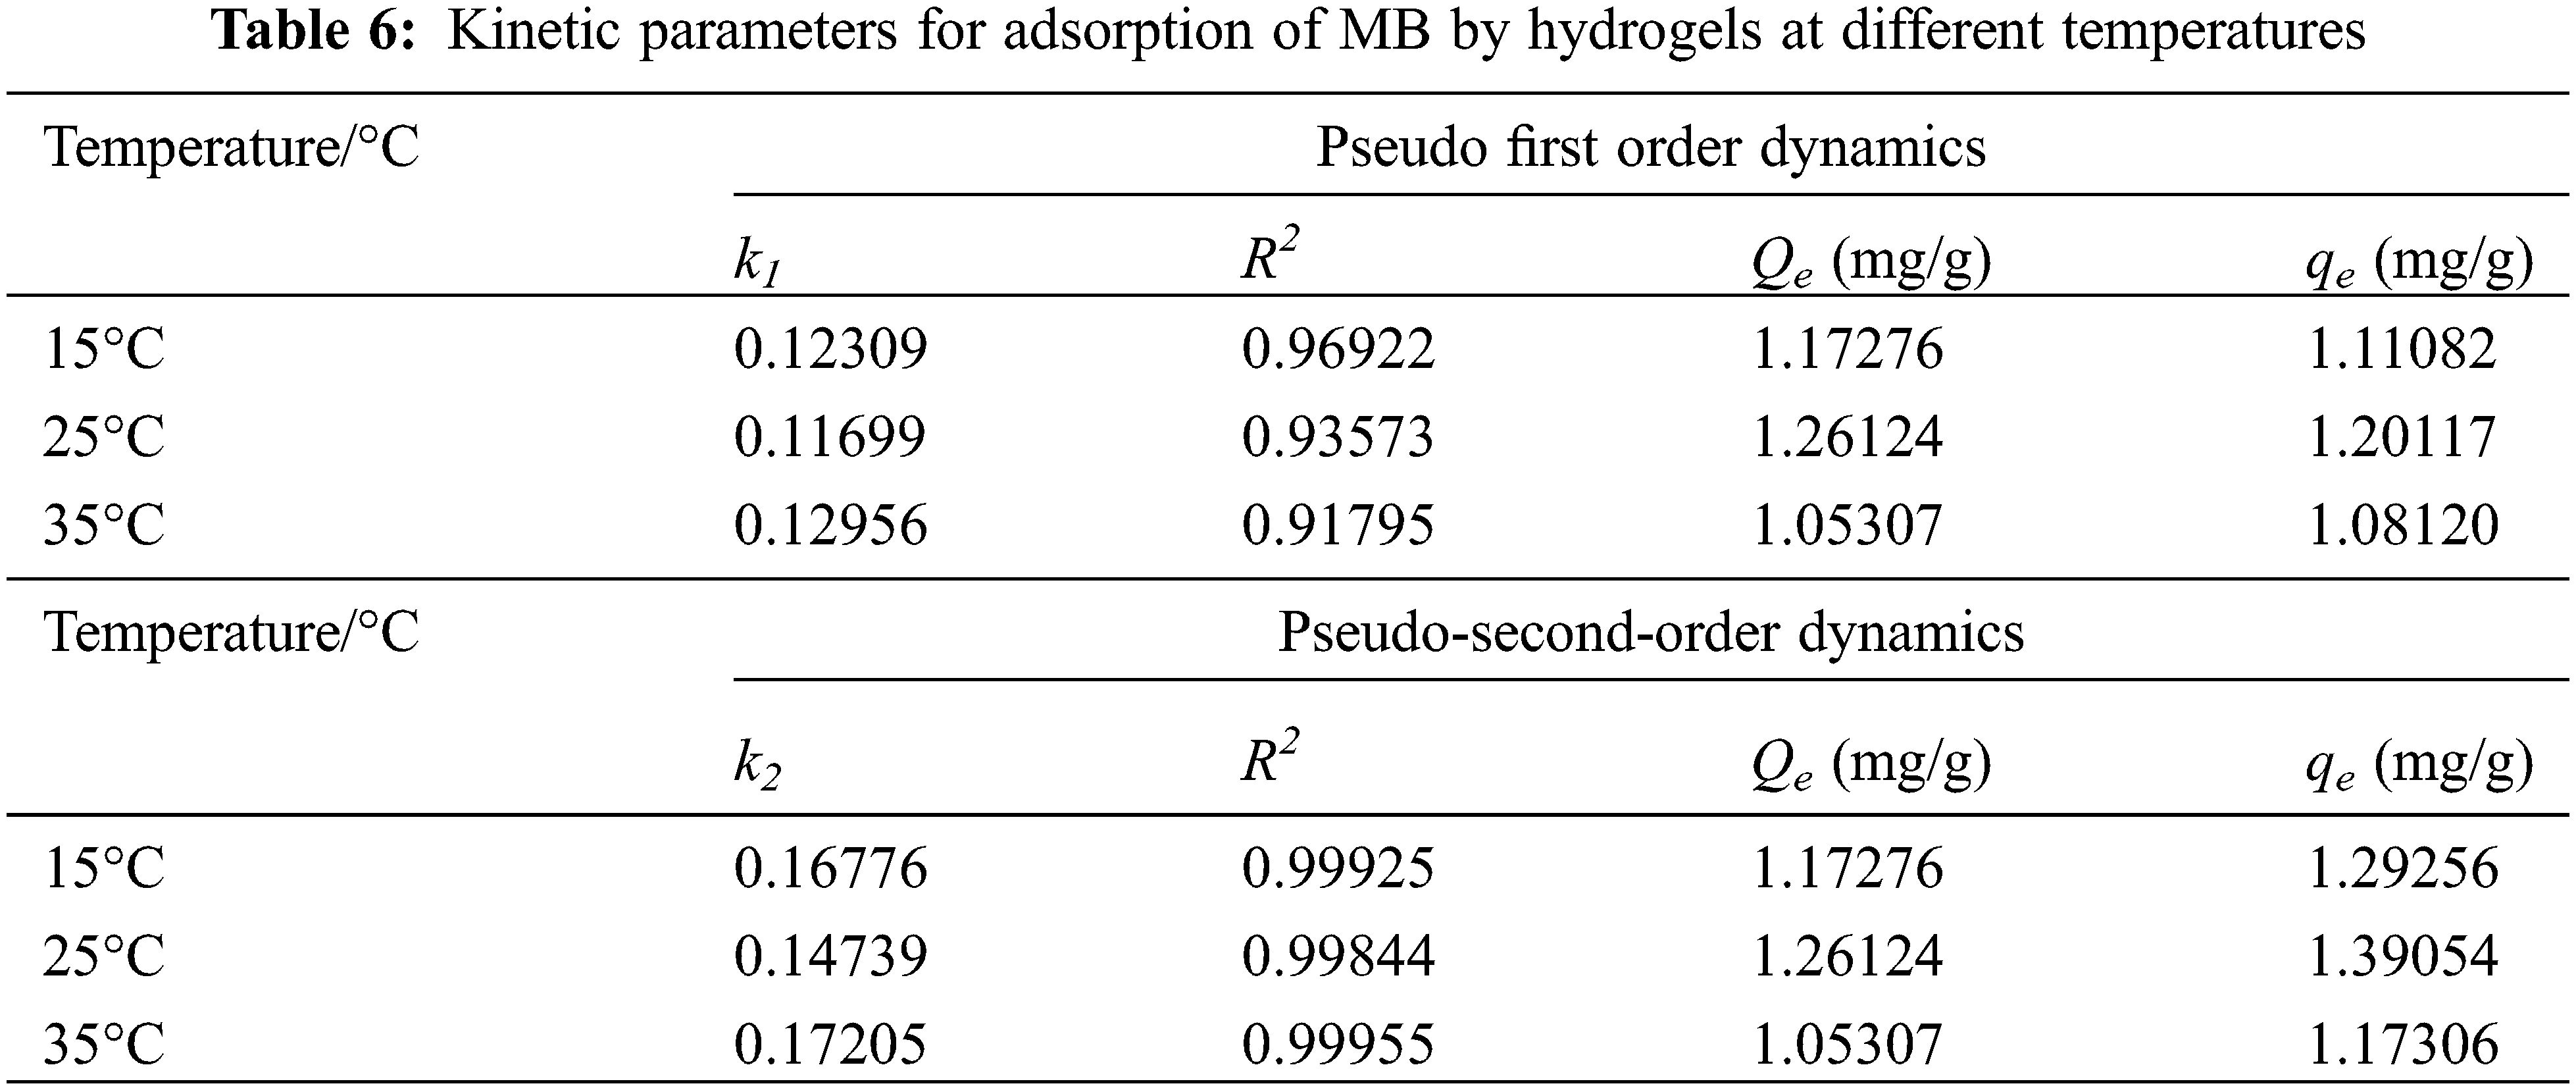
According to the fitted parameters listed in Table 6, the theoretical adsorption amount of both the pseudo primary kinetic and pseudo-secondary kinetic models of PSC-Hydrogel adsorption of MB was similar to the actual adsorption amounts. However, the theoretical adsorption amounts of the pseudo secondary kinetic model were higher than the actual situation. Additionally, the linear correlation coefficient R2 values of the pseudo-secondary kinetic model were all greater than 0.99. This excellent correlation indicates that the adsorption process of PSC-Hydrogel adsorption MB was more consistent with the pseudo-secondary kinetic model. It also indicates the existence of chemical adsorption in the process.
In order to further evaluate the kinetics of the MB adsorption process on the gel surface, this adsorption process was investigated using the Elovich kinetic model, and the results are shown in Fig. 9 and Table 7.
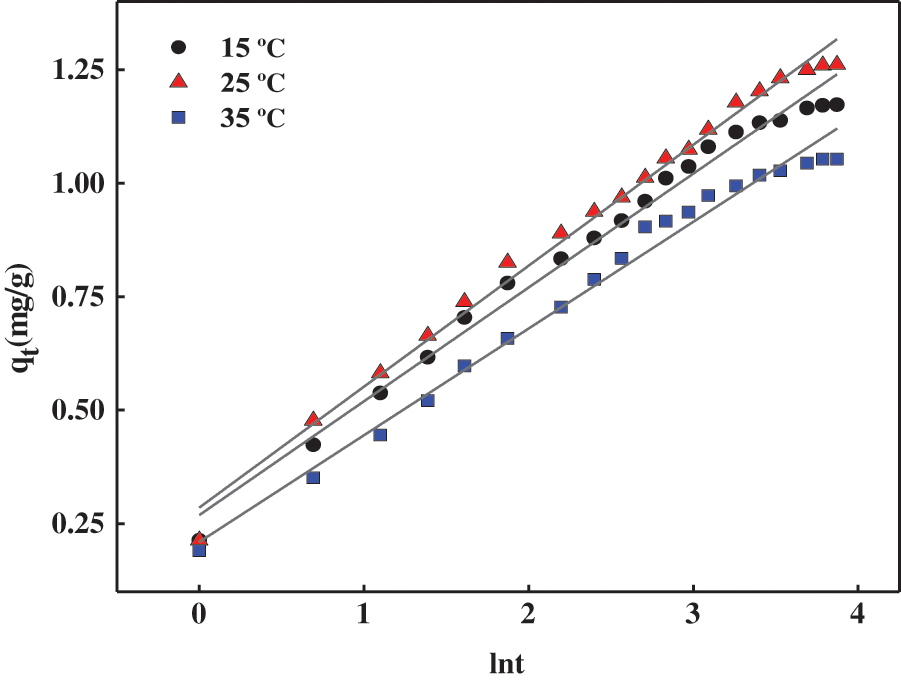
Figure 9: Elovich fitting curve for adsorption of MB by hydrogels at different temperatures
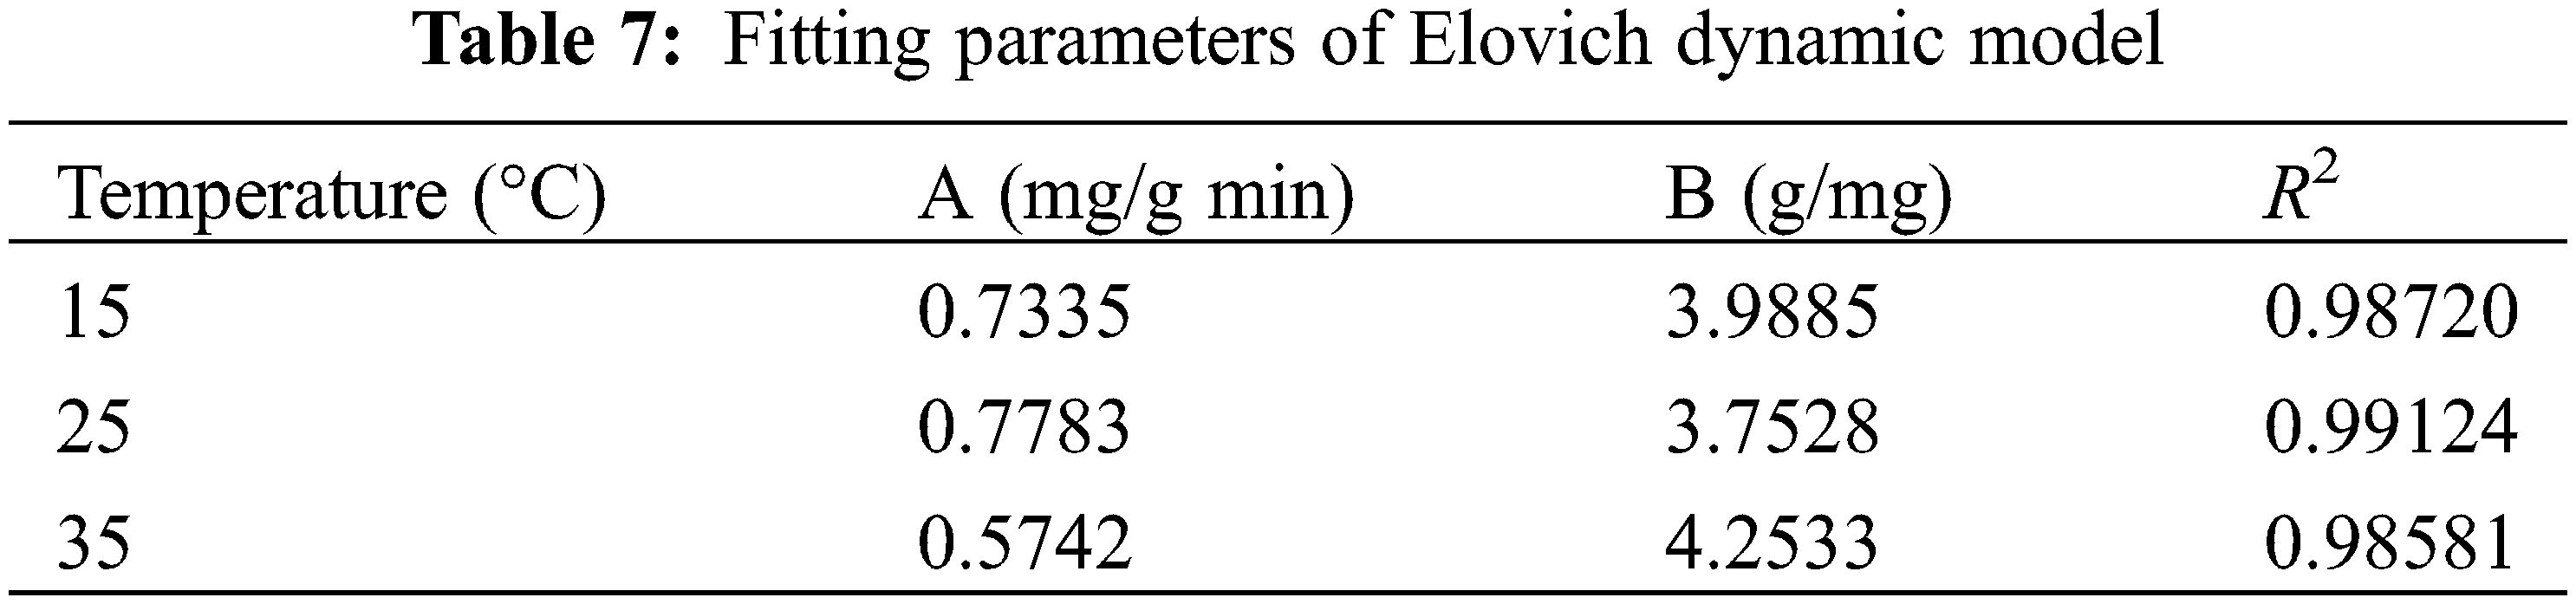
Elovich equation is usually applied to chemisorption kinetics and some slow adsorption processes in a wide range. It is suitable for systems with heterogeneous adsorption surfaces, and its model is shown in Eqs. (13) and (14) [37].
Integration over the boundary yields
where α (mg/g min) is the initial adsorption rate and β is related to the degree of surface coverage and the activation energy of chemisorption (g/mg).
As seen from the fitted parameters listed in Tables 6 and 7, the R2 values for the second-order fitted model of hydrogel adsorption for MB are higher than those obtained for Elovich kinetics, indicating that the fitted curve for the second-order equation is closer to the experimental curve than the fitted curve for the Elovich model. It should be noted that the Elovich model can also be used to describe the adsorption of MB on the PSC-Hydrogel, based on a correlation coefficient R2 > 0.9, which indicates the presence of chemisorption between the PSC-Hydrogel and MB.
3.9 Adsorption Isotherm Analysis of the Prepared Hydrogels
In order to gain a clearer understanding of the relationship between adsorption and equilibrium concentration, experimental data on the adsorption of hydrogels for MB solutions with different initial concentrations at pH 7 and 25°C were fitted using the Langmuir and Freundlich isotherm models, and the results are shown in Fig. 10 and Table 8.
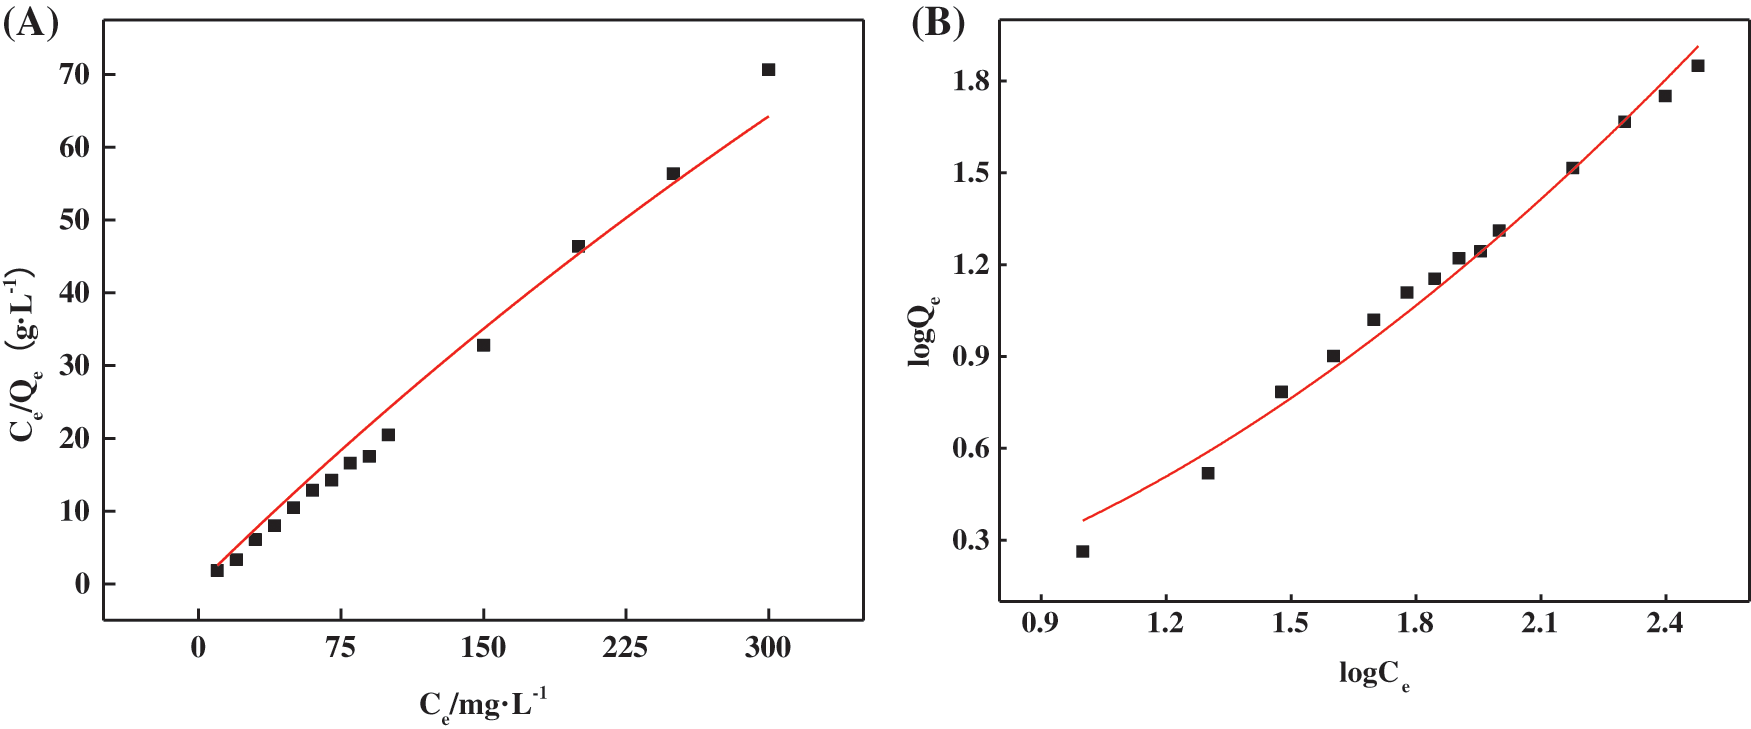
Figure 10: Fitting curves of Langmuir (A) and Freundlich (B) adsorption isotherm models for the adsorption of MB by hydrogels
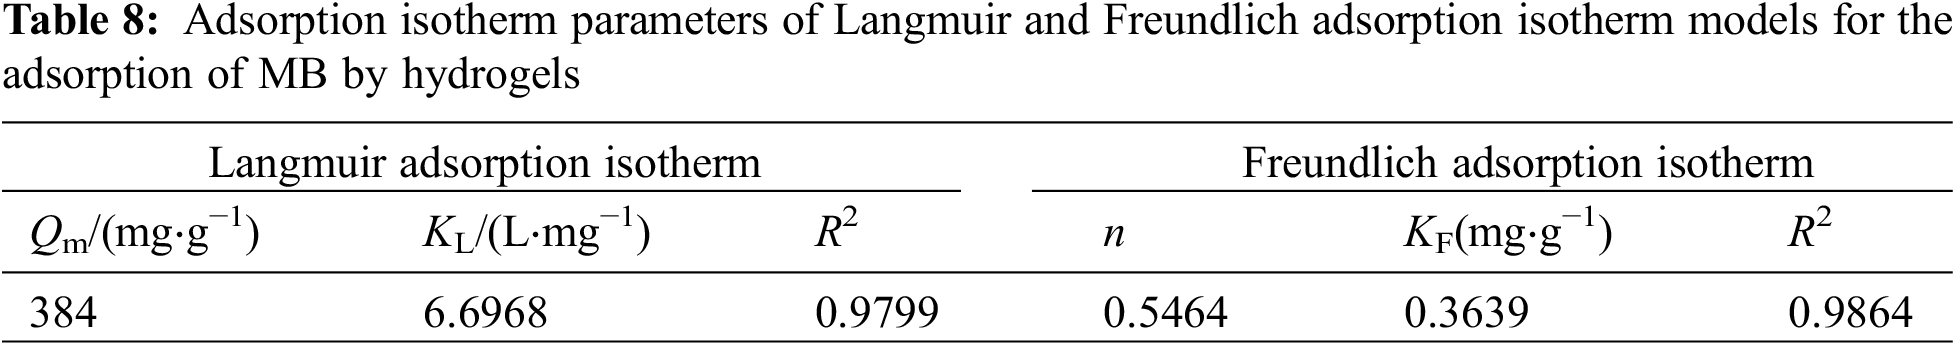
The Langmuir adsorption model assumes that adsorption occurs on a homogeneous adsorbent surface, as a monolayer, with a finite number of adsorption sites, and that the adsorption equilibrium is dynamic. The corresponding mathematical expression is shown in Eq. (15) [45]:
where Ce is the equilibrium concentration of MB in an aqueous solution (mg⋅L−1), Qe is the adsorption capacity at equilibrium (mg⋅g−1), Qm is the maximum adsorption capacity (mg⋅g−1), and KL is the Langmuir constant (L⋅mg−1). The abscissa is set by the Ce value, and then the Ce/Qe value is set to the ordinate to draw the chart. Qm and KL can be deduced respectively by the slope and intercept of the image obtained by fitting the experimental data.
The Freundlich adsorption model is usually used to simulate the multilayer adsorption phenomenon between the adsorbent and the surface functional groups, and its mathematical expression is shown in Eq. (16) [46]:
where KF is the Freundlich constant related to adsorption capacity (mg⋅g−1), and n is the parameter related to adsorption strength. With logCe as the abscissa and logQe as the ordinate, KF and n can be derived from the slope and intercept of the image obtained by fitting the experimental data, respectively.
Analysis of the results showed that the correlation coefficient of the Freundlich model (R2 = 0.9864) was higher than that of the Langmuir model (R2 = 0.9799), indicating that the theoretical sorption of MB fitted by the Freundlich model was closer to the experimental results. Therefore, the adsorption behavior of MB on PSC-Hydrogel was more inclined to chemisorption.
3.10 Adsorption Mechanism for the MB Dye by Prepared Hydrogels
Due to the three-dimensional mesh structure of the hydrogel, MB molecules are easily adsorbed. According to the above model analysis, the process of MB adsorption is mainly chemisorption, accompanied by physical adsorption. The functional groups on the surface of the hydrogel before and after adsorption were analyzed by FT-IR, as shown in Fig. 11.
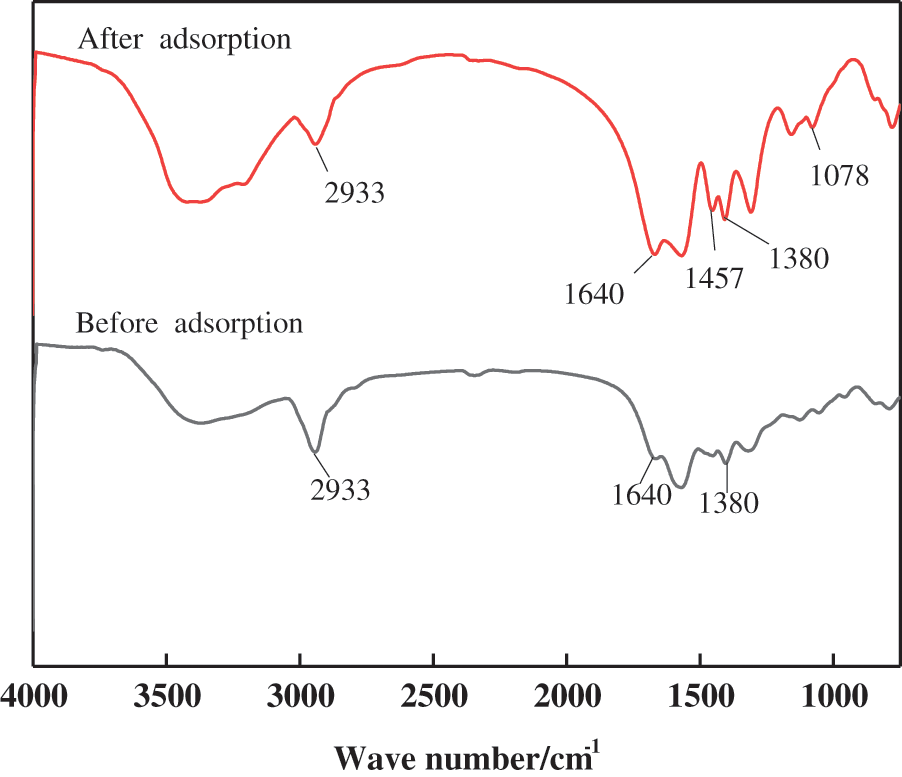
Figure 11: FT-IR spectra of PSC-Hydrogel before and after adsorption
The new peak at 1457 cm−1 after adsorption is due to C=C bond contraction vibration in the region of double bond stretching vibration [30]. The peak at 1380 cm−1 corresponds to polycycles with enhanced intensity, indicating the binding of MB on the hydrogel [47], while the peak at 1078 cm−1 is due to the vibration of the C-O-C glycosidic bond of cellulose [48]. The increase in the peak area at 1078 cm−1 after adsorption indicates the involvement of MB in the adsorption process on the hydrogel surface [49]. At the same time, hydrogen bonds are also involved in the adsorption process, and the free electron pair on the MB tertiary amine group forms hydrogen bonds with the hydroxyl group on the cellulose molecular chain [47]. In addition, the adsorption pore size (4.395 nm), average pore size (1.363 nm), and surface area (0.309 m2/g) of the hydrogel promote the adsorption of MB molecules, and allow MB molecules to diffuse through the pores on the surface of the hydrogel.
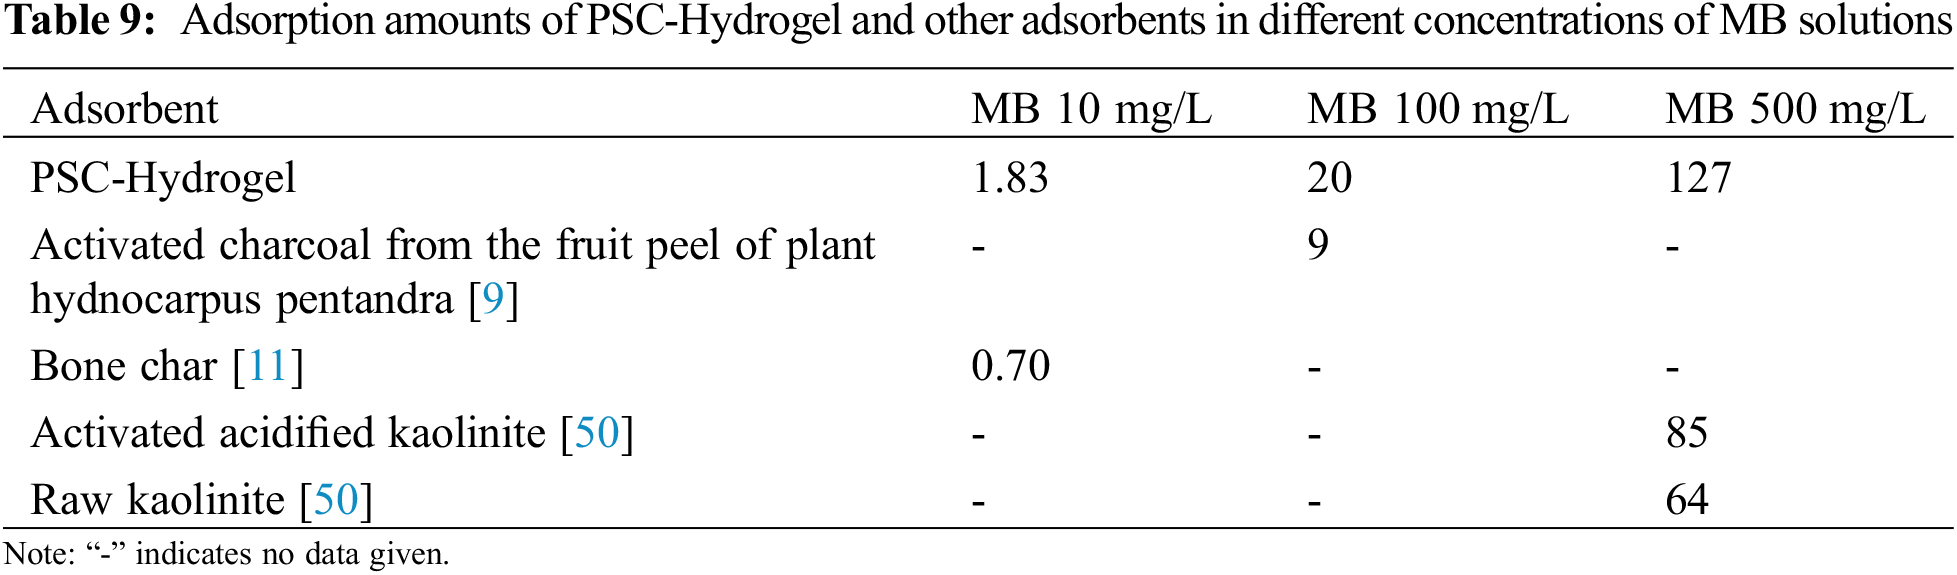
The above results illustrate the good adsorption properties of PSC-Hydrogel for MB. The comparison between the adsorption performance of PSC-Hydrogel and other adsorbents is shown in Table 9. It was found that the adsorption amount of cellulose double network hydrogel was higher than that of other adsorbents in different concentrations of MB solution, which indicates the excellent adsorption performance of PSC-Hydrogel.
A double network hydrogel was prepared by graft copolymerisation method, using peanut shell cellulose extract as the raw material, MBA as the cross-linking agent, sodium persulfate as the initiator, and AA as the monomer.
(1) After the single-factor tests and orthogonal experiments, the equilibrium hydrogel swelling rate was used as the response value for the process optimisation. The optimal conditions for hydrogel synthesis were as follows: 0.40 g of cellulose, 0.20 g of initiator, polymerisation temperature at 70°C, 0.25 g of cross-linking agent, and 3.0 mL of monomer. The effect of the amount of initiator on hydrogel synthesis was the most obvious, followed by the reaction temperature, while the amount of monomer had the least influence.
(2) SEM analysis revealed that the hydrogel exhibited a clear three-dimensional double network cross-linked structure. XRD showed that the cellulose crystal type changed from cellulose I to cellulose II during the extraction process, and the hydrogel was amorphous.
(3) The results of the hydrogel swelling kinetic analysis showed that the hydrogel swelling process could be divided into three stages. The whole swelling process basically fitted the Schott secondary swelling kinetic model, which fitted well with the Fickian diffusion model in the first stage.
(4) The adsorption kinetic analysis of methylene blue on hydrogel showed that the adsorption process of hydrogel conformed to the pseudo-first-order kinetic model, pseudo-second-order kinetic model, Elovich model, and particle diffusion model. The best-fitting effect was achieved with the pseudo-second-order kinetic model.
(5) The adsorption isotherm analysis of methylene blue on hydrogel showed that the adsorption process was consistent with Langmuir and Freundlich models. The correlation of the Freundlich isotherm model was higher, indicating that the adsorption of methylene blue on hydrogel was mainly chemisorption.
Acknowledgement: The authors would like to thank the Analytical and Testing Center of the Henan University of Engineering, which provided the facilities for the experiments. The authors would also like to thank Yuqing Song for her help with language revision in the paper.
Funding Statement: This study was supported by the National Visiting Scholar Program for Key Young Teachers of Central and Western Universities, the Ministry of Education (19042), the Key Science and Technology Project of Henan Province (212102310064), and the National Innovation and Entrepreneurship Training Program for College Students, Ministry of Education (202111517002).
Conflicts of Interest: The authors declare that they have no conflicts of interest to report regarding the present study.
References
1. Rauf, F., Seyed, J. P., Saeed, H., Hamzeh, K., Bahman, R. (2021). Preparation of clinoptilolite/starch/CoFe2O4 magnetic nanocomposite powder and its elimination properties for cationic dyes from water and wastewater. International Journal of Biological Macromolecules, 189, 432–442. https://doi.org/10.1016/j.ijbiomac.2021.08.144 [Google Scholar] [PubMed] [CrossRef]
2. Foroutan, R., Peighambardoust, S. J., Boffito, D. C., Ramavandi, B. (2022). Sono-photocatalytic activity of cloisite 30B/ZnO/Ag2O nanocomposite for the simultaneous degradation of crystal violet and methylene blue dyes in aqueous media. Nanomaterials, 12(18), 3103. https://doi.org/10.3390/nano12183103 [Google Scholar] [PubMed] [CrossRef]
3. Foroutan, R., Peighambardoust, S. J., Aghdasinia, H., Mohammadi, R., Ramavandi, B. (2020). Modification of bio-hydroxyapatite generated from waste poultry bone with MgO for purifying methyl violet-laden liquids. Environment Science Pollution Research, 27, 44218–44229. https://doi.org/10.1007/s11356-020-10330-0 [Google Scholar] [PubMed] [CrossRef]
4. Zhai, S. M., Li, M., Peng, H. Y., Wang, D., Fu, S. H. (2021). Cost-effective resource utilization for waste biomass: A simple preparation method of photo-thermal biochar cakes (BCs) toward dye wastewater treatment with solar energy. Environmental Research, 194, 110720. https://doi.org/10.1016/j.envres.2021.110720 [Google Scholar] [PubMed] [CrossRef]
5. Rodrigo, O. A., Ana, P. B., Daisy, M. F., Gisela, A. U. (2006). Mutagenic and carcinogenic potential of a textile azo dye processing plant effluent that impacts a drinking water source. Mutation Research-Genetic Toxicology and Environmental Mutagenesis, 626(1), 53–60. [Google Scholar]
6. Mina, O., Mokhtar, A. A., Niyaz, M. M. (2018). MIL-Ti metal-organic frameworks (MOFs) nanomaterials as superior adsorbents: Synthesis and ultrasound-aided dye adsorption from multicomponent wastewater systems. Journal of Hazardous Materials, 347, 123–140. https://doi.org/10.1016/j.jhazmat.2017.12.057 [Google Scholar] [PubMed] [CrossRef]
7. Seyed, J. P., Daria, C. B., Rauf, F., Bahman, R. (2022). Sono-photocatalytic activity of sea sediment@400/ZnO catalyst to remove cationic dyes from wastewater. Journal of Molecular Liquids, 367, 120478. https://doi.org/10.1016/j.molliq.2022.120478 [Google Scholar] [CrossRef]
8. Amir, A., Rauf, F., Hossein, E., Seyed, J. P., Saeed, H. et al. (2022). Montmorillonite clay/starch/CoFe2O4 nanocomposite as a superior functional material for uptake of cationic dye molecules from water and wastewater. Materials Chemistry and Physics, 284, 126088. https://doi.org/10.1016/j.matchemphys.2022.126088 [Google Scholar] [CrossRef]
9. Nayak, S. S., Mirgane, N. A., Shivankar, V. S., Pathade, K. B., Wadhawa, G. C. (2021). Adsorption of methylene blue dye over activated charcoal from the fruit peel of plant hydnocarpus pentandra. Materials Today: Proceedings, 37, 2302–2305. [Google Scholar]
10. Crini, G. (2006). Non-conventional low-cost adsorbents for dye removal: A review. Bioresource Technology, 97(9), 1061–1085. https://doi.org/10.1016/j.biortech.2005.05.001 [Google Scholar] [PubMed] [CrossRef]
11. Jia, P., Tan, H., Liu, K., Gao, W. (2017). Adsorption behavior of methylene blue by bone char. International Journal of Modern Physics B, 31(16–19), 1744099. https://doi.org/10.1142/S0217979217440994 [Google Scholar] [CrossRef]
12. Pourjavadi, A., Tehrani, Z. M., Salami, H., Seidi, F., Shabanian, M. (2020). Both tough and soft double network hydrogel nanocomposite based on o-carboxymethyl chitosan/poly(vinyl alcohol) and graphene oxide: A promising alternative for tissue engineering. Polymer Engineering & Science, 60(5), 889–899. https://doi.org/10.1002/pen.25297 [Google Scholar] [CrossRef]
13. Yue, Y., Han, J., Han, G., French, A. D., Qi, Y. et al. (2016). Cellulose nanofibers reinforced sodium alginate-polyvinyl alcohol hydrogels: Core-shell structure formation and property characterization. Carbohydrate Polymers, 147, 155–164. https://doi.org/10.1016/j.carbpol.2016.04.005 [Google Scholar] [PubMed] [CrossRef]
14. Melo, B. C., Paulino, F. A., Cardoso, V. A., Pereira, A. G., Fajardo, A. R. et al. (2018). Cellulose nanowhiskers improve the methylene blue adsorption capacity of chitosan-g-poly(acrylic acid) hydrogel. Carbohydrate Polymers, 181, 358–367. https://doi.org/10.1016/j.carbpol.2017.10.079 [Google Scholar] [PubMed] [CrossRef]
15. Zhao, B., Jiang, H., Lin, Z., Xu, S., Xie, J. et al. (2019). Preparation of acrylamide/acrylic acid cellulose hydrogels for the adsorption of heavy metal ions. Carbohydrate Polymers, 224, 115022. https://doi.org/10.1016/j.carbpol.2019.115022 [Google Scholar] [PubMed] [CrossRef]
16. Wang, L. Y., Wang, M. J. (2016). Removal of heavy metal ions by poly(vinyl alcohol) and carboxymethyl cellulose composite hydrogels prepared by a freeze-thaw method. ACS Sustainable Chemistry & Engineering, 4(5), 2830–2837. https://doi.org/10.1021/acssuschemeng.6b00336 [Google Scholar] [CrossRef]
17. Bu, Y., Shen, H., Yang, F., Yang, Y., Wang, X. et al. (2017). Construction of tough, in situ forming double-network hydrogels with good biocompatibility. ACS Applied Materials & Interfaces, 9(3), 2205–2212. https://doi.org/10.1021/acsami.6b15364 [Google Scholar] [PubMed] [CrossRef]
18. Yang, Z., Yang, T., Yang, Y., Yi, X., Liao, C. J. (2021). The behavior and mechanism of the adsorption of Pb(II) and Cd(II) by a porous double network porous hydrogel derived from peanut shells. Materials Today Communications, 27(12), 102449. https://doi.org/10.1016/j.mtcomm.2021.102449 [Google Scholar] [CrossRef]
19. Wang, Y., Cui, C., Zhang, G., Xin, Y., Wang, S. (2021). Electrocatalytic hydrodechlorination of pentachlorophenol on Pd-supported magnetic biochar particle electrodes. Separation and Purification Technology, 258, 118017. https://doi.org/10.1016/j.seppur.2020.118017 [Google Scholar] [CrossRef]
20. Abdel-Halim, E. S. (2014). Chemical modification of cellulose extracted from sugarcane bagasse: Preparation of hydroxyethyl cellulose. Arabian Journal of Chemistry, 7(3), 362–371. https://doi.org/10.1016/j.arabjc.2013.05.006 [Google Scholar] [CrossRef]
21. Pourjavadi, A., Barzegar, S., Mahdavinia, G. R. (2006). MBA-crosslinked Na-Alg/CMC as a smart full-polysaccharide superabsorbent hydrogels. Carbohydrate Polymers, 66(3), 386–395. https://doi.org/10.1016/j.carbpol.2006.03.013 [Google Scholar] [CrossRef]
22. Zhou, T., Wang, Y., Huang, S., Zhao, Y. (2018). Synthesis composite hydrogels from inorganic-organic hybrids based on leftover rice for environment-friendly controlled-release urea fertilizers. Science of the Total Environment, 615, 422–430. https://doi.org/10.1016/j.scitotenv.2017.09.084 [Google Scholar] [PubMed] [CrossRef]
23. Leza, M. L., Casinos, I., Guzman, G. M. (1989). Graft copolymerization of 4-vinylpyridine onto cellulosics. Effect of temperature. European Polymer Journal, 25(12), 1193–1196. https://doi.org/10.1016/0014-3057(89)90080-3 [Google Scholar] [CrossRef]
24. Moad, G., Rizzardo, E., Thang, S. H. (2005). Living radical polymerization by the RAFT process. Australian Journal of Chemistry, 58(6), 379–410. https://doi.org/10.1071/CH05072 [Google Scholar] [CrossRef]
25. Wang, X., Zheng, Y., Zhang, C., Zong, L. (2020). Preparation and swelling properties of hydrolysis-resistant superabsorbent composite based on acrylic acid and sodium bentonite. International Journal of Polymer Analysis and Characterization, 25(5), 1–15. https://doi.org/10.1080/1023666X.2020.1783939 [Google Scholar] [CrossRef]
26. Namazi, H., Dadkhah, A. (2010). Convenient method for preparation of hydrophobically modified starch nanocrystals with using fatty acids. Carbohydrate Polymers, 79(3), 731–737. https://doi.org/10.1016/j.carbpol.2009.09.033 [Google Scholar] [CrossRef]
27. Ayyaz, A., Gu, X. G., Li, L., Lu, S. G., Xu, Y. S. et al. (2015). Effects of pH and anions on the generation of reactive oxygen species (ROS) in nZVI-rGO-activated persulfate system. Water, Air, & Soil Pollution, 226(11), 1–12. [Google Scholar]
28. Günter, E. A., Martynov, V. V., Belozerov, V. S., Martinson, E. A., Litvinets, S. G. (2020). Characterization and swelling properties of composite gel microparticles based on the pectin and κ-carrageenan. International Journal of Biological Macromolecules, 164, 2232–2239. https://doi.org/10.1016/j.ijbiomac.2020.08.024 [Google Scholar] [PubMed] [CrossRef]
29. Ebrahimi, R. (2018). The study of factors affecting the swelling of ultrasound-prepared hydrogel. Polymer Bulletin, 76(2), 1023–1039. https://doi.org/10.1007/s00289-018-2423-x [Google Scholar] [CrossRef]
30. Dai, H. J., Huang, Y., Huang, H. H. (2018). Eco-friendly polyvinyl alcohol/carboxymethyl cellulose hydrogels reinforced with graphene oxide and bentonite for enhanced adsorption of methylene blue. Carbohydrate Polymers, 185, 1–11. https://doi.org/10.1016/j.carbpol.2017.12.073 [Google Scholar] [PubMed] [CrossRef]
31. Ana, L., Daniel, S., Joana, M., Rodrigo, N., Ana, C. et al. (2012). Impact of magnetic nanofillers in the swelling and release properties of κ-carrageenan hydrogel nanocomposites. Carbohydrate Polymers, 87(1), 328–335. https://doi.org/10.1016/j.carbpol.2011.07.051 [Google Scholar] [PubMed] [CrossRef]
32. Dai, H. J., Huang, H. H. (2017). Synthesis, characterization and properties of pineapple peel cellulose-g-acrylic acid hydrogel loaded with kaolin and sepia ink. Cellulose, 24(1), 69–84. https://doi.org/10.1007/s10570-016-1101-0 [Google Scholar] [CrossRef]
33. Jin, E., Guo, J., Yang, F., Zhu, Y., Rojas, O. J. (2016). On the polymorphic and morphological changes of cellulose nanocrystals (CNC-I) upon mercerization and conversion to CNC-II. Carbohydrate Polymers, 143, 327–335. https://doi.org/10.1016/j.carbpol.2016.01.048 [Google Scholar] [PubMed] [CrossRef]
34. Bhattacharyya, R., Ray, S. K. (2013). Kinetic and equilibrium modeling for adsorption of textile dyes in aqueous solutions by carboxymethyl cellulose/poly(acrylamide-co-hydroxyethyl methacrylate) semi-interpenetrating network hydrogel. Polymer Engineering & Science, 53(11), 2439–2453. https://doi.org/10.1002/pen.23501 [Google Scholar] [CrossRef]
35. Yamane, C., Miyamoto, H., Hayakawa, D., Ueda, K. (2013). Folded-chain structure of cellulose II suggested by molecular dynamics simulation. Carbohydrate Research, 379, 30–37. https://doi.org/10.1016/j.carres.2013.06.012 [Google Scholar] [PubMed] [CrossRef]
36. Yang, F., Li, G., He, Y. G., Ren, F. X., Wang, G. X. (2009). Synthesis, characterization, and applied properties of carboxymethyl cellulose and polyacrylamide graft copolymer. Carbohydrate Polymers, 78(1), 95–99. https://doi.org/10.1016/j.carbpol.2009.04.004 [Google Scholar] [CrossRef]
37. Pérez-Marín, A. B., Zapata, V. M., Ortuno, J. F., Aguilar, M., Sáez, J. et al. (2007). Removal of cadmium from aqueous solutions by adsorption onto orange waste. Journal of Hazardous Materials, 139(1), 122–131. https://doi.org/10.1016/j.jhazmat.2006.06.008 [Google Scholar] [PubMed] [CrossRef]
38. Daoud, M., Benturki, O., Kecira, Z., Girods, P., Donnot, A. (2017). Removal of reactive dye (BEZAKTIV red S-MAX) from aqueous solution by adsorption onto activated carbons prepared from date palm rachis and jujube stones. Journal of Molecular Liquids, 243, 799–809. https://doi.org/10.1016/j.molliq.2017.08.093 [Google Scholar] [CrossRef]
39. Zhou, Y., Li, T., Shen, J., Meng, Y., Tong, S. et al. (2021). Core-shell structured magnetic carboxymethyl cellulose-based hydrogel nanosorbents for effective adsorption of methylene blue from aqueous solution. Polymers, 13(18), 3054. https://doi.org/10.3390/polym13183054 [Google Scholar] [PubMed] [CrossRef]
40. Djilani, C., Zaghdoudi, R., Modarressi, A., Rogalski, M., Djazi, F. et al. (2012). Elimination of organic micropollutants by adsorption on activated carbon prepared from agricultural waste. Chemical Engineering Journal, 189, 203–212. https://doi.org/10.1016/j.cej.2012.02.059 [Google Scholar] [CrossRef]
41. Zhang, X. Z., Sun, G. M., Da-Qing, W. U., Chu, C. C. (2004). Synthesis and characterization of partially biodegradable and thermosensitive hydrogel. Journal of Materials Science Materials in Medicine, 15(8), 865–875. https://doi.org/10.1023/B:JMSM.0000036274.83104.fe [Google Scholar] [PubMed] [CrossRef]
42. Wen, P., Wu, Z. S., He, Y. H. (2016). Microwave-assisted synthesis of a semi-IPN slow-release nitrogen fertilizer with water absorbency from cotton stalks. ACS Sustainable Chemistry & Engineering, 4(12), 6572–6579. https://doi.org/10.1021/acssuschemeng.6b01466 [Google Scholar] [CrossRef]
43. Siepmann, J., Kranz, H., Bodmeier, R., Peppas, N. A. (1999). HPMC-matrices for controlled drug delivery: A new model combining diffusion, swelling, and dissolution mechanisms and predicting the release kinetics. Pharmaceutical Research, 16(11), 1748–1756. https://doi.org/10.1023/A:1018914301328 [Google Scholar] [PubMed] [CrossRef]
44. Jayaramudu, T., Ko, H. U., Kim, H. C., Kim, J. W., Kim, J. (2019). Swelling behavior of polyacrylamide-cellulose nanocrystal hydrogels: Swelling kinetics, temperature, and pH effects. Materials, 12(13), 2080. https://doi.org/10.3390/ma12132080 [Google Scholar] [PubMed] [CrossRef]
45. Liu, Q. S., Zheng, T., Wang, P., Jiang, J. P., Li, N. (2010). Adsorption isotherm, kinetic and mechanism studies of some substituted phenols on activated carbon fibers. Chemical Engineering Journal, 157(2–3), 348–356. https://doi.org/10.1016/j.cej.2009.11.013 [Google Scholar] [CrossRef]
46. Kumar, P. S., Ramalingam, S., Senthamarai, C., Niranjanaa, M., Vijayalakshmi, P. et al. (2010). Adsorption of dye from aqueous solution by cashew nut shell: Studies on equilibrium isotherm, kinetics and thermodynamics of interactions. Desalination, 261(1–2), 52–60. https://doi.org/10.1016/j.desal.2010.05.032 [Google Scholar] [CrossRef]
47. Farid, M. M., Aaron, A. A., Alexander, N. K., Runping, H. (2020). Removal of methylene blue from aqueous medium by citrate modified bagasse: Kinetic, equilibrium and thermodynamic study. Bioresource Technology Reports, 11, 100463. https://doi.org/10.1016/j.biteb.2020.100463 [Google Scholar] [CrossRef]
48. Dai, H., Huang, Y., Zhang, Y., Zhang, H., Huang, H. (2019). Green and facile fabrication of pineapple peel cellulose/magnetic diatomite hydrogels in ionic liquid for methylene blue adsorption. Cellulose, 26(6), 3825–3844. https://doi.org/10.1007/s10570-019-02283-6 [Google Scholar] [CrossRef]
49. Li, Z., Li, M., Wang, Z., Liu, X. (2020). Coadsorption of Cu(II) and tylosin/sulfamethoxazole on biochar stabilized by nano-hydroxyapatite in aqueous environment. Chemical Engineering Journal, 381, 122785. https://doi.org/10.1016/j.cej.2019.122785 [Google Scholar] [CrossRef]
50. Gao, W., Zhao, S., Wu, H., Deligeer, W., Asuha, S. (2016). Direct acid activation of kaolinite and its effects on the adsorption of methylene blue. Applied Clay Science, 126, 98–106. https://doi.org/10.1016/j.clay.2016.03.006 [Google Scholar] [CrossRef]
Cite This Article
 Copyright © 2023 The Author(s). Published by Tech Science Press.
This work is licensed under a Creative Commons Attribution 4.0 International License , which permits unrestricted use, distribution, and reproduction in any medium, provided the original work is properly cited.
 Downloads
 Citation Tools