
 Submit a Paper
 Propose a Special lssue
 Open Access
ARTICLE
CENPF Promotes Gastric Cancer Proliferation through c-Myc-Mediated GLS1 Upregulation and Glutamine Metabolism
1 Department of Oncology, No. 960 Hospital of PLA, Jinan, China
2 Department of Oncology, Shanghai University Affiliated Mengchao Cancer Hospital, Shanghai, China
3 Department of Oncology, The Postgraduate Training Base of Jinzhou Medical University (No. 960 Hospital of PLA), Jinan, China
4 Department of Gastroenterology, Huzhou College Affiliated Nantaihu Hospital, Huzhou, China
* Corresponding Authors: Minxue Lu. Email: ; Chen Zhong. Email:
# These authors contributed equally to this work as the first author
(This article belongs to the Special Issue: Microenvironment, Microbiota and Immune System in Digestive Cancers)
Oncology Research 2026, 34(3), 22 https://doi.org/10.32604/or.2026.068508
Received 30 May 2025; Accepted 25 December 2025; Issue published 24 February 2026
 View Full Text
 Download PDF
Abstract
Background: Gastric cancer (GC) remains highly lethal, with metabolic reprogramming as a key hallmark. This study explores Centromere Protein F (CENPF)’s role in GC pathogenesis, specifically its regulation of glutamine metabolism. Methods: The Cancer Genome Atlas–Stomach Adenocarcinoma (TCGA-STAD), GSE19826, and GSE27342 datasets were analyzed by bioinformatics to identify key candidate genes in GC. The function of CENPF was assessed by flow cytometry, colony formation assays, and Cell Counting Kit-8 (CCK-8). RNA sequencing, metabolic profiling, chromatin immunoprecipitation (ChIP), western blot (WB), and luciferase reporter assay were employed to investigate the fundamental mechanisms. Results: CENPF was upregulated in GC tumor samples and had a high diagnostic potential. CENPF knockdown declined cell proliferation, caused G2 arrest, and promoted apoptosis in GC cells. RNA sequencing revealed that CENPF was involved in glutamine metabolism. CENPF overexpression enhanced glutamine consumption and glutamate production, while glutamine deficiency reversed CENPF-mediated cell survival. CENPF stabilized cellular myelocytomatosis (c-Myc) by preventing proteasomal degradation, bound to the glutaminase (GLS) promoter, promoting glutamine metabolism. Overexpression of GLS or c-Myc rescued the CENPF knockdown’s inhibitory effect on GC cell growth. Conclusion: Our findings identify a new CENPF/c-Myc/GLS axis that affects glutamine metabolism and cell survival in GC, implying that CENPF might be a novel target for the treatment of GC.Keywords
Gastric cancer (GC) is a widely occurring cancer on a global scale, with its incidence steadily increasing [1]. Studies have indicated that the global burden of GC is expected to increase by 62% by 2040 [2]. The primary etiological factor for GC is infection with helicobacter pylori [3]. Chronic infection with this bacterium can lead to a cascade of gastric disorders, which, if left untreated, may ultimately progress to GC. In addition, dietary habits, environmental factors, and genetic predispositions have also been shown to influence the onset and progression of this malignancy significantly. Currently, the most common treatment options for GC remain surgical resection, along with chemotherapy, radiation therapy, and targeted therapies [4]. Based on its increasing incidence and multifactorial etiology, it is important to create innovative diagnostic biomarkers, therapeutic strategies, and prognostic indicators for GC.
As research into cancer treatment has advanced, targeted therapies aimed at amino acid metabolism have surfaced as a viable new direction for GC therapy [5]. These metabolic alterations are integral to the capacity of tumor cells to adapt to their environment and support their rapid growth. Glutamine is involved in key physiological processes, such as cellular metabolism, immune system function, gut health, and the regulation of the nervous system [6,7]. Common forms of amino acid metabolism reprogramming include the reprogramming of glutamine metabolism, arginine metabolism, and tryptophan metabolism, among others [8]. Glutamine is the most abundant free amino acid in plasma and participates in a variety of metabolic reactions and serves as a carbon and nitrogen donor, including the biosynthesis of nucleotides and amino acids and the replenishment of the tricarboxylic acid (TCA) cycle. Cancer cells often show increased glutamine uptake and utilization, a phenomenon known as “glutamine addiction”. This metabolic dependence has been observed in a variety of malignant tumors. Li et al. developed a risk model based on the analysis of two GC-related datasets, incorporating glutamine metabolism-related genes MYB, LRFN4, LMNB2, and SLC1A5 [9,10]. This model showed a negative linkage with immune checkpoint inhibiting efficacy, revealing the function of glutamine metabolism in the progression of GC. Other studies have demonstrated that in HER2-positive GC, tumor cells encourage M2 macrophage polarization, glutamine metabolism, and angiogenesis by secreting GLS1-enriched microvesicles, which ultimately contribute to trastuzumab resistance [11]. Collectively, these findings highlight glutamine metabolism as a key mediator of tumor progression and therapeutic resistance in gastric cancer, underscoring its potential as a therapeutic intervention.
Centromere Protein F (CENPF) is an essential element within the G2 phase of the cell progression that encodes a protein linked to the centromere-centromere complex [12]. Numerous investigations have demonstrated that an increased level of CENPF is often correlated with poor prognosis in various cancers, suggesting its potential role in tumor proliferation, invasion, and metastasis. Research by Tan et al. identified that cyclin B1 (CCNB1), CENPF, and neutrophils play critical roles in diagnosing lung cancer, with high expression levels of both CCNB1 and CENPF linked to poor prognosis in lung cancer patients [13]. Additionally, studies have shown that heterogeneous nuclear ribonucleoprotein R (hnRNPR) can stabilize CCNB1 and CENPF mRNA expression, thereby facilitating gastric cancer progression [14]. In colon cancer cells, independent methods have confirmed changes in the phosphorylation of BET1, CENPF, and cofilin-1, as well as the significant impact of gal-4 treatment on cellular glutamine uptake [15]. In summary, these findings suggest that CENPF may serve as a key regulator of tumor progression and deserve further exploration in GC.
A vital variable in the progression of GC is metabolic reprogramming. Recent studies have highlighted its impact on cellular growth, survival, and therapeutic resistance [16]. Among the various metabolic pathways, glutamine metabolism has emerged as a key determinant of GC cell behavior [17]. Genes regulating amino acid metabolic pathways may shape the altered metabolic landscape in GC. However, the exact molecular mechanisms linking CENPF to glutamine metabolism and GC progression are not yet fully understood. In this study, we aimed to examine the role of CENPF in regulating glutamine metabolism. We also investigated its influence on GC cell proliferation, apoptosis, and overall tumor growth. By elucidating the interaction between CENPF, cellular myelocytomatosis (c-Myc), and glutamine metabolism, we seek to identify novel therapeutic targets. This work also provides insights into metabolic reprogramming in GC, with potential implications for the development of more effective treatments.
2.1 Data Collection and Analysis
We first obtained 375 Stomach adenocarcinoma (STAD) samples and 32 adjacent normal samples from the Cancer Genome Atlas (TCGA) database (https://www.cancer.gov/ccg/research/genome-sequencing/tcga) through the ASSISTANT for Clinical Bioinformatics website (https://www.aclbi.com/static/index.html#/) for this investigation. Additionally, we retrieved two relevant datasets, GSE19826 and GSE27342, from the Gene Expression Omnibus (GEO) database (https://www.ncbi.nlm.nih.gov/gds/). The GSE19826 dataset comprises 15 normal tissue samples and 12 GC tissue samples, while the GSE27342 dataset includes 80 GC tissue samples and 80 normal tissue samples.
2.2 Differential Expression Analysis
Differential gene expression analysis was conducted by the “Limma” package in R software (version 3.6.3). Genes in GC-related datasets (TCGA-GC, GSE19826, GSE27342) were selected based on fold change (FC) thresholds, with genes exhibiting FC > 2 considered upregulated, FC < 0.5 as downregulated, and the criterion for statistical significance is a p < 0.05. This approach enabled the detection of differentially expressed genes (DEGs) linked to GC progression. To visualize the results, volcano plots were generated for each dataset, with upregulated and downregulated genes highlighted in different colors.
2.3 Topological and Protein-Protein Interaction (PPI) Network Analysis
To analyze the relationship between DEGs across datasets, the Venn online graph tool (https://bioinformatics.psb.ugent.be/webtools/Venn/) was used to perform topological analysis on all upregulated and downregulated DEGs from the TCGA-STAD, GSE19826, and GSE27342 datasets, resulting in the identification of overlapping DEGs. The protein-protein interaction (PPI) network of overlapping DEGs was established by the Search Tool for the Retrieval of Interacting Genes (STRING, https://string-db.org/) and visualized using Cytoscape software (version 3.9.0). The Molecular Complex Detection (MCODE) and Maximum Clique Centrality (MCC) algorithms of the Cytohubba plugin were then used to recognize key genes with high centrality in the network. Intersection analysis of gene sets from MCODE and MCC was then performed to identify overlapping genes.
2.4 Gene Expression and Prognostic Analysis
Gene expression analysis of candidate genes in normal and tumor samples was conducted using the ASSISTANT for Clinical Bioinformatics platform (https://www.aclbi.com/static/index.html#/). Expression data from the TCGA-STAD dataset were visualized to compare gene expression between tumor and normal groups. Additionally, data processing and boxplot visualizations for the GSE19826 and GSE27342 datasets were analyzed using the Sangerbox platform (version 3.0, http://vip.sangerbox.com/home.html). In addition, the “pROC” program in R software (version 1.17.0.1) was implemented to analyze receiver operating characteristic (ROC) curves in order to assess the diagnostic value of candidate genes. The area under the curve (AUC) value of each gene was calculated in the GSE19826 and GSE27342 datasets. The sensitivity was plotted against 1-specificity, and the diagnostic accuracy of each gene was measured by the AUC value.
2.5 Cell Lines and Culture Conditions
Normal gastric epithelial cells (GES-1) and GC cell lines, such as HGC27, AGS, MKN45, MKN28, and SNU1, were obtained from Biovector (Biovector NTCC Cell Culture Collection, Inc., Beijing, China). All cell lines were authenticated by STR profiling, except for the MKN28 cell line, which has been reported as a derivative of MKN74 [18]. All cell lines tested negative for mycoplasma contamination (Fig. A1A). Cells were maintained in RPMI-1640 medium (Gibco, New York, NY, USA) supplemented with 10% fetal bovine serum (FBS, Thermo Fisher Scientific, Waltham, MA, USA) and 1% penicillin-streptomycin (Beyotime, Shanghai, China) solution. For glutamine deprivation experiments, MKN45 cells were cultivated in glutamine-free RPMI-1640 medium supplemented with 1% penicillin/streptomycin, 10% FBS, and 0 mM glutamine (Gln, MedChemExpress, Monmouth Junction, NJ, USA) for 24 h before treatment. The control group was cultured in standard RPMI-1640 medium (containing 2 mM glutamine). The cells were cultured in a humidified atmosphere containing 5% CO2 at 37°C. Cells were passaged when they reached 80% confluence, and the medium was replaced every two to three days.
AGS and MKN45 cells were planted in 6-well plates and cultivated until they reached 60%–70% confluence in order to perform gene knockdown and overexpression assays. GenePharma (Shanghai, China) produced small interfering RNAs (siRNAs) that target GLS (si-GLS) and CENPF (si-CENPF-1 and si-CENPF-2) as well as a negative control siRNA (si-NC). The pcDNA3.1 vector was used to create the CENPF overexpression plasmid (over-CENPF), the c-Myc overexpression plasmid (over-c-Myc), the GLS overexpression plasmid (over-GLS), and their matching empty vector controls (Vector). Following the manufacturer’s guidelines, cell transfection was carried out by the Lipofectamine 3000 reagent (Invitrogen, Carlsbad, CA, USA). Cells were taken for further testing 48 h after transfection.
In GLS inhibition tests, cells were treated with the GLS inhibitor CB-839 (10 μM) (MedChemExpress, Monmouth Junction, NJ, USA), which blocks glutamine metabolism in cancer cells, or an equivalent amount of DMSO (vehicle control) for 24 h. To investigate the regulatory mechanism of CENPF on c-Myc, MKN45 cells were treated differently. First, MKN45 cells transfected with si-NC or si-CENPF-1 were treated with MG132 (10 μM) (MedChemExpress, Monmouth Junction, NJ, USA), a specific proteasome inhibitor, for 6 h to examine protein degradation via the proteasome pathway, and second, to assess the stability of c-Myc protein, cycloheximide (CHX) chase assays were performed. After transfection with control vector or CENPF overexpression plasmid or si-NC or si-CENPF-1, cells were treated with CHX (100 μg/mL) (MedChemExpress, Monmouth Junction, NJ, USA) to inhibit protein synthesis. Cells were harvested at 0, 0.5, 1, 2, and 3 h after CHX treatment and subsequently subjected to protein analysis.
2.8 Reverse Transcription Quantitative Polymerase Chain Reaction (RT-qPCR)
Total RNA was isolated from cells (GES-1, HGC27, AGS, MKN45, MKN28, and SNU1) utilizing TRIzol reagent (Tiangen, Beijing, China) following the manufacturer’s procedure. RNA concentrations were quantified utilizing a NanoDrop 2000 spectrophotometer (Thermo Scientific, Waltham, MA, USA). Complementary DNA (cDNA) was synthesized by the PrimeScript RT Reagent Kit (RR047A, Takara, Kameoka, Japan). SYBR Green PCR Master Mix (RR066A, Takara, Kameoka, Japan) was employed for the RT-qPCR with an ABI 7500 Real-Time PCR System (Applied Biosystems, Foster City, CA, USA). The 2−ΔΔCT technique was applied to determine the relative gene expression, with GAPDH serving as the internal reference [19]. The primers of RT-qPCR were as follows: CENPF (forward 5′-AAGCCTCTGTGCCGTTGAAT-3′ and reverse 5′-CAGTGAAACCACCAGCAGGA-3′), c-Myc (forward 5′-GGCAATGCGTTGCTGGGTTA-3′ and reverse 5′-TGATCAAGAGTCCCAGGGAGA-3′), GLS (forward 5′-GCTCTTAAGGCCGCCCG-3′ and reverse 5′-GATCTCCGAGGGCGAACTG-3′). GAPDH functioned as the internal control, with the primer sequences as follows: forward 5′-GGGTCCCAGCTTAGGTTCAT-3′ and reverse 5′-TGAGGTCAATGAAGGGGTCG-3′.
2.9 Western Blot (WB) Analysis
Cells (GES-1, HGC27, AGS, MKN45, MKN28, and SNU1) were lysed in RIPA buffer (Beyotime, China) containing protease inhibitors (Thermo Fisher Scientific, Waltham, MA, USA) for protein extraction. A BCA Protein Assay Kit (P0012, Beyotime, Shanghai, China) was applied to measure the protein concentration. SDS-PAGE was implemented to separate equal quantities of protein (30 μg), which were then transferred onto PVDF membranes (Beyotime, Shanghai, China). After blocking the membranes for an hour at room temperature with 5% non-fat milk in TBS-T, then incubated at 4°C overnight with primary antibodies against CENPF (1:1500, ab5, Abcam, Cambridge, UK), c-Myc (1:5000, Cat. No.: 67447-1-Ig, Proteintech, Wuhan, China), CDK1 (1:1000, ab265590, Abcam, Cambridge, UK), GLS (1:5000, Cat. No.: 66265-2-Ig, Proteintech, Wuhan, China), and GAPDH (1:10000, ab181602, Abcam, Cambridge, UK). The membranes were treated with HRP-conjugated secondary antibodies (goat anti-rabbit, 1:10,000, ab6721, Abcam, Cambridge, UK; goat anti-mouse, 1:10,000, ab6728, Abcam, Cambridge, UK) for one hour at room temperature following TBS-T washing. All antibodies used in this study, except for those targeting c-Myc and GLS, were purchased from Abcam (Cambridge, UK). The c-Myc and GLS antibodies were procured from Wuhan Sanying Biotechnology (Wuhan, China). Protein bands were identified using Enhanced Chemiluminescence (ECL) Western blotting Substrate (P0018AS, Beyotime, Shanghai, China) and presented with ImageJ software (version 1.8.0, National Institutes of Health, Bethesda, MD, USA).
In order to evaluate cell apoptosis and cell cycle distribution in AGS and MKN45 cells, flow cytometry analysis was performed in this study. Initially, MKN45 and AGS cells were cultivated for 24 h after being planted at a density of 1 × 10⁴ cells per well in 24-well plates. Following dissociation with 0.25% trypsin-EDTA and washing with 1 × Phosphate-buffered saline (PBS, pH 7.4), cells were cultured with 5 μL Annexin V-FITC solution and 5 μL of propidium iodide (PI) for 15 min at room temperature for apoptosis analysis. Subsequently, a BD FACSCalibur flow cytometer (Becton, Dickinson and Company, Franklin Lakes, NJ, USA) was used to assess the staining of PI and Annexin V, and FlowJo software (version 10.6.0, FlowJo software, Ashland, OR, USA) was used to analyze the results. For cell cycle analysis, MKN45 and AGS cells were fixed for the whole night at 4°C in 75% ice-cold ethanol. After washing with PBS, cells were treated for 30 min at 37°C in the dark with 50 μg/mL PI containing 10 mg/L RNase A. A BD FACSCalibur flow cytometer (Becton, Dickinson and Company, Franklin Lakes, NJ, USA) was utilized to assess the cell cycle distribution, and FlowJo software (version 10.6.0, FlowJo software, Ashland, OR, USA) was applied to analyze the information.
2.11 Cell Counting Kit-8 (CCK-8) Assay
The Cell Counting Kit-8 (CCK-8) assay (CK04, Dojindo, Kumamoto, Japan) was applied to evaluate cell proliferation. For time-course experiments, cells (MKN45 and AGS) were seeded at a density of 1 × 10³ cells/well in 96-well plates and cultured for 1, 2, 3, and 4 days. At each time point, 10 μL of CCK-8 solution was added to each well, and cells were incubated for 1 h at 37°C. For endpoint viability assays, cells were cultured for 24 h after different treatments before adding CCK-8 solution. Absorbance at 450 nm was measured using a microplate reader (Multiskan GO, Thermo Fisher Scientific, Waltham, MA, USA).
Colony formation was measured using the plate colony formation assay. Briefly, 200 cells (MKN45 and AGS) from each group were cultivated for 10 days in DMEM with 10% FBS after being planted into each well of a 6-well plate. After incubation, cells were washed with 1× PBS (pH 7.4) and fixed with 0.1% alkaline nitroblue tetrazolium chloride. Colony images were captured, and colonies were counted under a microscope (Model AE31, Motic, Xiamen, China).
2.13 RNA Sequencing and Differential Expression Analysis of MKN45 Cells Transfected with si-CENPF-1
After transfecting MKN45 cells with si-NC or si-CENPF-1, cells were incubated for 24 h, followed by RNA extraction. To ensure reproducibility, three biological replicates of each treatment group were conducted. Following the manufacturer’s instructions, TRIzol reagent (Tiangen, Beijing, China) has been utilized to isolate RNA. An Agilent 2100 Bioanalyzer (Agilent, Shanghai, China) was applied to evaluate the RNA’s integrity, with RNA integrity number (RIN) > 8.0 confirmed for all samples; a NanoDrop 2000 spectrophotometer (Thermo Scientific, Waltham, MA, USA) was performed to determine the RNA’s concentration and purity. The VAHTS Universal V6 RNA-seq Library Prep Kit (Vazyme, Nanjing, China) produced RNA sequencing libraries according to the manufacturer’s guidelines. Sequencing was implemented on the Illumina NovaSeq 6000 platform (Illumina, Inc., San Diego, California, USA), providing high-throughput and high-quality data with a genome mapping rate > 95% for all samples. Shanghai Meiji Biopharmaceutical Technology Co., Ltd., conducted all library preparation and sequencing procedures.
2.14 Related Bioinformatics Analysis of Sequencing Data
Genes in the sequencing data were screened according to the FC threshold (greater than 2 for up-regulation and less than 0.5 for down-regulation), and the statistical significance standard was p < 0.05. DEGs identified from sequencing data were subjected to Gene Ontology (GO) and Kyoto encyclopedia of genes and genomes (KEGG) pathway analysis utilizing the Database for Annotation, Visualization, and Integrated Discovery (DAVID) platform (https://davidbioinformatics.nih.gov/summary.jsp). Gene Set Enrichment Analysis (GSEA) was conducted for the candidate gene CENPF by the Sangerbox platform (http://vip.sangerbox.com/home.html) to identify enriched signaling pathways. Subsequently, to explore the interaction relationship between CENPF, MYC, and GLS, we constructed a gene interaction network using the Search Tool for the Retrieval of Interacting Genes database (STRING: https://string-db.org/). In addition, the correlation between CENPF and c-Myc was also detected. Correlation analysis was performed using the “ggstatsplot” package (version 0.9.5) (https://CRAN.R-project.org/package=ggstatsplot) to evaluate the correlation between non-normally distributed quantitative variables.
2.15 Chromatin Immunoprecipitation (ChIP)
ChIP studies were conducted on MKN45 and AGS cell line samples by the Millipore EZ ChIP™ Chromatin Immunoprecipitation Kit (26156, Thermo Fisher Scientific, Waltham, MA, USA), in accordance with the manufacturer’s instructions. Cross-linked chromatin DNA was, in short, sonicated into segments of 200–500 bp. Primary antibodies (anti-c-Myc, ab32072, Abcam, Cambridge, UK) were used at a dilution of 1:100, and normal IgG were used to immunoprecipitate the fragments. Protein G agarose beads were used to collect, clean, and rinse the DNA-protein complexes, and the cross-links were reversed. The enrichment of c-Myc at the GLS site (containing the CACGTG motif) was quantified by RT-qPCR utilizing SYBR Green PCR Master Mix (Takara, Kameoka, Japan). Results were calculated as fold enrichment relative to IgG control.
2.16 Luciferase Reporter Assay
The predicted GLS promoter region was amplified and cloned into the pGL3-Basic luciferase reporter vector (Promega, Madison, WI, USA). The wild-type (GLS WT) or mutated (GLS MUT) luciferase reporter vectors, along with siRNA for CENPF-1 (si-CENPF-1), empty vector, or overexpression plasmid for c-Myc (over-c-Myc), were co-transfected into MKN45 and AGS cells by Lipofectamine 2000 (Invitrogen, Carlsbad, CA, USA). The Luciferase Assay Kit (Promega, Madison, WI, USA) was employed to lyse the cells after 48 h, and a Luminometer (Berthold Lumat LB 9507, Berthold Technologies, Germany) was applied to assess the luciferase activity. The results were normalized to control groups and presented as relative luciferase activity.
2.17 Measuring Glutamine Consumption, Glutamate Production, and α-Ketoglutarate (α-KG) Levels in GC Cells
The Glutamine Assay Kit, Glutamate Assay Kit, and α-Ketoglutarate Assay Kit were applied in accordance with the manufacturer’s instructions to assess glutamine intake, glutamate production, and α-ketoglutarate levels. The Glutamine Assay Kit (colorimetric method) and Glutamate Assay Kit (colorimetric method) were obtained from Beijing Baiaolaibo Technology Co., Ltd., while the α-Ketoglutarate Assay Kit was obtained from Abnova (Shanghai, China). Briefly, MKN45 and AGS cells were cultured 2 × 10⁵ cells per well in 6-well plates, and the culture medium was collected for analysis. The concentrations of glutamine, glutamate, and α-ketoglutarate were determined by employing a Microplate Reader (Thermo Fisher Scientific, Shanghai, China) to measure absorbance at 570 nm.
To ensure the robustness of our metabolic assays to batch effects, several measures were taken. The assays were conducted in a controlled environment with standardized protocols to minimize variability. Additionally, internal standards and controls were included in each batch to monitor and adjust for any potential batch effects. The data from the metabolic assays were analyzed using appropriate statistical methods, and the results were validated through multiple independent experiments.
2.18 Relative Antioxidant Capacity Detection of GC Cells
The ratio of glutathione (GSH)/glutathione disulfide (GSSG) in GC cells was measured using the GSH/GSSG Assay Kit (Beyotime, Shanghai, China) according to the manufacturer’s instructions. The cells (MKN45 and AGS) were collected and lysed in the protein removal buffer M provided in the kit. Cell lysis was achieved by three freeze-thaw cycles with liquid nitrogen and 37°C water. The lysate was centrifuged at 12,000 rpm for 15 min at 4°C, and the collected supernatant was used for GSH and GSSG detection.
All experimental data are presented as the mean ± standard deviation (SD) from at least three independent biological replicates. Statistical analysis was performed utilizing the R programming language (version 4.3.1). For comparisons between two groups, an unpaired two-tailed Student’s t-test was used. For comparisons among more than two groups, one-way analysis of variance (ANOVA) followed by Tukey’s multiple comparison test was applied. When two or more factors were involved, two-way ANOVA with appropriate post-hoc testing was used to evaluate interaction effects. The Shapiro–Wilk test was performed to verify data normality, and Levene’s test was applied to assess homogeneity of variance. Nonparametric tests (e.g., Mann–Whitney U test or Kruskal–Wallis test) were used when assumptions of normality or equal variance were not met. Statistical significance was defined as a p < 0.05.
3.1 Differential Expression and Protein-Protein Interaction (PPI) Network Analyses Reveal Key Candidate Genes in GC
To clarify the molecular mechanisms underlying GC, differential expression analysis was performed across multiple datasets. In the TCGA-STAD dataset, 2532 upregulated and 419 downregulated DEGs were detected (Fig. 1A). Analysis of the GSE19826 dataset revealed 424 upregulated and 881 downregulated DEGs, while the GSE27342 dataset identified 456 upregulated and 269 downregulated DEGs (Fig. 1B,C). Topological analysis of DEGs across these datasets revealed 122 overlapping upregulated DEGs and 70 overlapping downregulated DEGs (Fig. 1D,E). PPI networks were constructed using the MECODE and MCC algorithms to investigate interactions among the overlapping DEGs further. The MECODE algorithm yielded a network comprising 18 nodes and 149 edges, while the MCC algorithm identified a network with 10 nodes and 45 edges (Fig. 1F,G). Integration of these PPI networks and subsequent topological analysis led to the identification of 10 highly associated candidate genes (Fig. 1H).
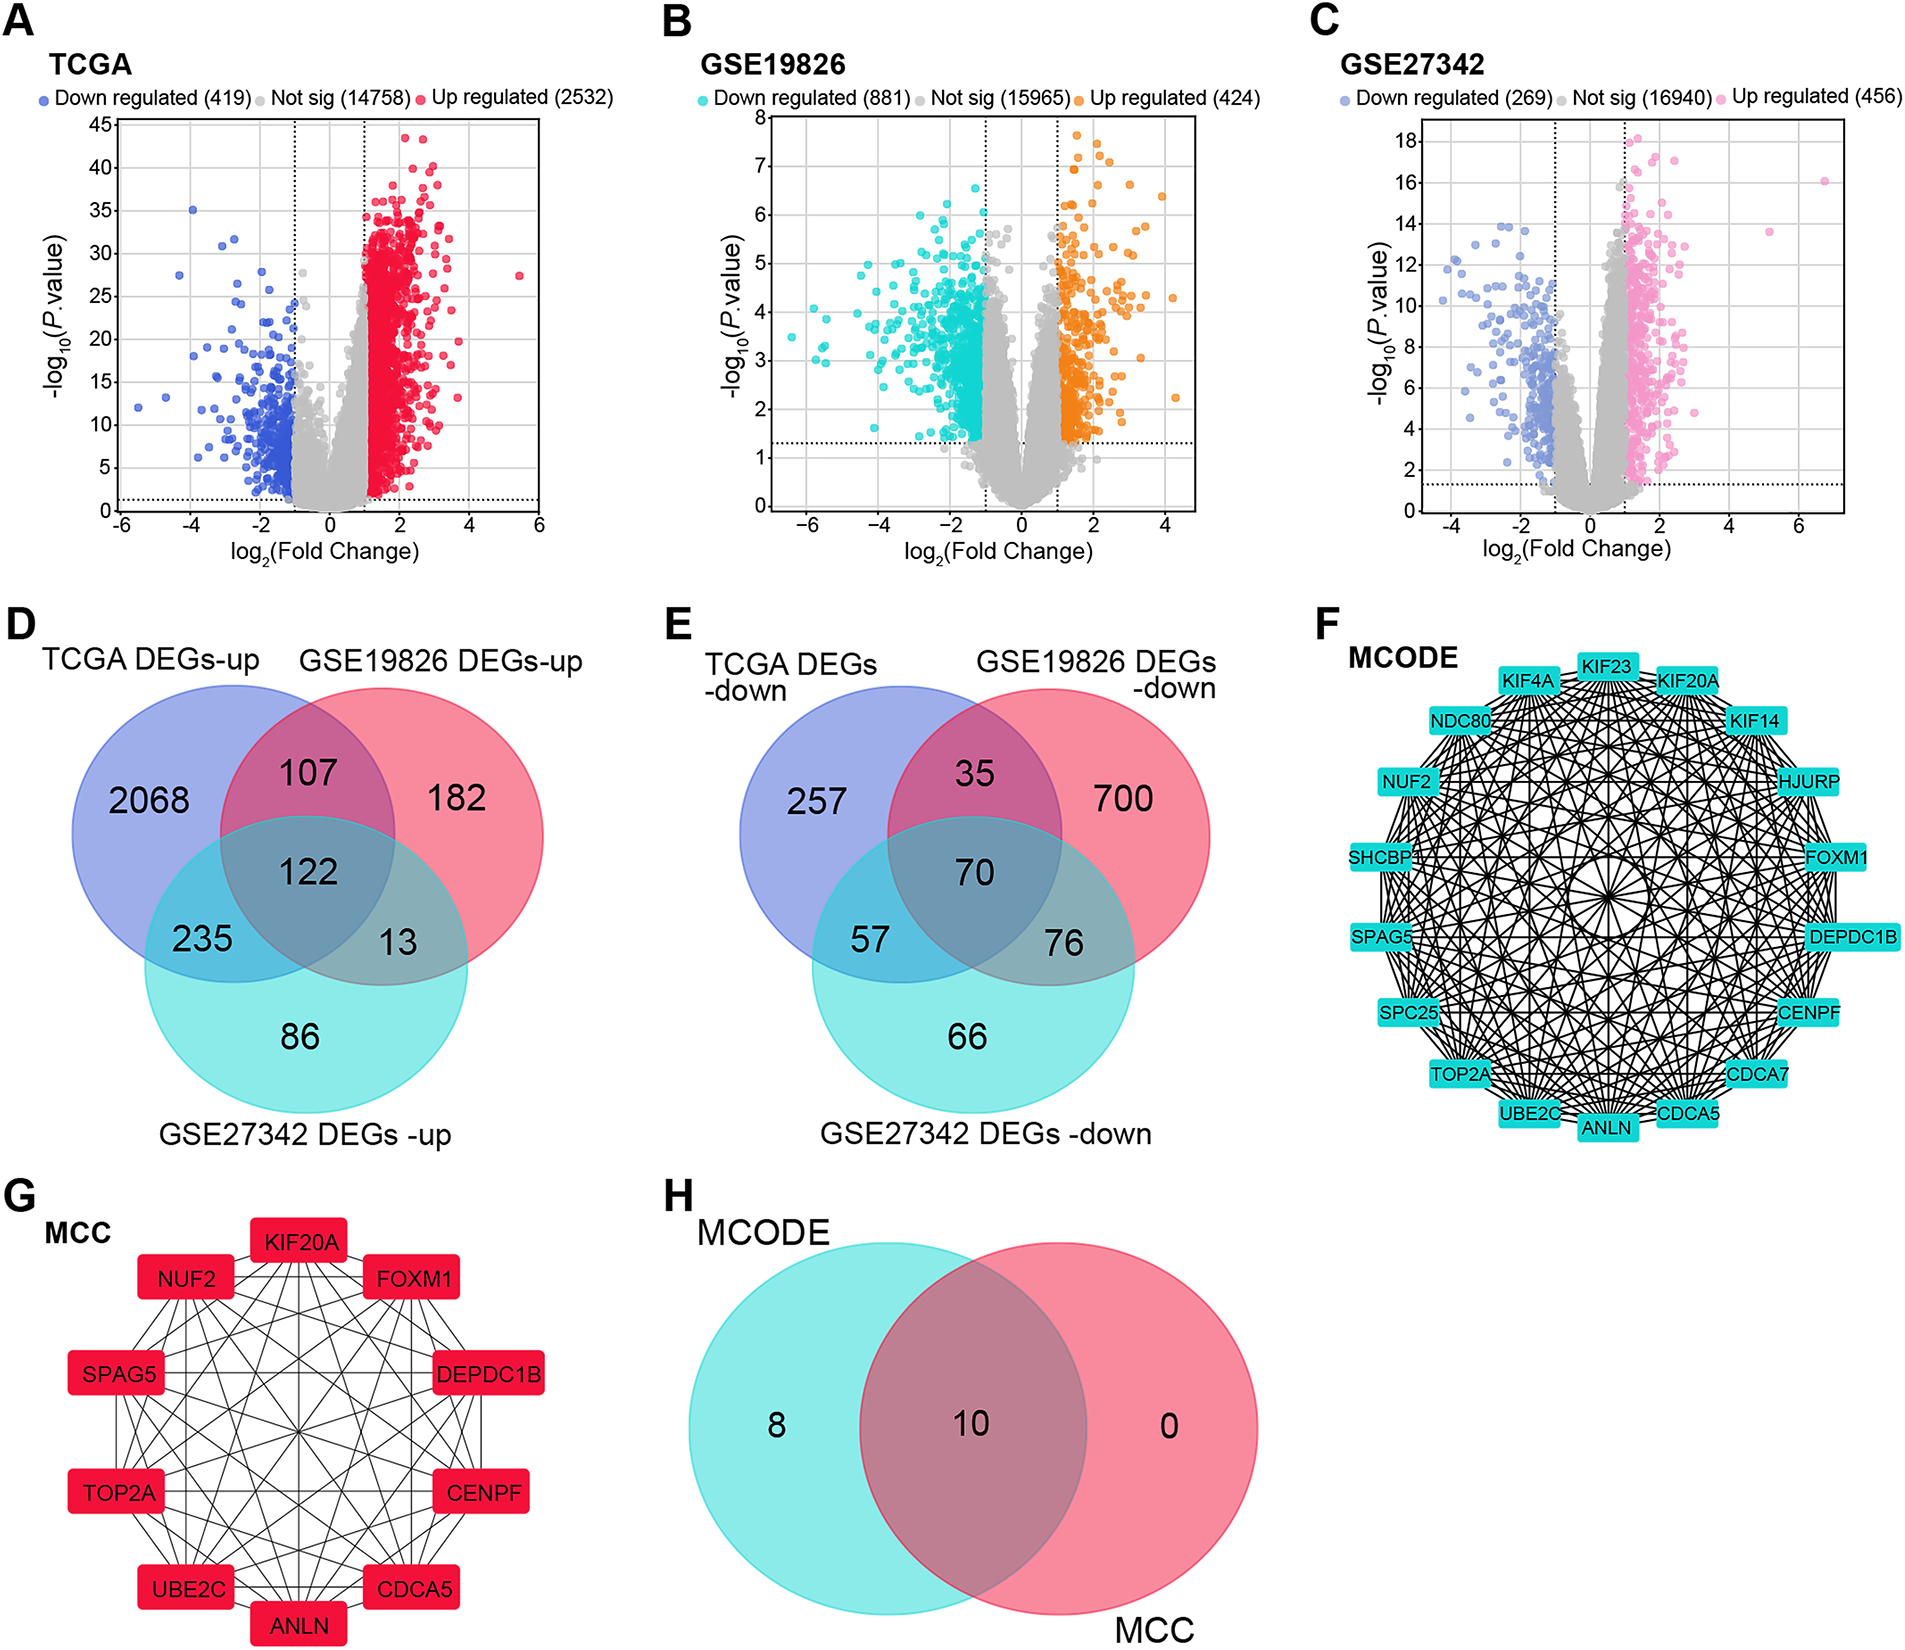
Figure 1: DEG analysis and PPI network construction across multiple datasets. (A) Volcano plot depicting the DEGs in the TCGA-STAD dataset, with upregulated genes shown in red and downregulated genes in dark blue. (B) Volcano plot illustrating the DEGs in the GSE19826 dataset, with upregulated genes in orange and downregulated genes in green. (C) Volcano plot representing the DEGs in the GSE27342 dataset, with upregulated genes in pink and downregulated genes in light blue. (D) Venn diagram showing the overlapping upregulated DEGs across the TCGA-STAD, GSE19826, and GSE27342 datasets. (E) Venn diagram displaying the overlapping downregulated DEGs across the TCGA-STAD, GSE19826, and GSE27342 datasets. (F) PPI network constructed for the overlapping DEGs using the MECODE algorithm. The network includes 18 nodes and 149 edges, where each node represents a protein and each edge represents a predicted protein-protein interaction. (G) Identification of the top 10 interacting genes from the PPI network of overlapping DEGs based on the MCC algorithm, with 10 nodes and 45 edges. (H) Venn diagram showing the overlapping genes between the MECODE and MCC algorithm networks. DEG: differentially expressed gene; TCGA-STAD: the cancer genome atlas—stomach adenocarcinoma; PPI: protein-protein interaction; MCODE: molecular complex detection; MCC: maximal clique centrality
3.2 Expression Analysis and Predictive Performance Evaluation of Candidate Genes Identify CENPF as the Hub Gene
Expression levels of the ten candidate genes (ANLN, CDCA5, CENPF, DEPDC1B, FOXM1, KIF20A, NUF2, SPAG5, TOP2A, UBE2C) were analyzed across tumor and normal tissues in the TCGA-STAD, GSE19826, and GSE27342 datasets. All ten genes were markedly elevated in tumor tissues vs. normal tissue (Fig. 2A–C). In the GSE19826 dataset, CENPF (AUC = 0.839) and SPAG5 (AUC = 0.844) demonstrated high predictive accuracy (Fig. 2D), while in the GSE27342 dataset, CENPF (AUC = 0.823) and SPAG5 (AUC = 0.827) also exhibited strong performance (Fig. 2E). While FOXM1, SPAG5, and NUF2 all showed upregulation in GC tissues, CENPF exhibited more stable diagnostic performance across these independent datasets: its AUC values were comparable to SPAG5 in both GSE19826 and GSE27342, but outperformed FOXM1 (GSE19826: 0.772; GSE27342: 0.807) and NUF2 (GSE19826: 0.800; GSE27342: 0.823) in cross-dataset reproducibility—supporting its potential as a more robust GC-related marker. Since the relevant mechanism of SPAG5 in cancer metabolic reprogramming is still unclear, and CENPF has been shown to be a gene related to cancer metabolic reprogramming in some existing studies [20], this study selected CENPF as a hub gene for further research on GC.
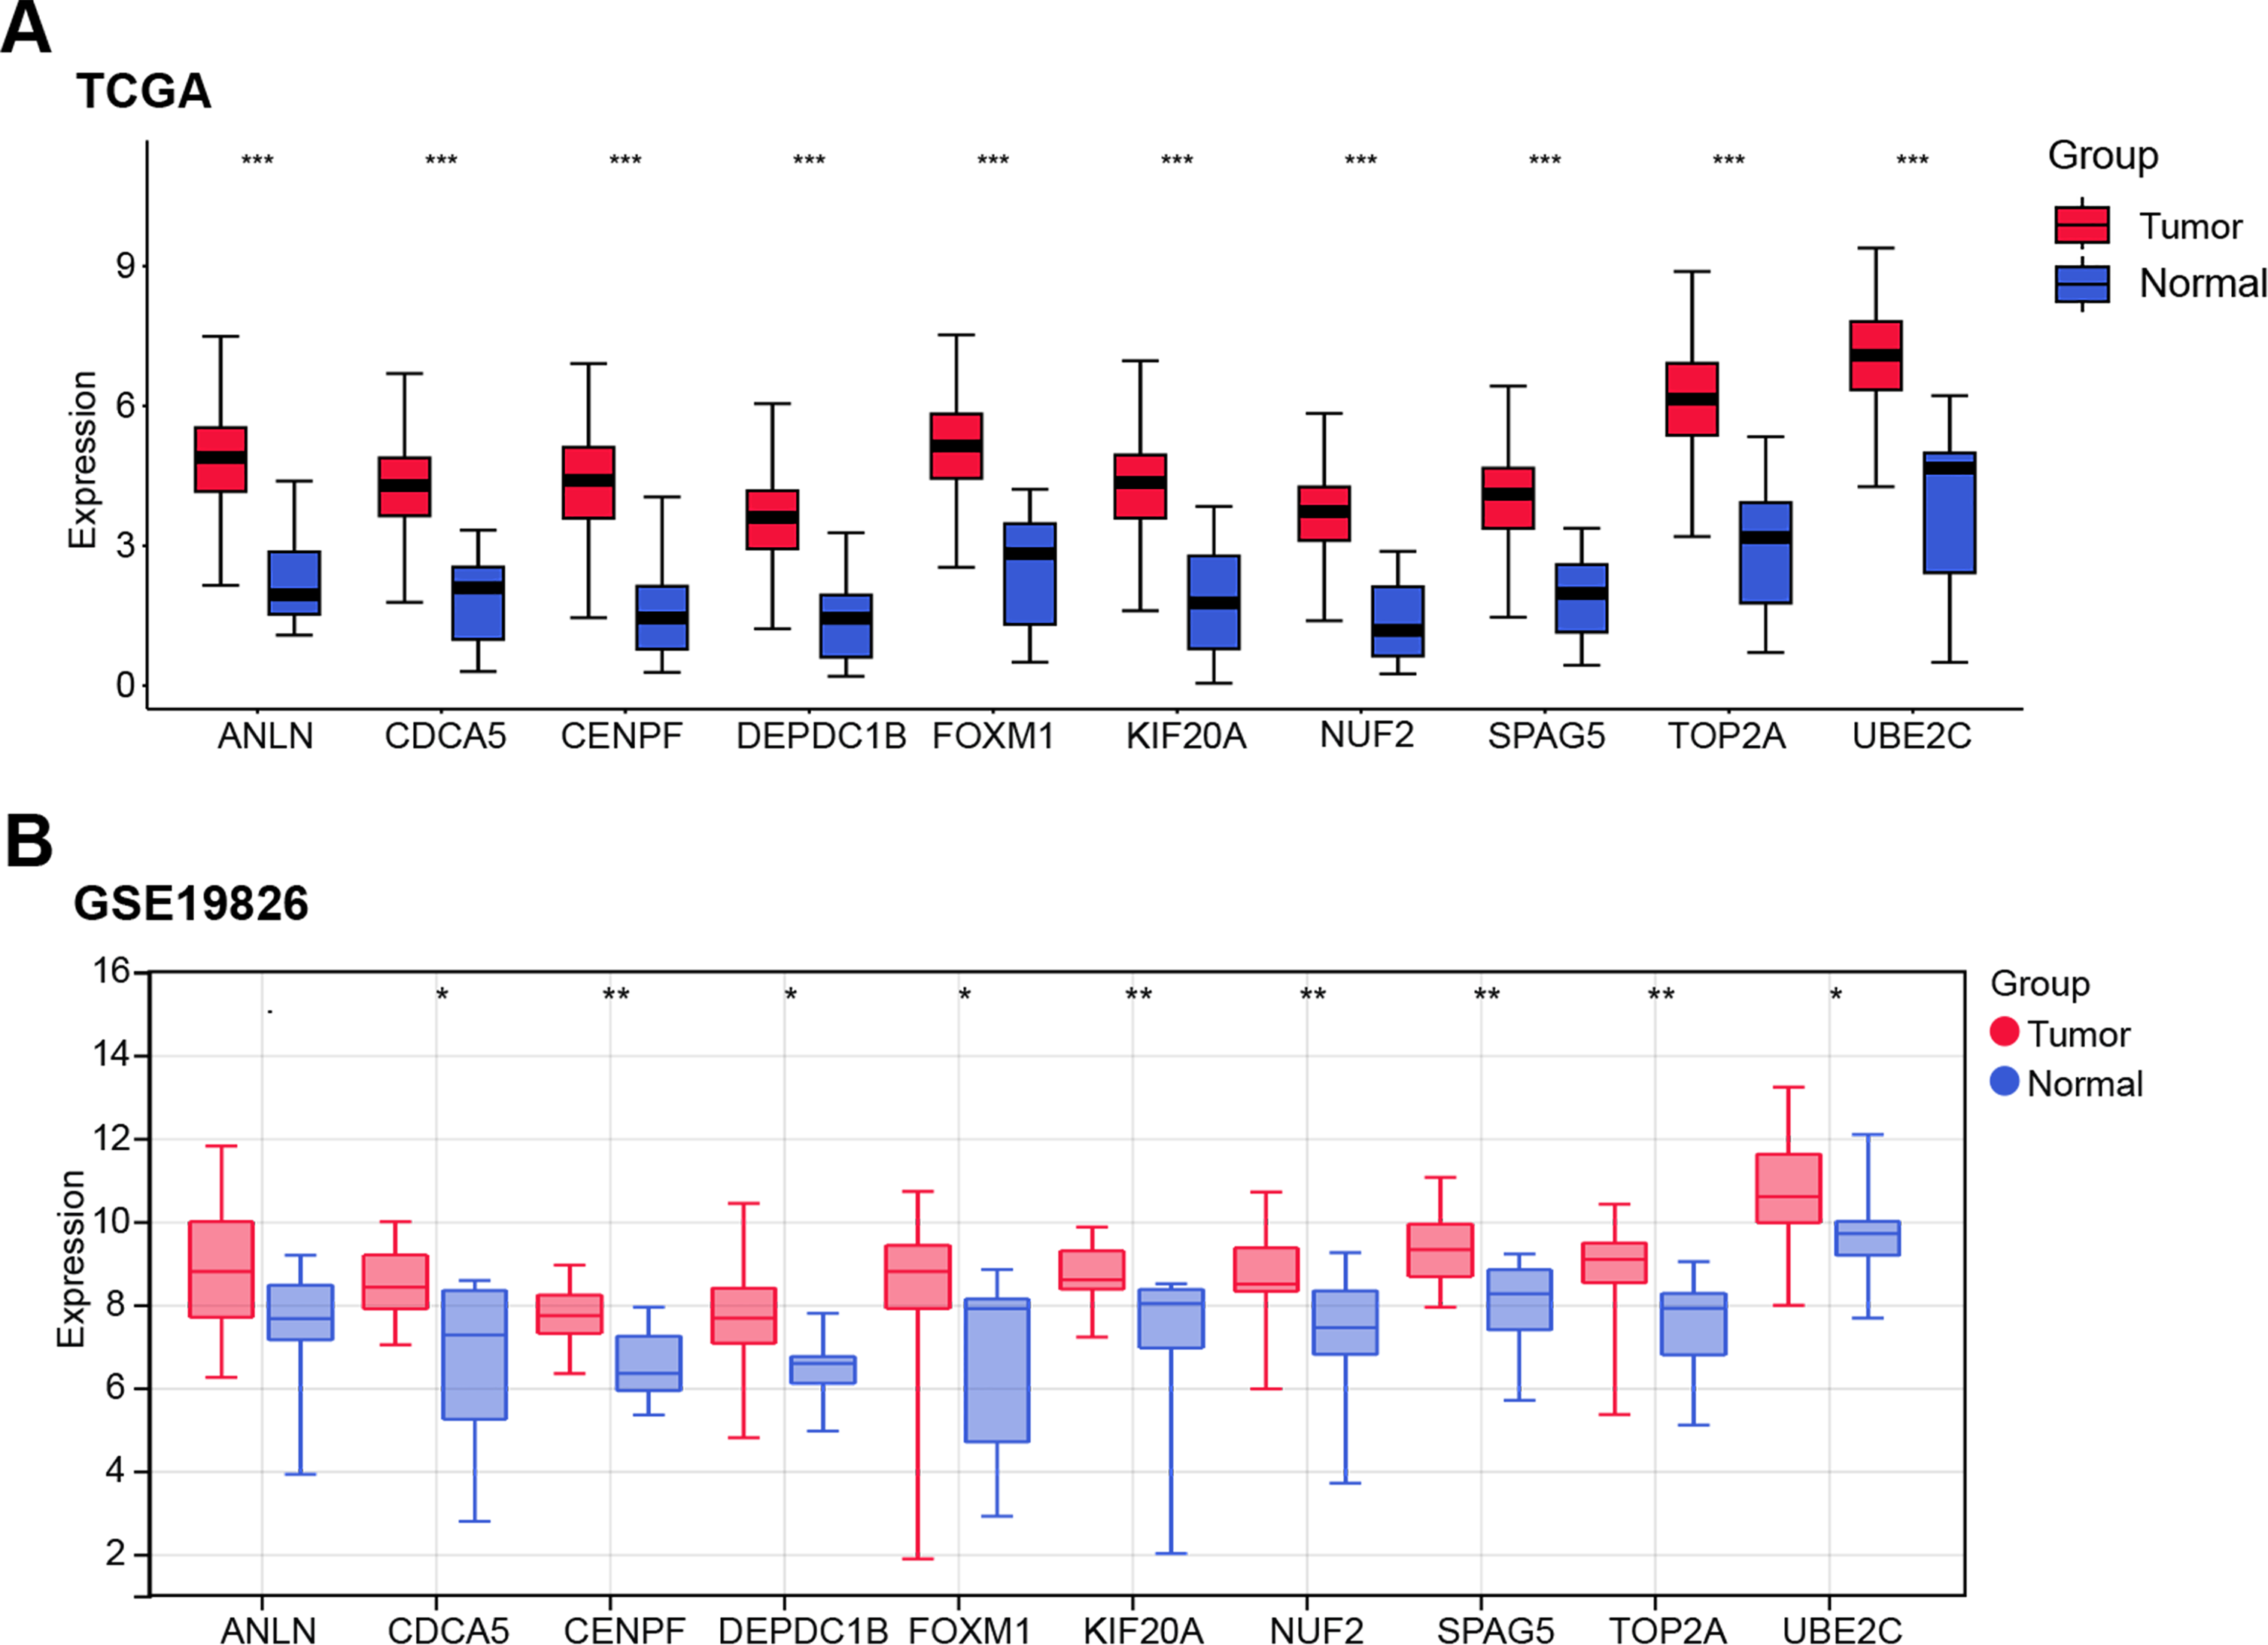
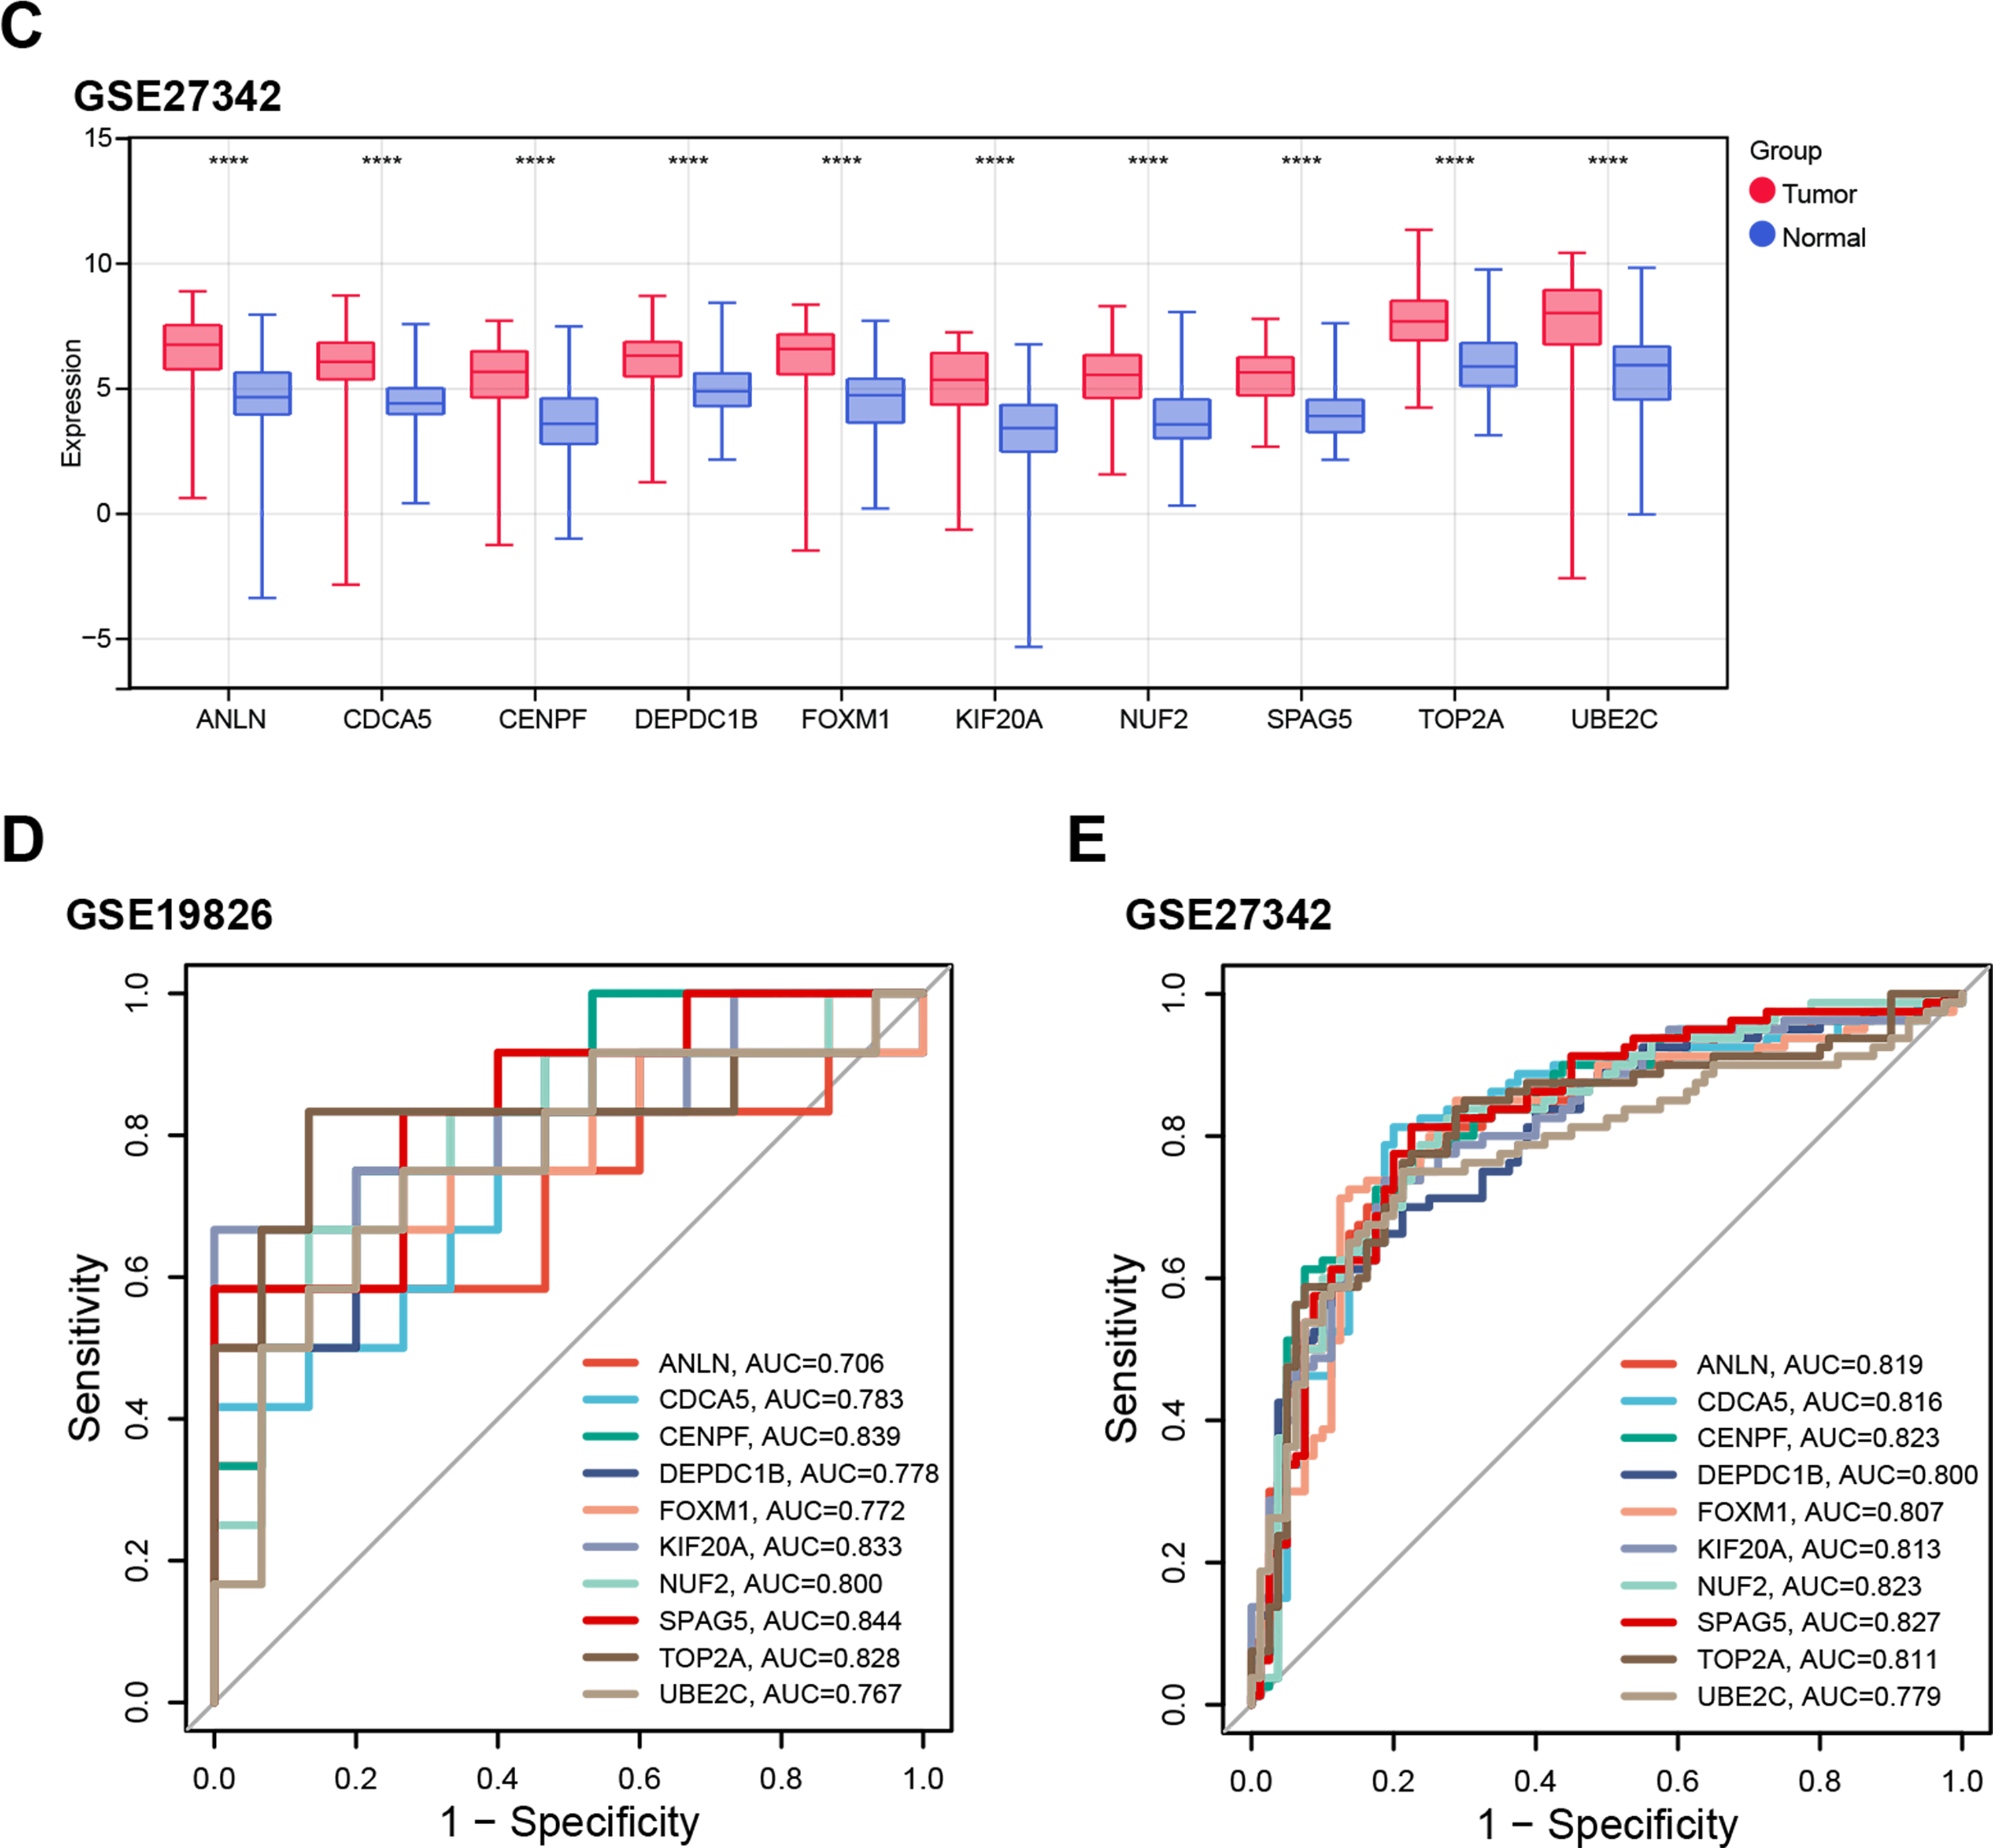
Figure 2: Expression patterns and predictive performance of candidate genes in GC. (A) Boxplot showing the expression levels of ten candidate genes (ANLN, CDCA5, CENPF, DEPDC1B, FOXM1, KIF20A, NUF2, SPAG5, TOP2A, UBE2C) in tumor and normal tissues from the TCGA-STAD dataset. (B) Boxplot displaying the expression levels of the ten candidate genes in tumor and normal tissues from the GSE19826 dataset. (C) Boxplot illustrating the expression levels of the ten candidate genes in tumor and normal tissues from the GSE27342 dataset. (D) ROC curve assessing the diagnostic accuracy of the ten candidate genes in the GSE19826 dataset. The AUC value for each gene is provided. (E) ROC curve evaluating the diagnostic accuracy of the ten candidate genes in the GSE27342 dataset, with AUC values listed for each gene. GC: gastric cancer; TCGA-STAD: the cancer genome atlas—stomach adenocarcinoma; ROC: receiver operating characteristic; AUC: area under the curve. *p < 0.05 or **p < 0.01 or ***p < 0.001 or ****p < 0.0001 vs. Tumor
3.3 Upregulation of CENPF in GC Cells Promoted Cell Proliferation and Viability
The expression of CENPF was examined in GC cell lines (HGC27, AGS, MKN45, MKN28, and SNU1) and normal gastric epithelial cells (GES-1) by RT-qPCR (Fig. 3A) and WB (Fig. 3B,C). The findings showed that CENPF expression was substantially higher in GC cell lines compared to normal cells. Among the cell lines tested, MKN45 and AGS showed the most pronounced upregulation of CENPF, and were selected for subsequent experiments. To assess the effectiveness of two siRNAs that target CENPF (si-CENPF-1 and si-CENPF-2), RT-qPCR and WB were performed after transfection into MKN45 and AGS cells. Both assays confirmed the successful knockdown of CENPF expression in these cells (Fig. 3D–F). Functional assays were executed to assess the impact of CENPF knockdown on cell phenotypes. Colony formation assays revealed that silencing CENPF inhibited the proliferative capacity of AGS and MKN45 cells (Fig. 3G). Moreover, CCK-8 assays revealed a substantial reduction in cell viability in both cell lines following CENPF knockdown (Fig. 3H,I). These findings strongly demonstrated that CENPF is upregulated in GC cells and stimulates cell proliferation.
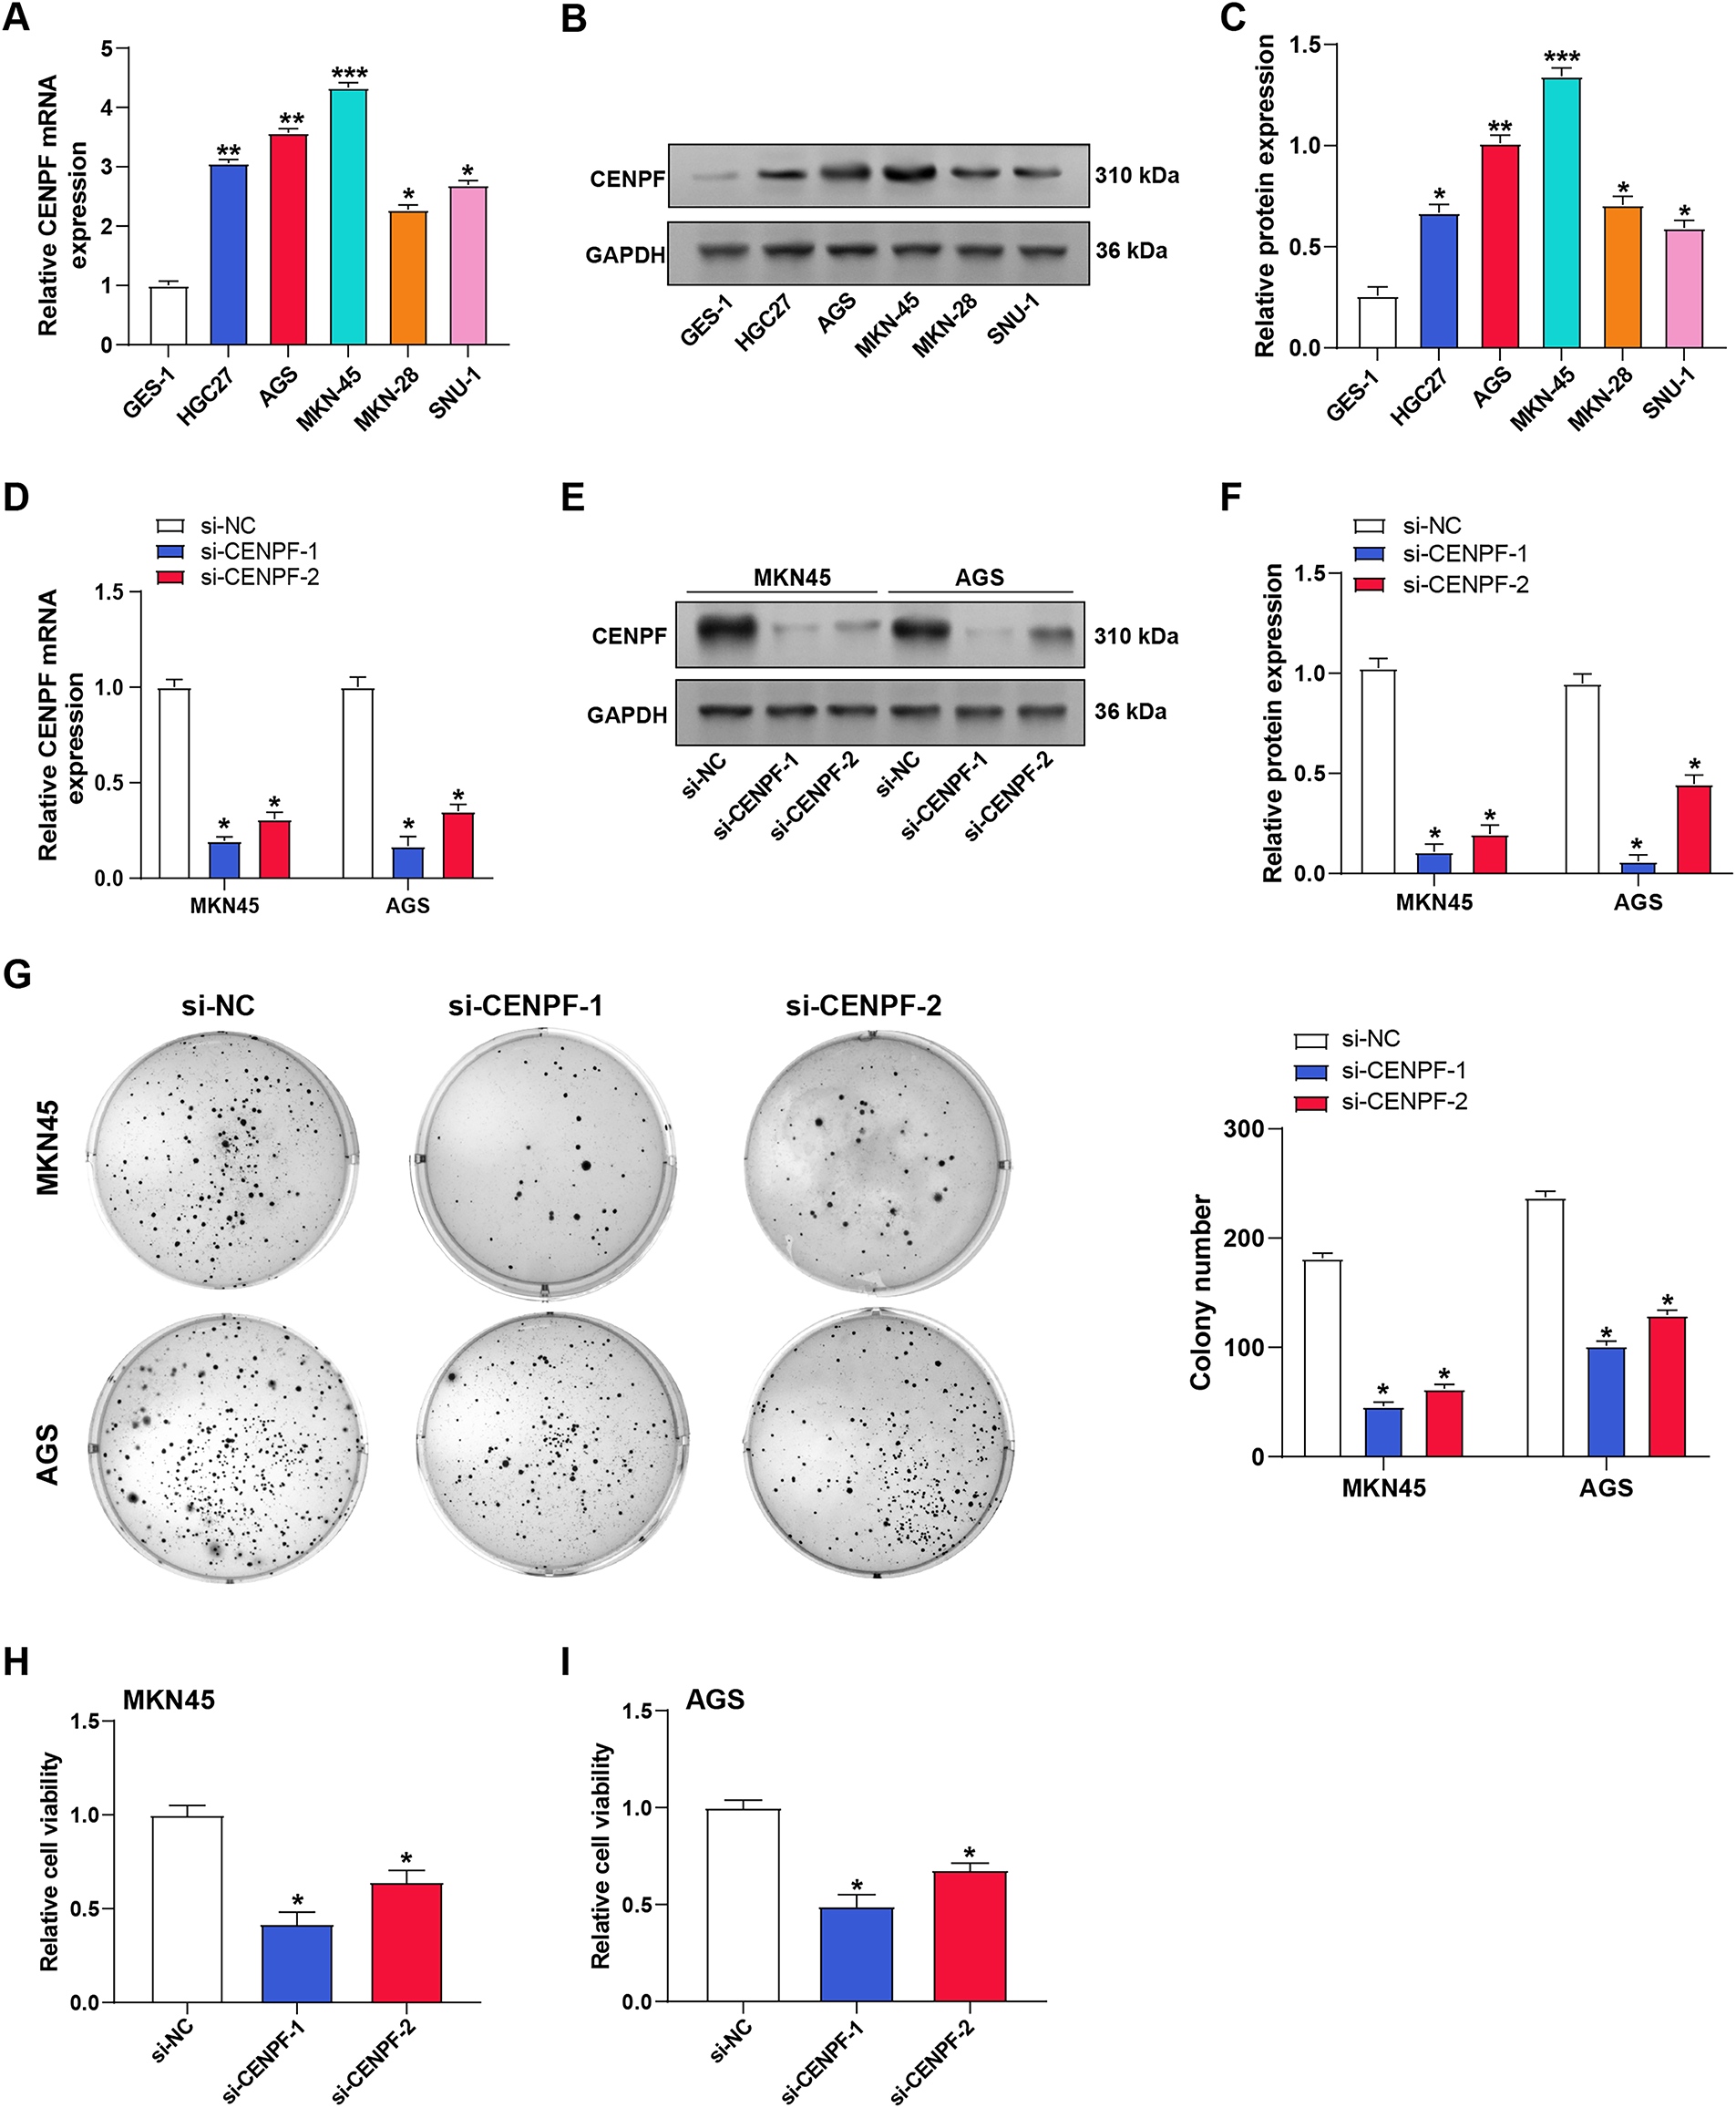
Figure 3: Upregulation of CENPF in GC cells and its role in proliferation and viability. (A) Relative mRNA expression levels of CENPF in normal gastric epithelial cells (GES-1) and GC cell lines (HGC27, AGS, MKN45, MKN28, SNU1) as determined by RT-qPCR. (B,C) Protein expression levels of CENPF in normal gastric epithelial cells (GES-1) and GC cell lines (HGC27, AGS, MKN45, MKN28, SNU1) as determined by WB, with quantification shown in the bar graphs. (D) RT-qPCR analysis confirming the knockdown efficiency of CENPF using siRNA (si-CENPF-1, si-CENPF-2) or negative control siRNA (si-NC) in MKN45 and AGS cells. (E,F) WB validation of CENPF knockdown efficiency in MKN45 and AGS cells transfected with si-CENPF-1 or si-CENPF-2, with quantification shown in the bar graphs. (G) Representative colony formation assay demonstrating the effect of CENPF knockdown on MKN45 and AGS cell proliferation, with colony numbers quantified. (H,I) CCK-8 assessed cell viability after transfection with si-NC, si-CENPF-1, or si-CENPF-2 in MKN45 (H) and AGS (I) cells. OD values at 450 nm are shown. GC: gastric cancer; RT-qPCR: quantitative reverse transcription polymerase chain reaction; siRNA: small interfering RNA; CCK-8: cell counting kit-8; OD: optical density. *p < 0.05 or **p < 0.01 or ***p < 0.001 vs. GES-1. *p < 0.05 vs. si-NC
3.4 CENPF Knockdown Promotes Apoptosis and Induces G2 Phase Arrest in GC Cells
To further explore the function of CENPF in GC cell behavior, flow cytometry was performed to analyze its impact on apoptosis and cell cycle in AGS and MKN45 cells. The outcomes showed that CENPF knockdown significantly promoted apoptosis in AGS and MKN45 cell lines in contrast to the control group, although the changes were modest (Fig. 4A,B). Additionally, flow cytometry revealed a decreased proportion of cells in the G2 phase, indicating a cell cycle arrest at the G2 phase (Fig. 4C,D). WB was conducted to examine key cell cycle-associated protein expression in MKN45 and AGS cells following CENPF knockdown. The outcomes illustrated a decrease in the levels of c-Myc and CDK1 in both cell lines (Fig. 4E–G), suggesting that CENPF reduced GC cell apoptosis and encouraged cell cycle progression.
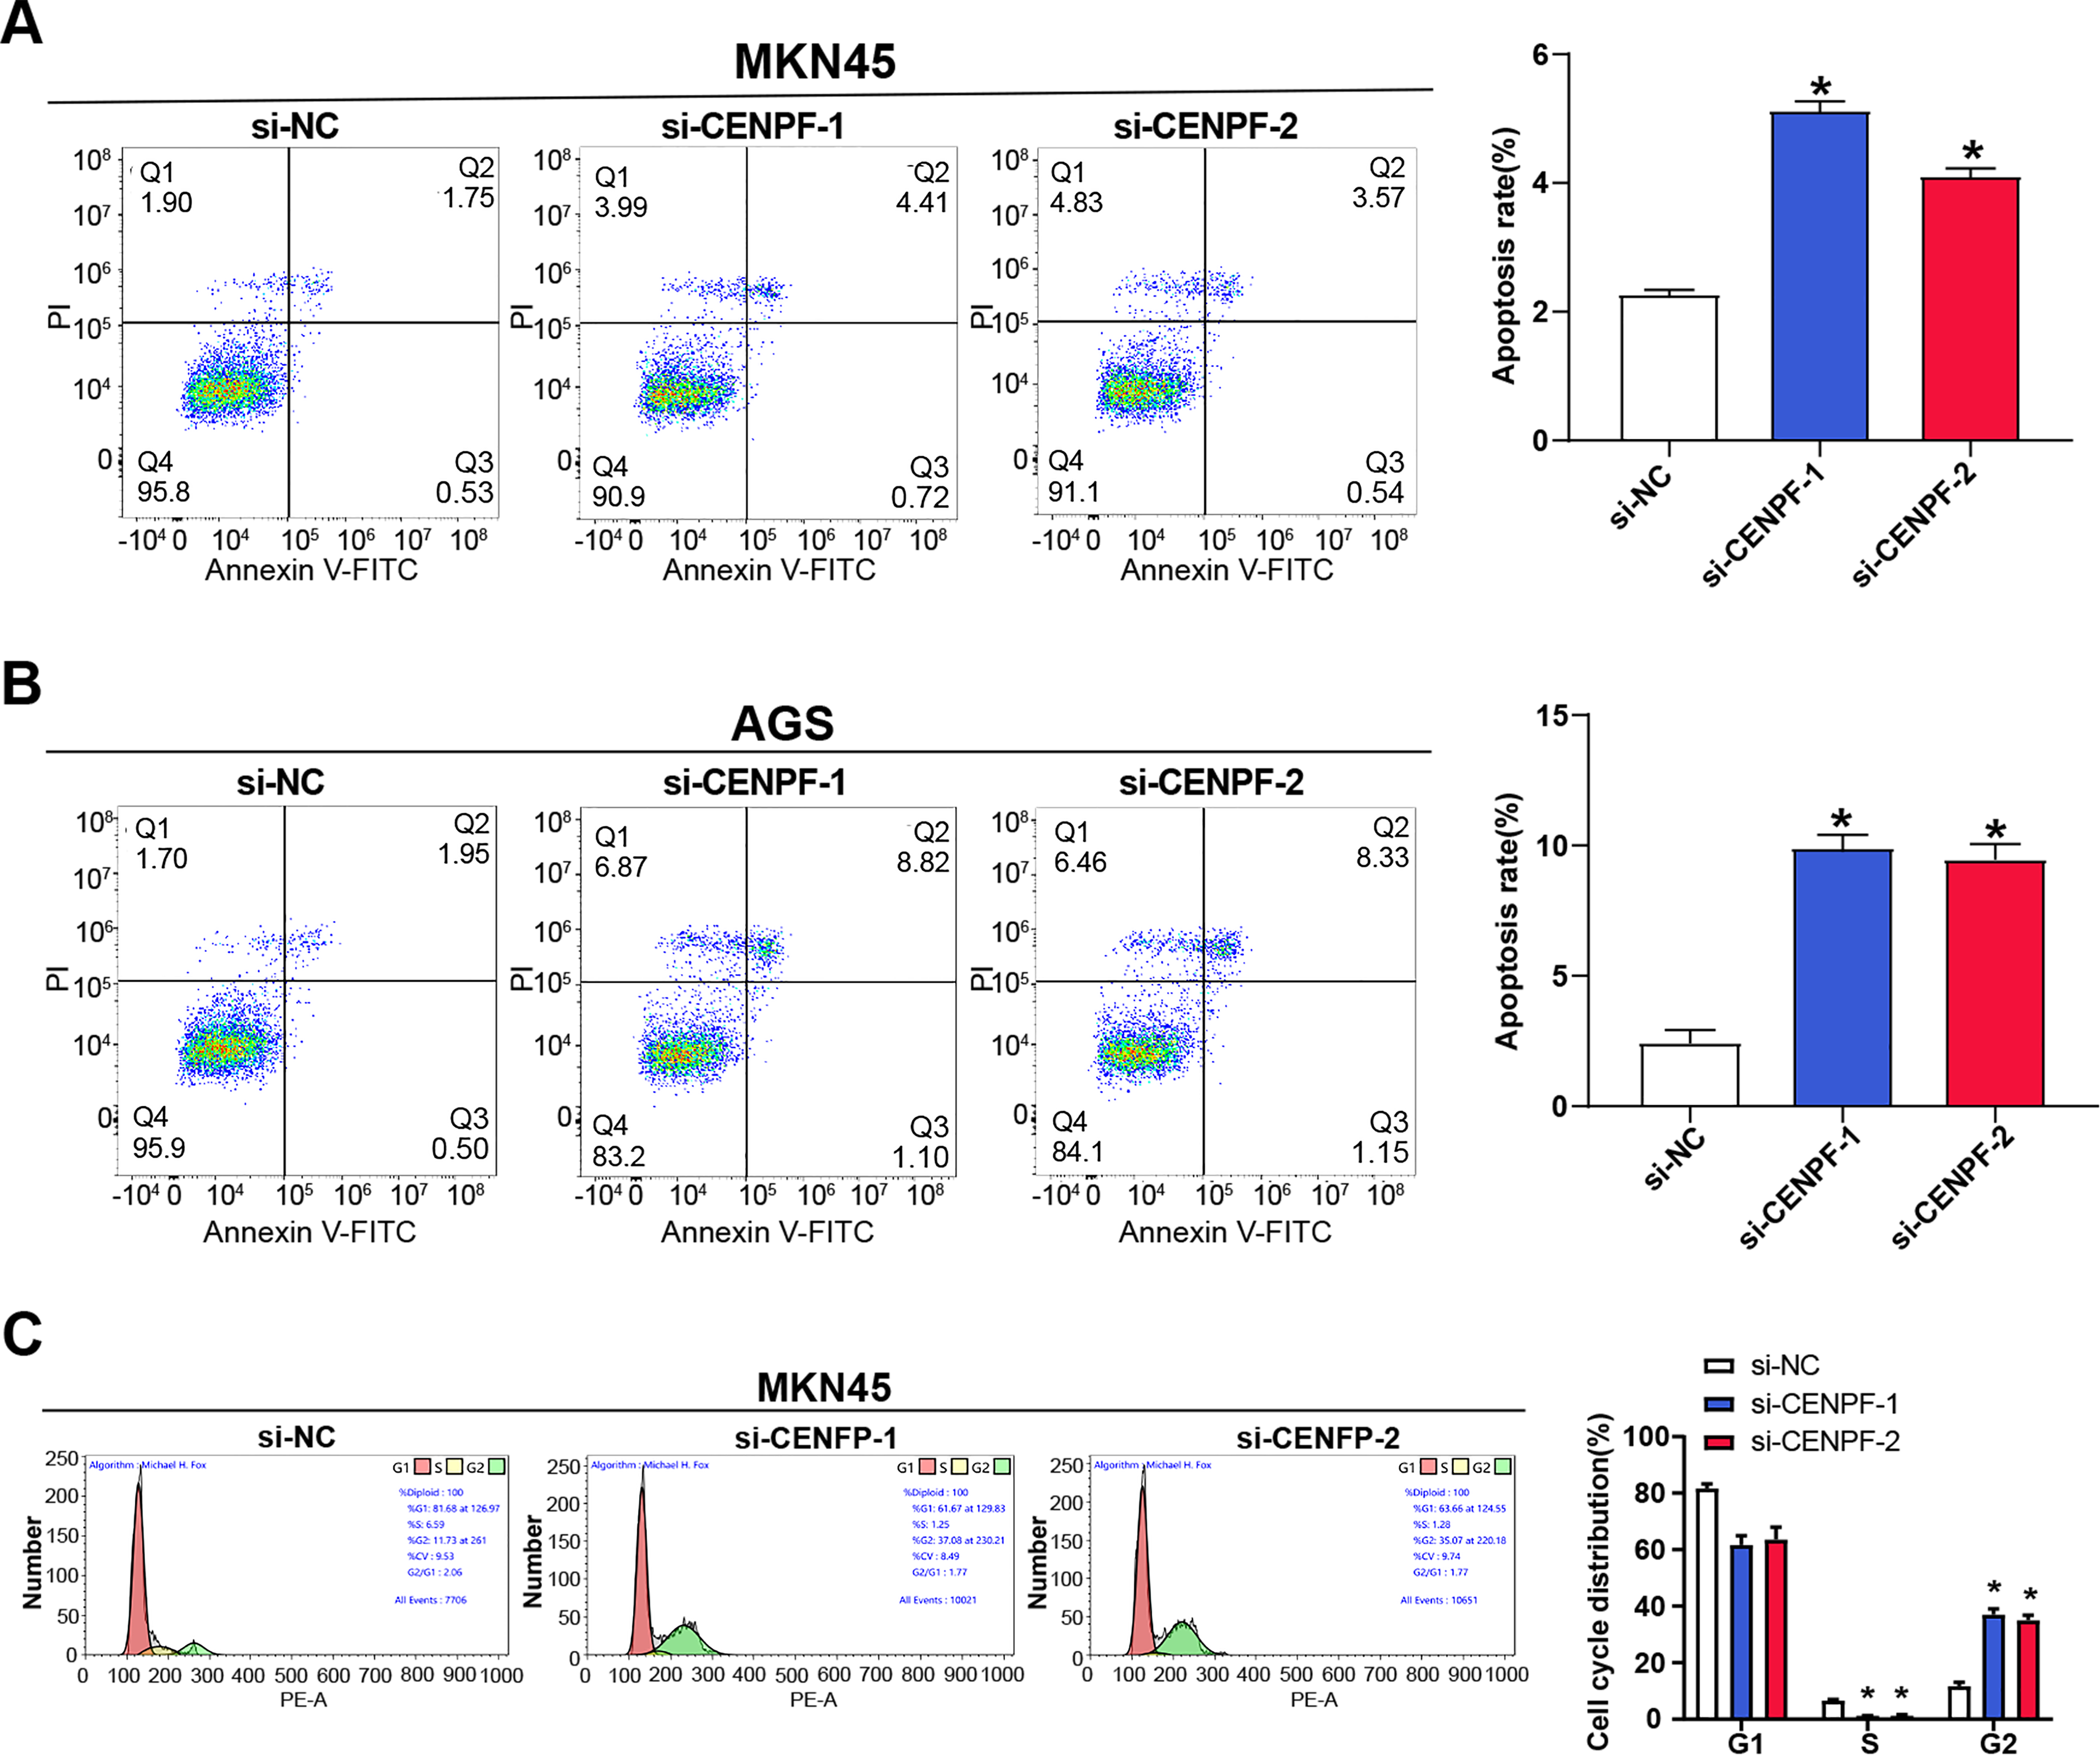
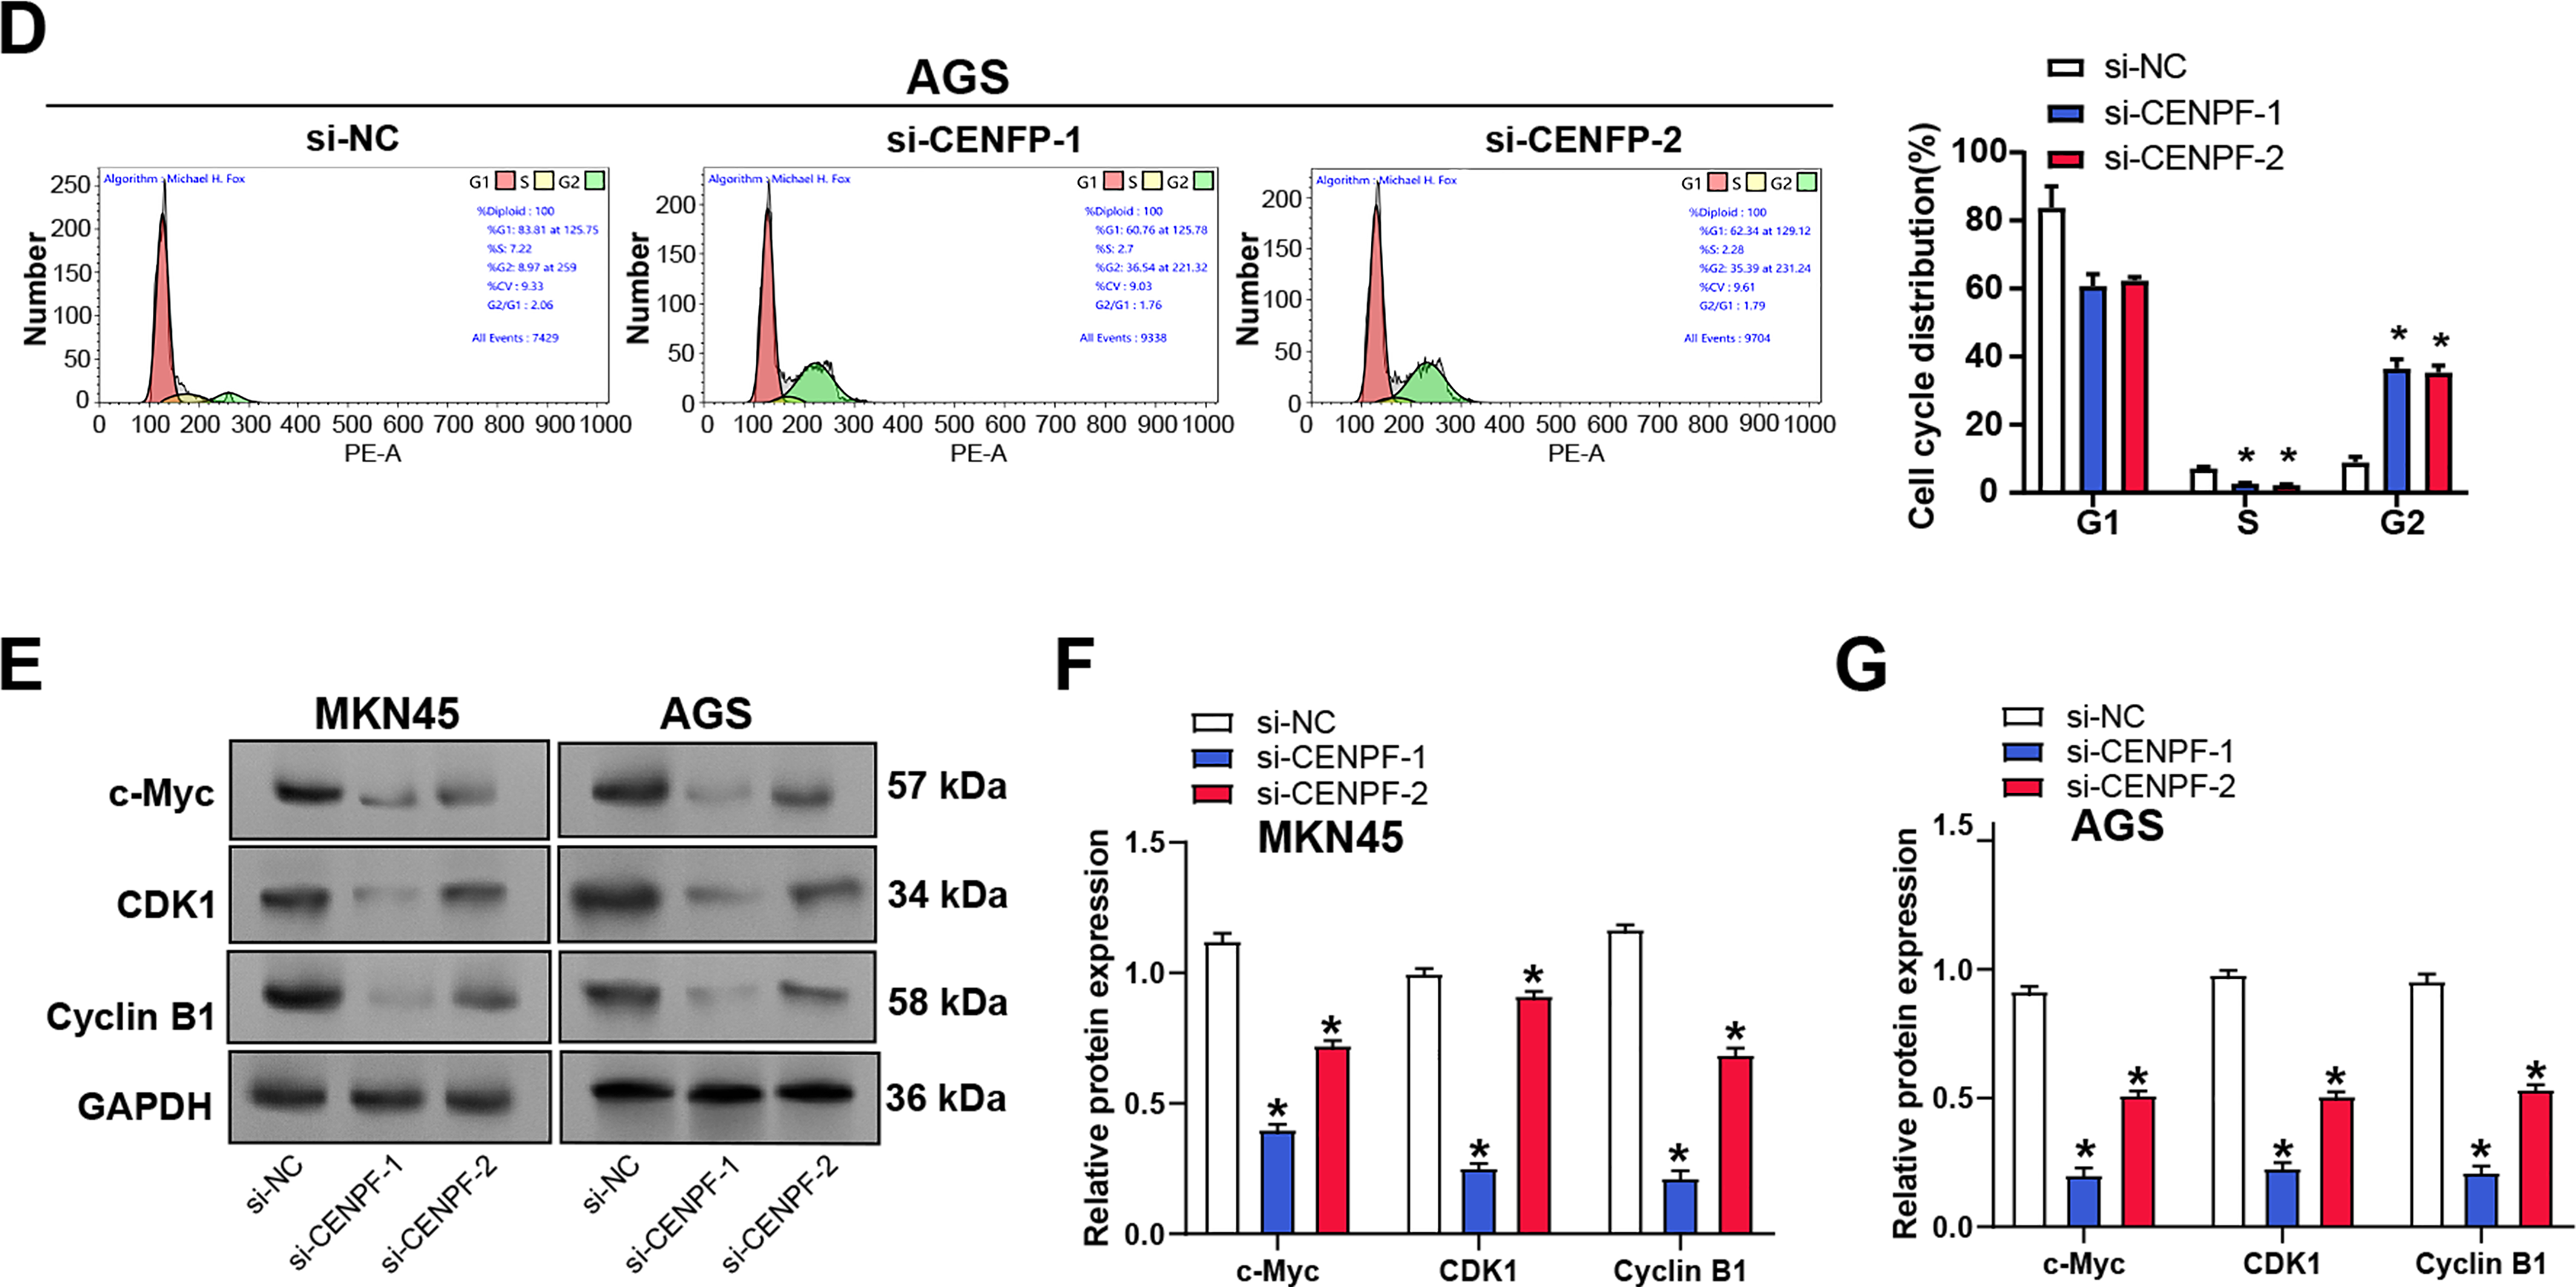
Figure 4: Effects of CENPF knockdown on apoptosis, cell cycle progression, and tumor growth in GC. (A,B) Flow cytometry analysis of apoptosis in MKN45 (A) and AGS (B) cells after CENPF knockdown. (C,D) Flow cytometry analysis of cell cycle distribution in MKN45 (C) and AGS (D) cells after CENPF knockdown. (E–G) WB analysis of c-Myc and CDK1 protein levels in MKN45 (E) and AGS (F) cells after CENPF knockdown, with quantification shown in the bar graphs. GC: gastric cancer. *p < 0.05 vs. si-NC.
3.5 CENPF Influences Amino Acid Metabolism and Correlates with the Citrate Cycle and Glutamine Pathway
RNA sequencing of MKN45 cells transfected with either si-NC or si-CENPF identified 230 upregulated DEGs and 310 downregulated DEGs (Fig. 5A). BP analysis highlighted that the DEGs were enriched in terms such as “Branched-Chain Amino Acid Transport (GO:0015803)”, “Leucine Transport (GO:0015820)”, and “Glutamine Family Amino Acid Biosynthetic Process (GO:0009084)” (Fig. 5B). KEGG pathway analysis identified significant enrichment of DEGs in pathways such as “Arginine Biosynthesis”, “Tryptophan Metabolism”, and “Folate Biosynthesis” (Fig. 5C). Moreover, GSEA revealed a strong association between CENPF and the “Alanine, Aspartate, and Glutamate Metabolism” pathway (Fig. 5D). Overall, these bioinformatics analyses indicate that CENPF may be crucial for regulating amino acid metabolism in GC cells, with particular emphasis on the glutamine metabolic pathway.
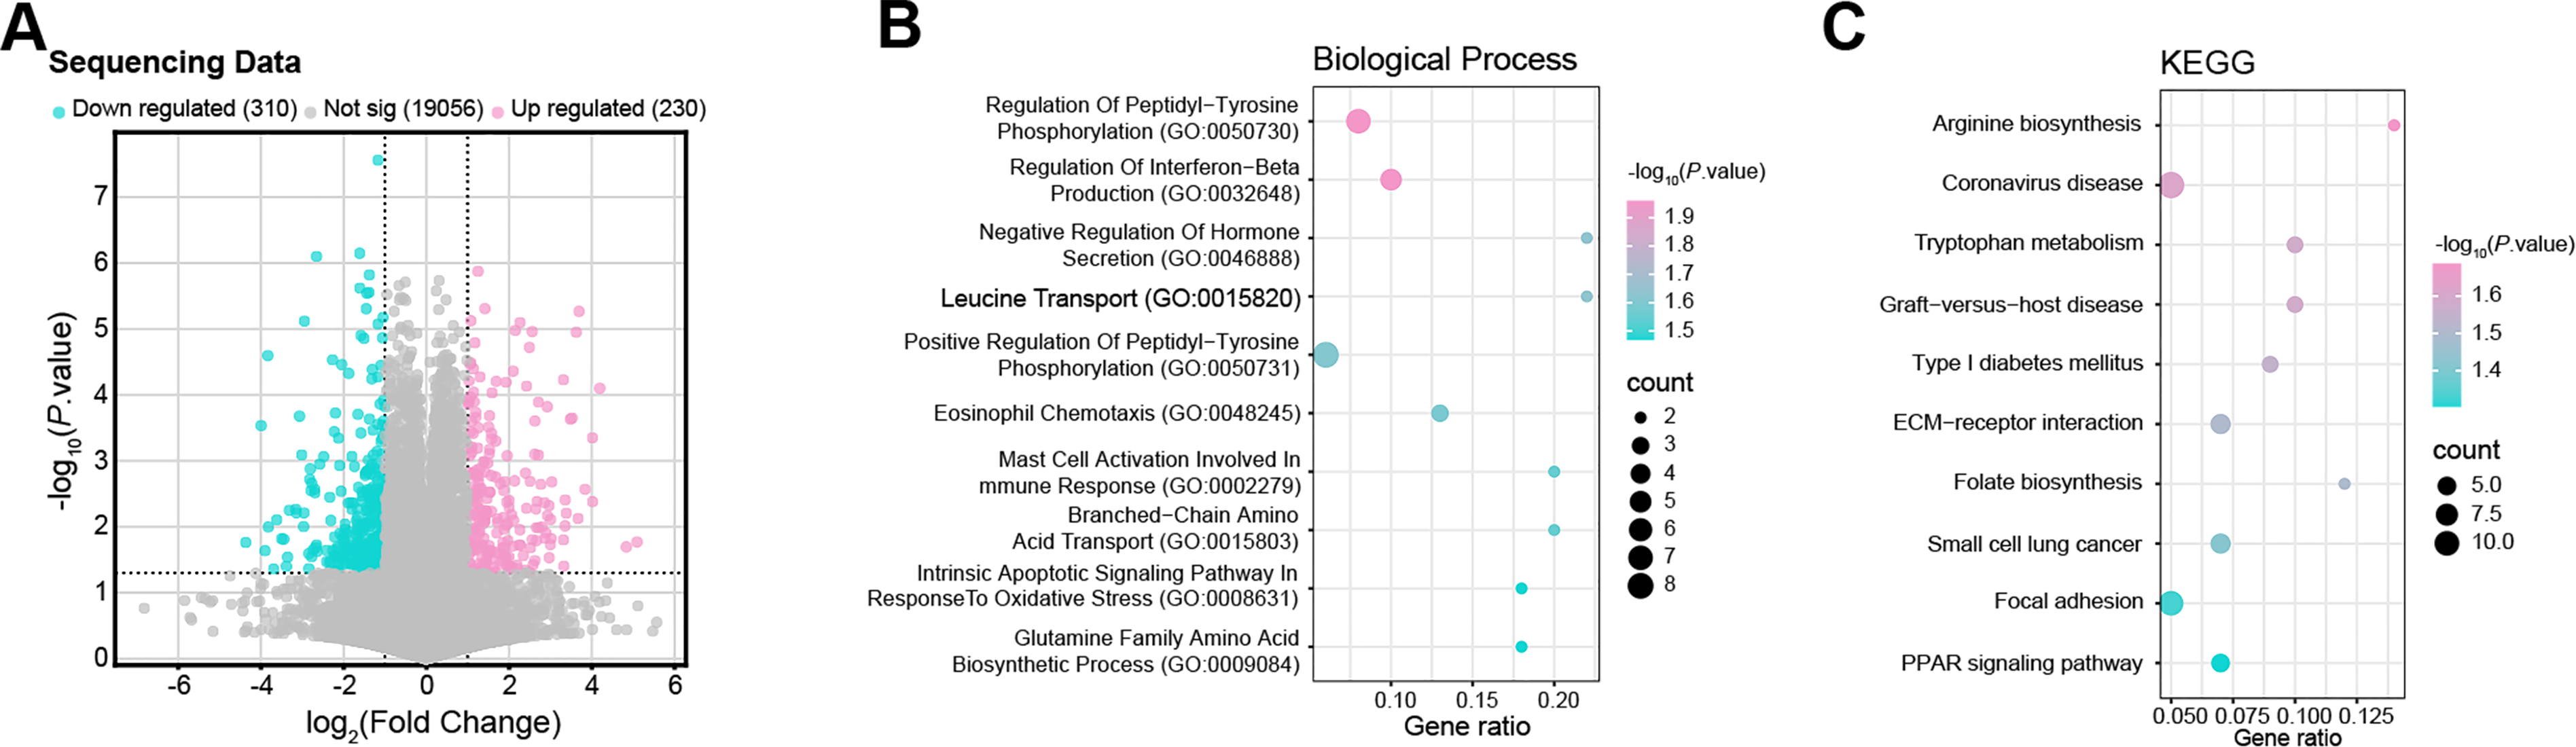
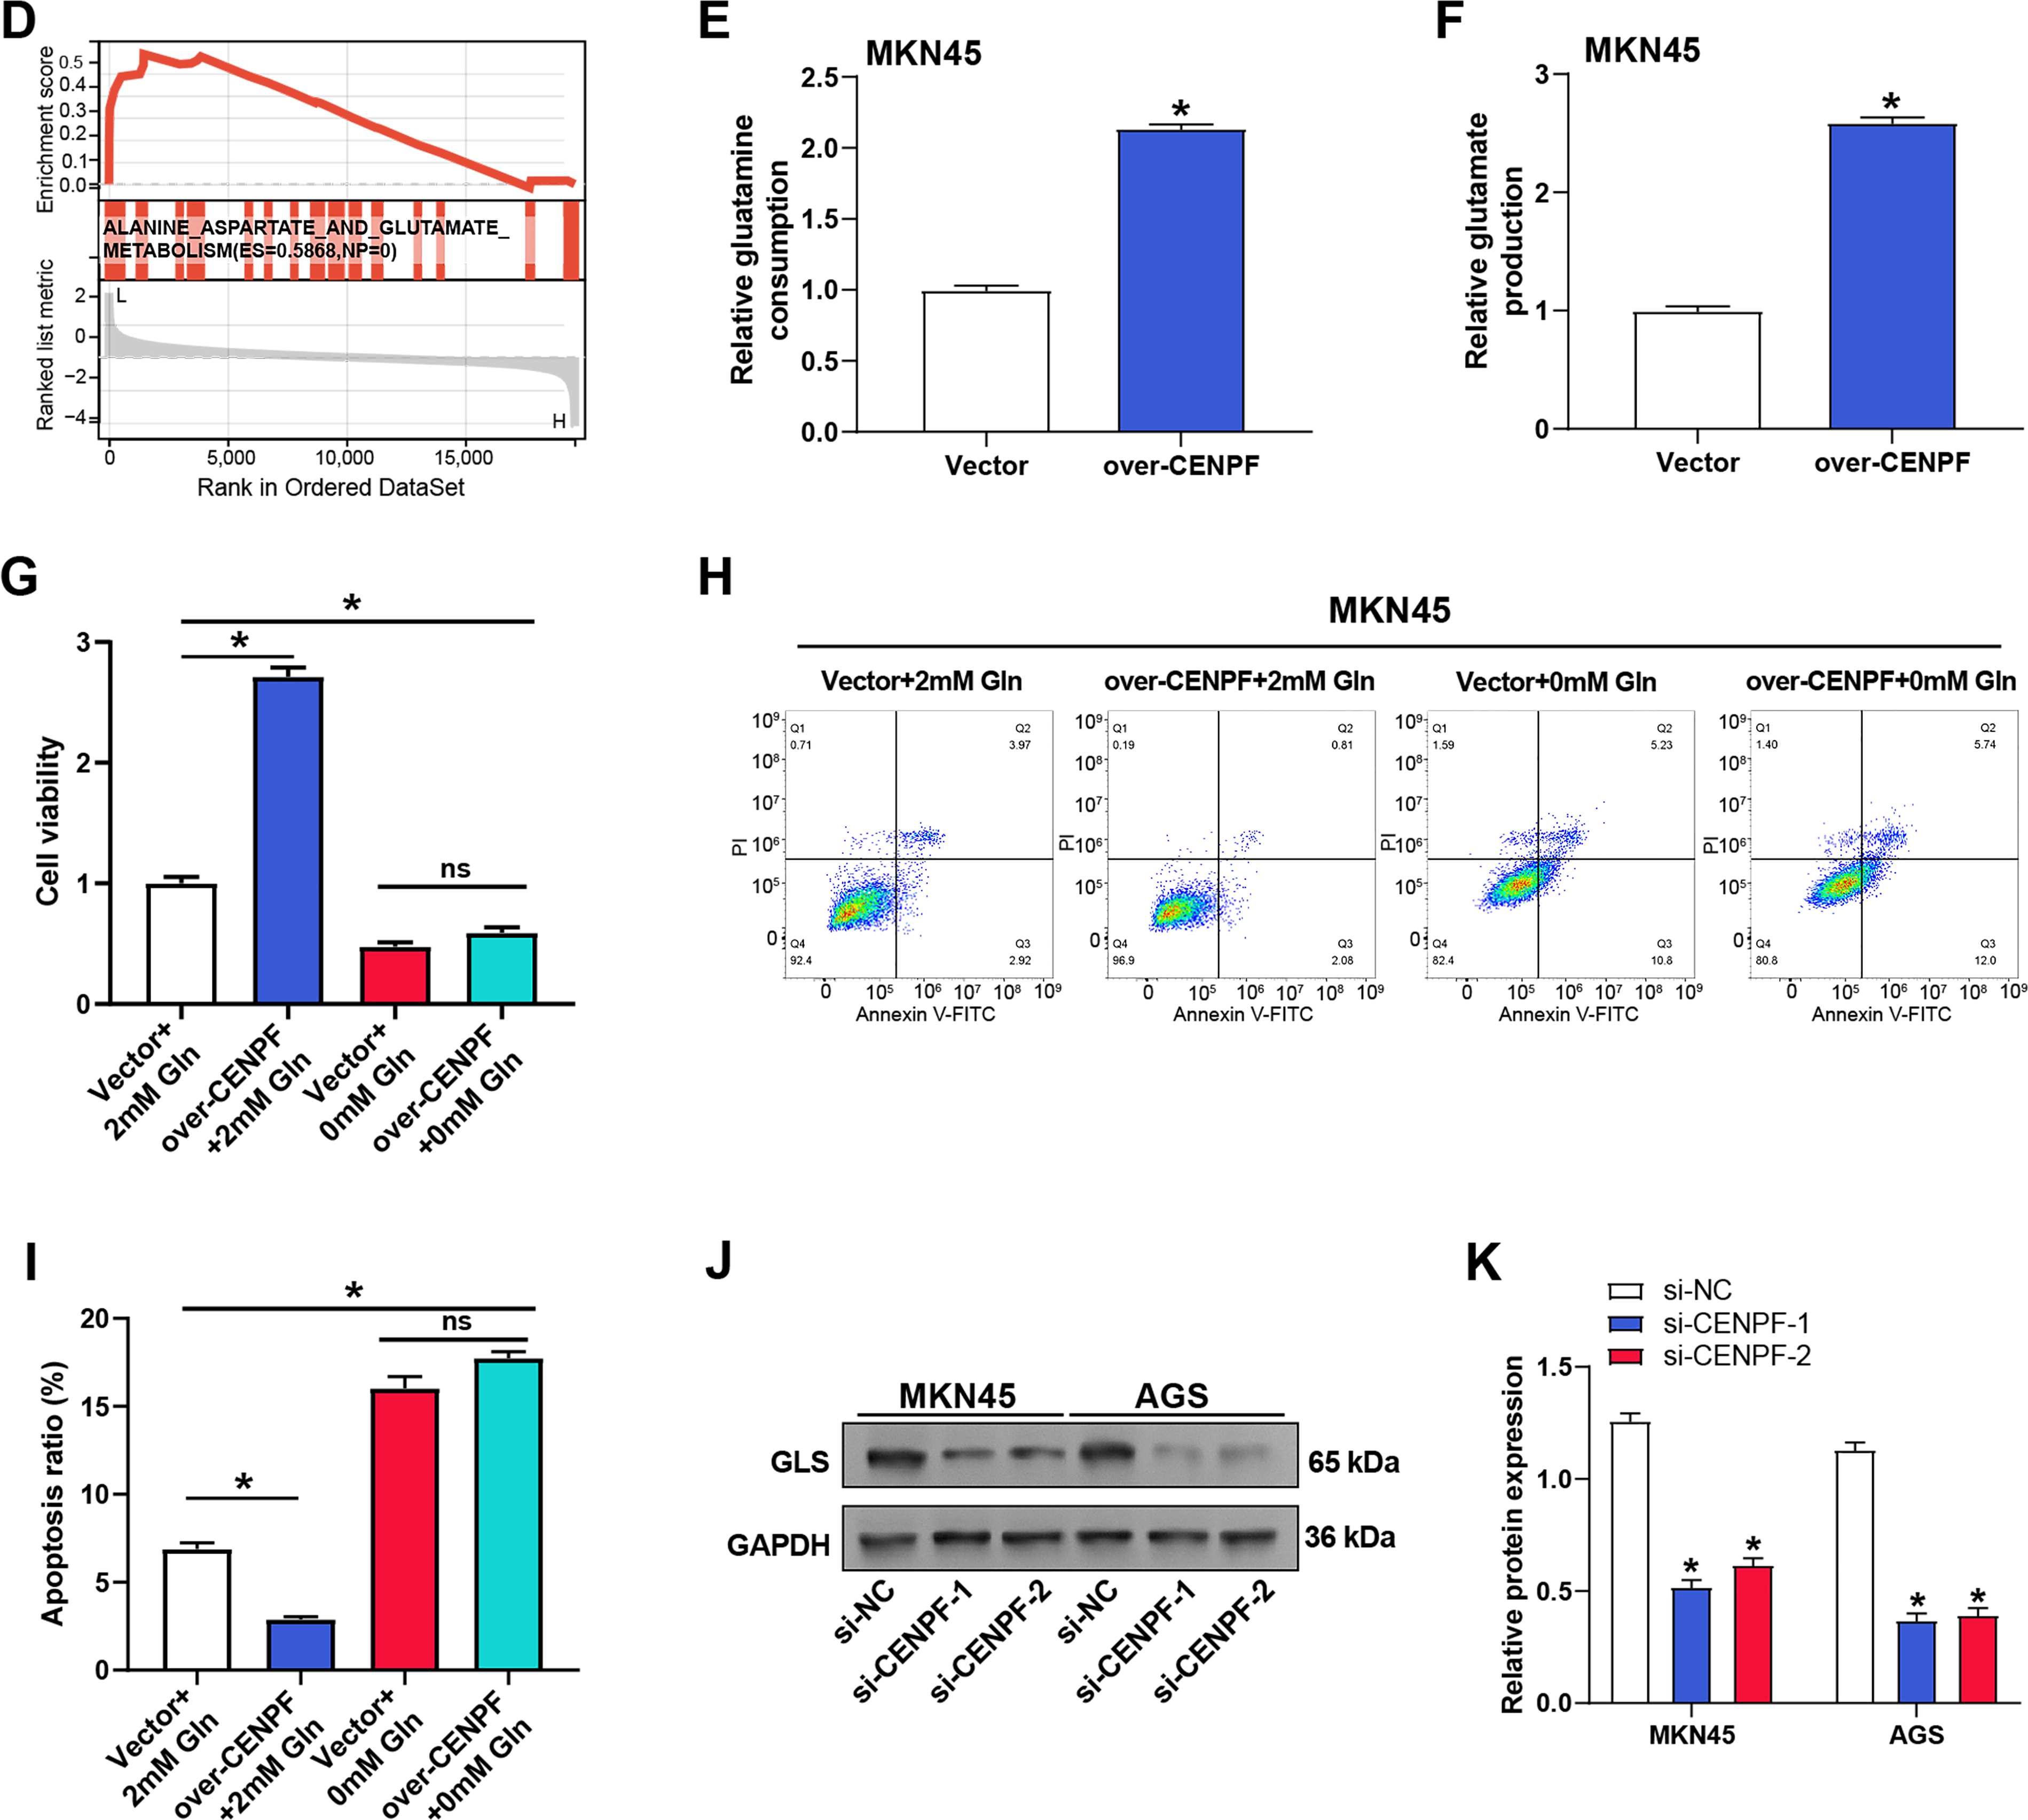
Figure 5: CENPF influences amino acid metabolism and correlates with key metabolic pathways. (A) Volcano plot showing the DEGs between MKN45 cells transfected with si-CENPF and si-NC. Upregulated genes (pink) and downregulated genes (green) were identified based on p-value and log2 fold change thresholds. (B) GO enrichment analysis of the function of DEGs based on BP. The abscissa is GeneRatio, and the ordinate is an enrichment term. The larger the dots, the more genes are enriched. (C) KEGG enrichment analysis predicted the pathways of DEGs involvement. (D) GSEA indicates a significant association between CENPF and the signal pathway. The ES indicates the strength of the pathway association with CENPF expression. (E) Glutamine consumption assay demonstrating the effect of CENPF overexpression on glutamine consumption in MKN45 cells. *p < 0.05 vs. Vector group. (F) Glutamate production assay showing the impact of CENPF overexpression on glutamate production in MKN45 cells. *p < 0.05 vs. Vector group. (G) CCK-8 assay assessing cell viability under different conditions: normal culture (2 mM Gln), CENPF overexpression with 2 mM Gln, and CENPF overexpression with glutamine depletion (0 mM Gln). ns: not significant. *p < 0.05 vs. Vector + 2 mM Gln. (H,I) Flow cytometry analysis of apoptosis in MKN45 cells under normal culture conditions (2 mM Gln), CENPF overexpression with 2 mM Gln, and CENPF overexpression with glutamine depletion (0 mM Gln). ns: not significant. *p < 0.05 vs. Vector + 2 mM Gln. (J,K) WB analysis of GLS expression in MKN45 and AGS cells following CENPF knockdown under normal culture conditions, with quantitative data represented in bar graphs. DEG: differentially expressed gene; GO: gene ontology; BP: biological process; KEGG: Kyoto encyclopedia of genes and genomes; GSEA: gene set enrichment analysis; ES: enrichment score; CCK-8: cell counting kit-8; Gln: glutamine; GLS: glutaminase. *p < 0.05 vs. si-NC
3.6 CENPF Regulates GC Proliferation and Apoptosis through Glutamine Metabolism
To better understand the function of CENPF in glutamine metabolism in GC, measurements of glutamine intake and glutamate synthesis were performed by specific detection kits. The results showed that CENPF knockdown reduced glutamine consumption and glutamate production in AGS cells compared with the si-NC group (Fig. A1B,C). Conversely, to evaluate whether CENPF overexpression could enhance glutamine metabolism, we established CENPF overexpression cell lines in MKN45 and AGS cells. Successful overexpression of CENPF was verified at the protein and mRNA levels (Fig. A1D–F). To further investigate the functional significance of this metabolic regulation. Specific detection kits were employed to assess glutamate synthesis and glutamine intake. CENPF overexpression increased glutamine consumption and glutamate production in MKN45 cells compared with the vector group (Fig. 5E,F). Further analysis using CCK-8 assays disclosed that CENPF overexpression improved cell viability of MKN45 cells under normal culture conditions (2 mM Gln). However, under glutamine-deficient conditions (0 mM Gln), the viability of MKN45 cells overexpressing CENPF was lower than that of cells grown on normal media (Fig. 5G). Flow cytometry analysis showed that overexpression of CENPF reduced apoptosis of MKN45 cells cultured in normal medium (2 mM Gln), while glutamine deficiency reversed this effect and induced apoptosis (Fig. 5H,I). Subsequently, the ratio of intracellular GSH and GSSG under different conditions showed that in normal culture medium (2 mM Gln), overexpression of CENPF promoted the increase of the GSH/GSSG ratio and improved cellular antioxidant capacity. However, after glutamine deprivation, the ratio of Vector + 0 mM Gln to Vector + 2 mM Gln decreased, and there was no significant change after overexpression of CENPF compared with Vector + 0 mM Gln (Fig. A1G). WB analysis confirmed that CENPF knockdown inhibited the levels of GLS in MKN45 and AGS cells cultured in normal medium compared with the si-NC group (Fig. 5J,K). These outcomes suggest that CENPF may modulate GC cell proliferation and apoptosis by regulating glutamine metabolism.
3.7 CENPF Regulates GC Cell Proliferation through GLS-Mediated Glutamine Metabolism
The interaction between CENPF and glutamine metabolism in GC cells was further investigated by evaluating the effects of GLS, glutamate, and α-KG in MKN45 cells. WB analysis was applied to confirm the overexpression and knockdown efficiency of GLS in MKN45 cells (Fig. A2A,B). Functional experiments showed that CENPF knockdown caused apoptosis and suppressed cell proliferation, while GLS overexpression treatment reversed this effect (Fig. A2C,D). In contrast, CCK-8 experiments revealed that CENPF overexpression promoted cell proliferation, while co-treatment of overexpressed CENPF combined with si-GLS reduced this effect (Fig. 6A). Flow cytometry analysis showed that overexpression of CENPF inhibited apoptosis in MKN45 cells, while si-GLS reversed this protective effect against apoptosis (Fig. 6B,C). Subsequent analysis using relevant detection kits demonstrated that CENPF overexpression increased the production of glutamate and α-KG, while co-treatment with si-GLS inhibited these effects (Fig. 6D,E). To further confirm the function of GLS in CENPF-mediated effects, we applied CB-839 (a specific GLS inhibitor) to cells that overexpressed CENPF. Consistent with the knockdown results, pharmacological inhibition of GLS by CB-839 decreased cell viability and promoted apoptosis in CENPF-overexpressing cells (Fig. 6F–H).
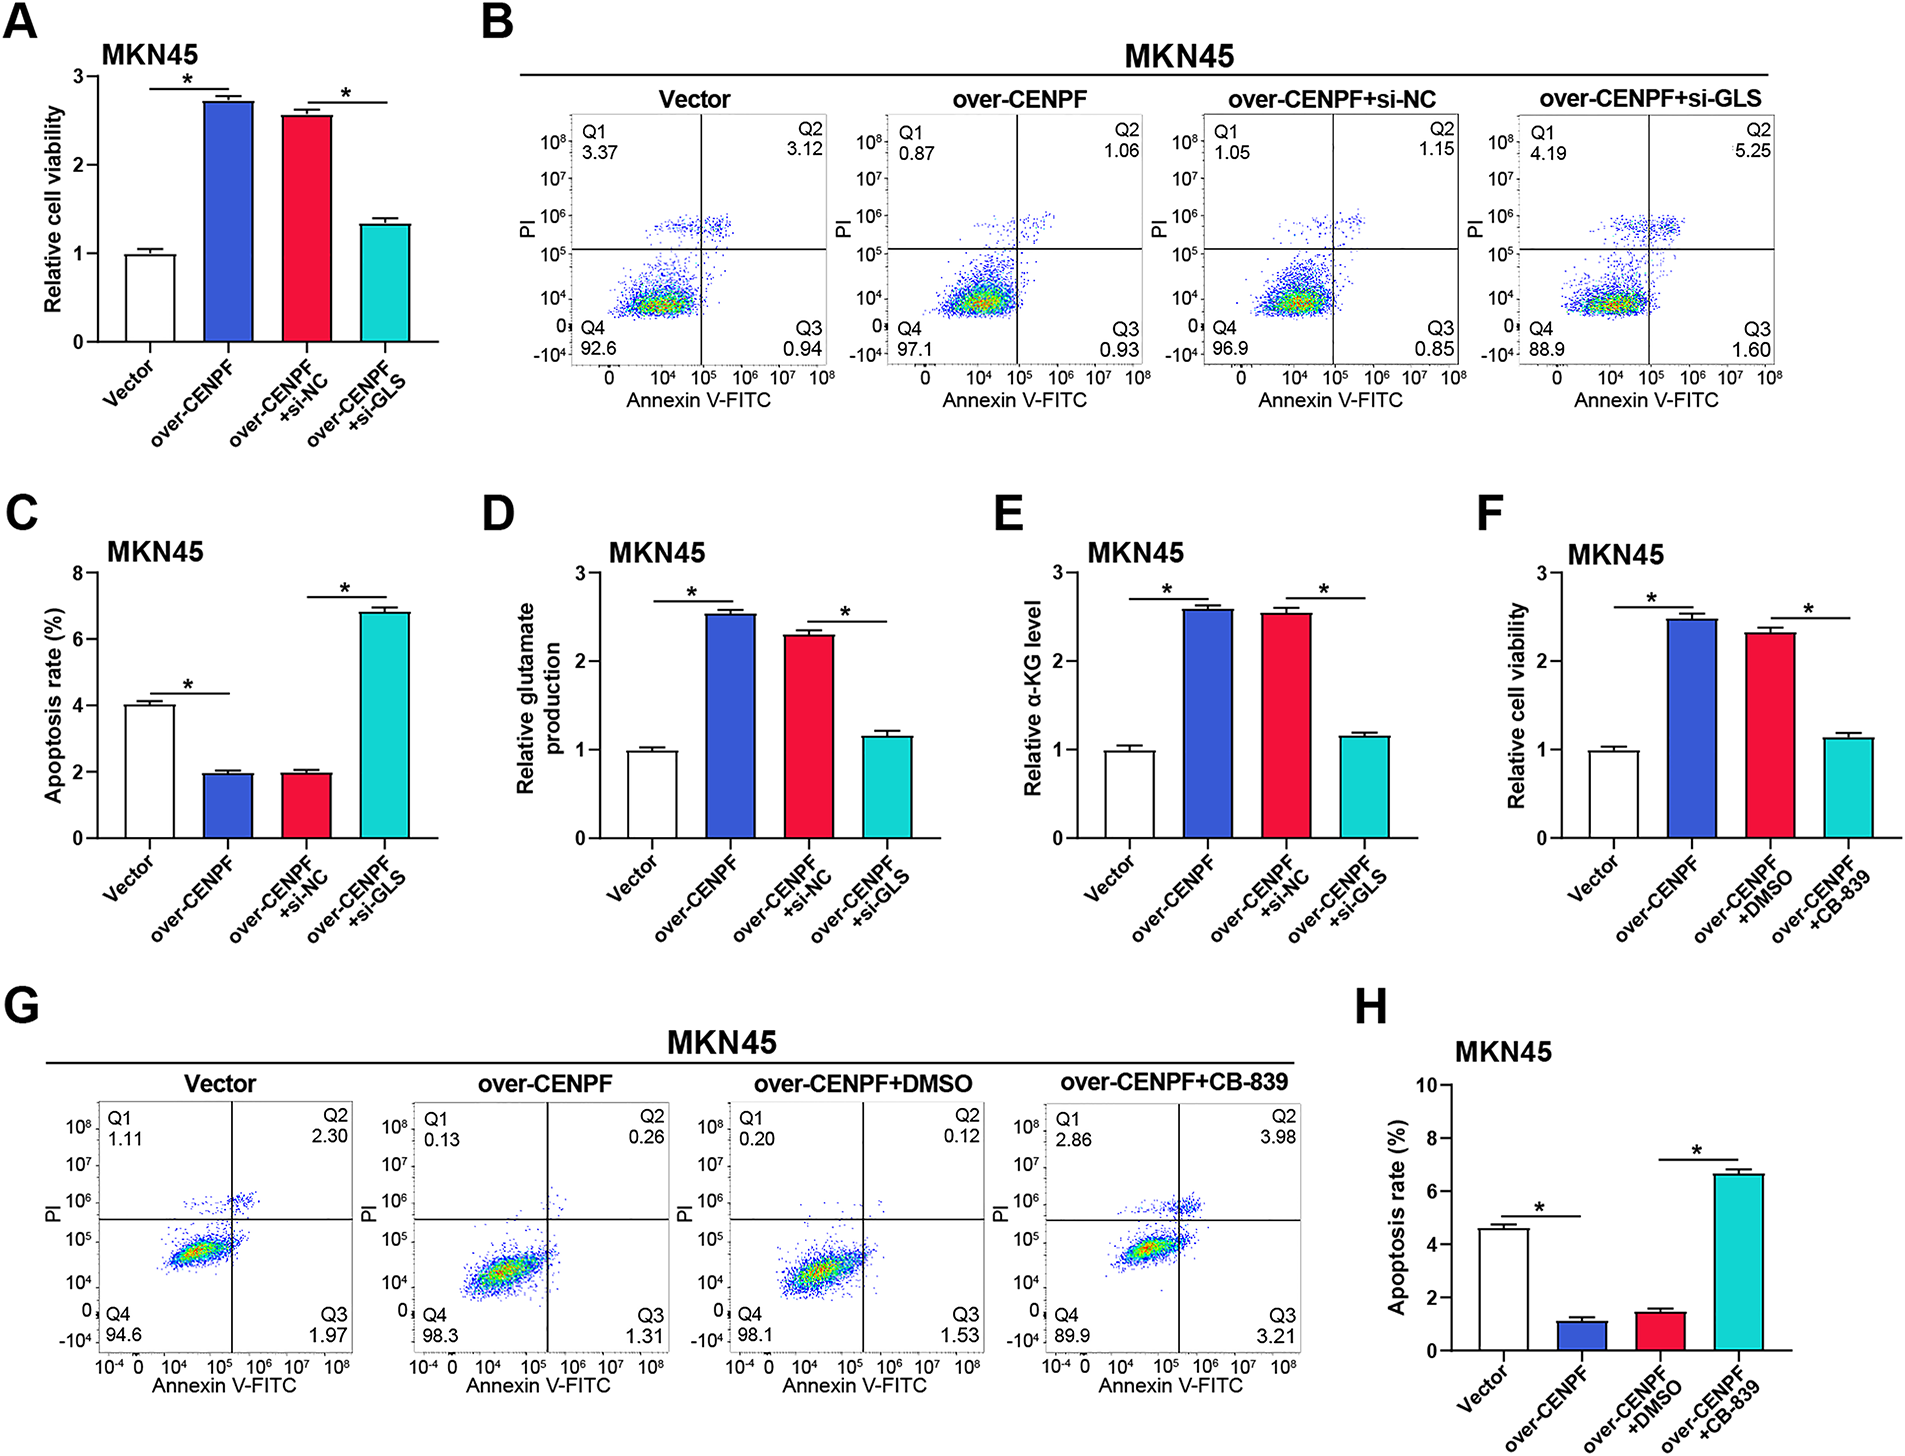
Figure 6: CENPF promotes glutamine metabolism and regulates cell proliferation through GLS. (A) CCK-8 assay showing the impact of CENPF overexpression and/or GLS knockdown on MKN45 cell viability. (B,C) Flow cytometry analysis of apoptosis in MKN45 cells with CENPF overexpression and/or GLS knockdown, with quantitative data shown in the bar graph. (D) Glutamate production assay assessing the effect of CENPF overexpression and/or GLS knockdown on glutamate levels in MKN45 cells. (E) α-KG assay showing the impact of CENPF overexpression and/or GLS knockdown on α-KG levels in MKN45 cells. (F) CCK-8 assay evaluating the effect of CENPF overexpression and/or selective GLS inhibitor Telaglenastat (CB-839) on MKN45 cell viability. (G,H) Flow cytometry analysis of apoptosis in MKN45 cells with CENPF overexpression and/or CB-839 treatment, with quantitative data presented in the bar graph (H). *p < 0.05 vs. Vector or over-CENPF + si-NC
3.8 CENPF Stabilizes c-Myc by Modulating the Ubiquitin-Proteasome System in GC Cells
According to reports, the protein known as the oncogenic transcription factor c-Myc has a short lifespan, typically degraded through the ubiquitin-proteasome pathway. c-Myc is located upstream of the glutaminolysis pathway and has been shown to directly regulate key enzymes in the glutaminolysis pathway, including GLS, which catalyzes the conversion of glutamine to glutamate [21]. Therefore, we explored whether CENPF regulates c-Myc in GC cells via proteasome-dependent degradation. A further study employing a PPI network analysis revealed interactions among CENPF, c-Myc, and GLS (Fig. 7A). Correlation analysis based on the TCGA-STAD dataset showed a positive correlation between CENPF and c-Myc (p = 1.09 × 10⁻¹¹, r = 0.33), suggesting a potential cooperative role in GC progression (Fig. 7B). RT-qPCR analysis of MKN45 cells revealed that CENPF knockdown or overexpression did not significantly affect c-Myc mRNA levels, indicating a non-transcriptional regulation mechanism (Fig. 7C,D). Using CHX to assess c-Myc degradation over time (0, 0.5, 1, 2, 3 h), WB analysis demonstrated that CENPF knockdown accelerated c-Myc degradation, while CENPF overexpression prolonged its half-life (Fig. 7E–H). To investigate the role of the proteasome pathway, CENPF knockdown MKN45 cells were treated with MG132, a proteasome inhibitor. WB analysis revealed that MG132 treatment restored c-Myc expression levels that had been reduced by CENPF knockdown, implying that CENPF modulates c-Myc stability via the ubiquitin-proteasome system (Fig. 7I,J). Finally, Co-immunoprecipitation experiments showed that MG132 treatment could rescue c-Myc protein levels in CENPF-knockdown cells, further confirming that CENPF regulates c-Myc protein stability through the proteasome pathway (Fig. 7K).
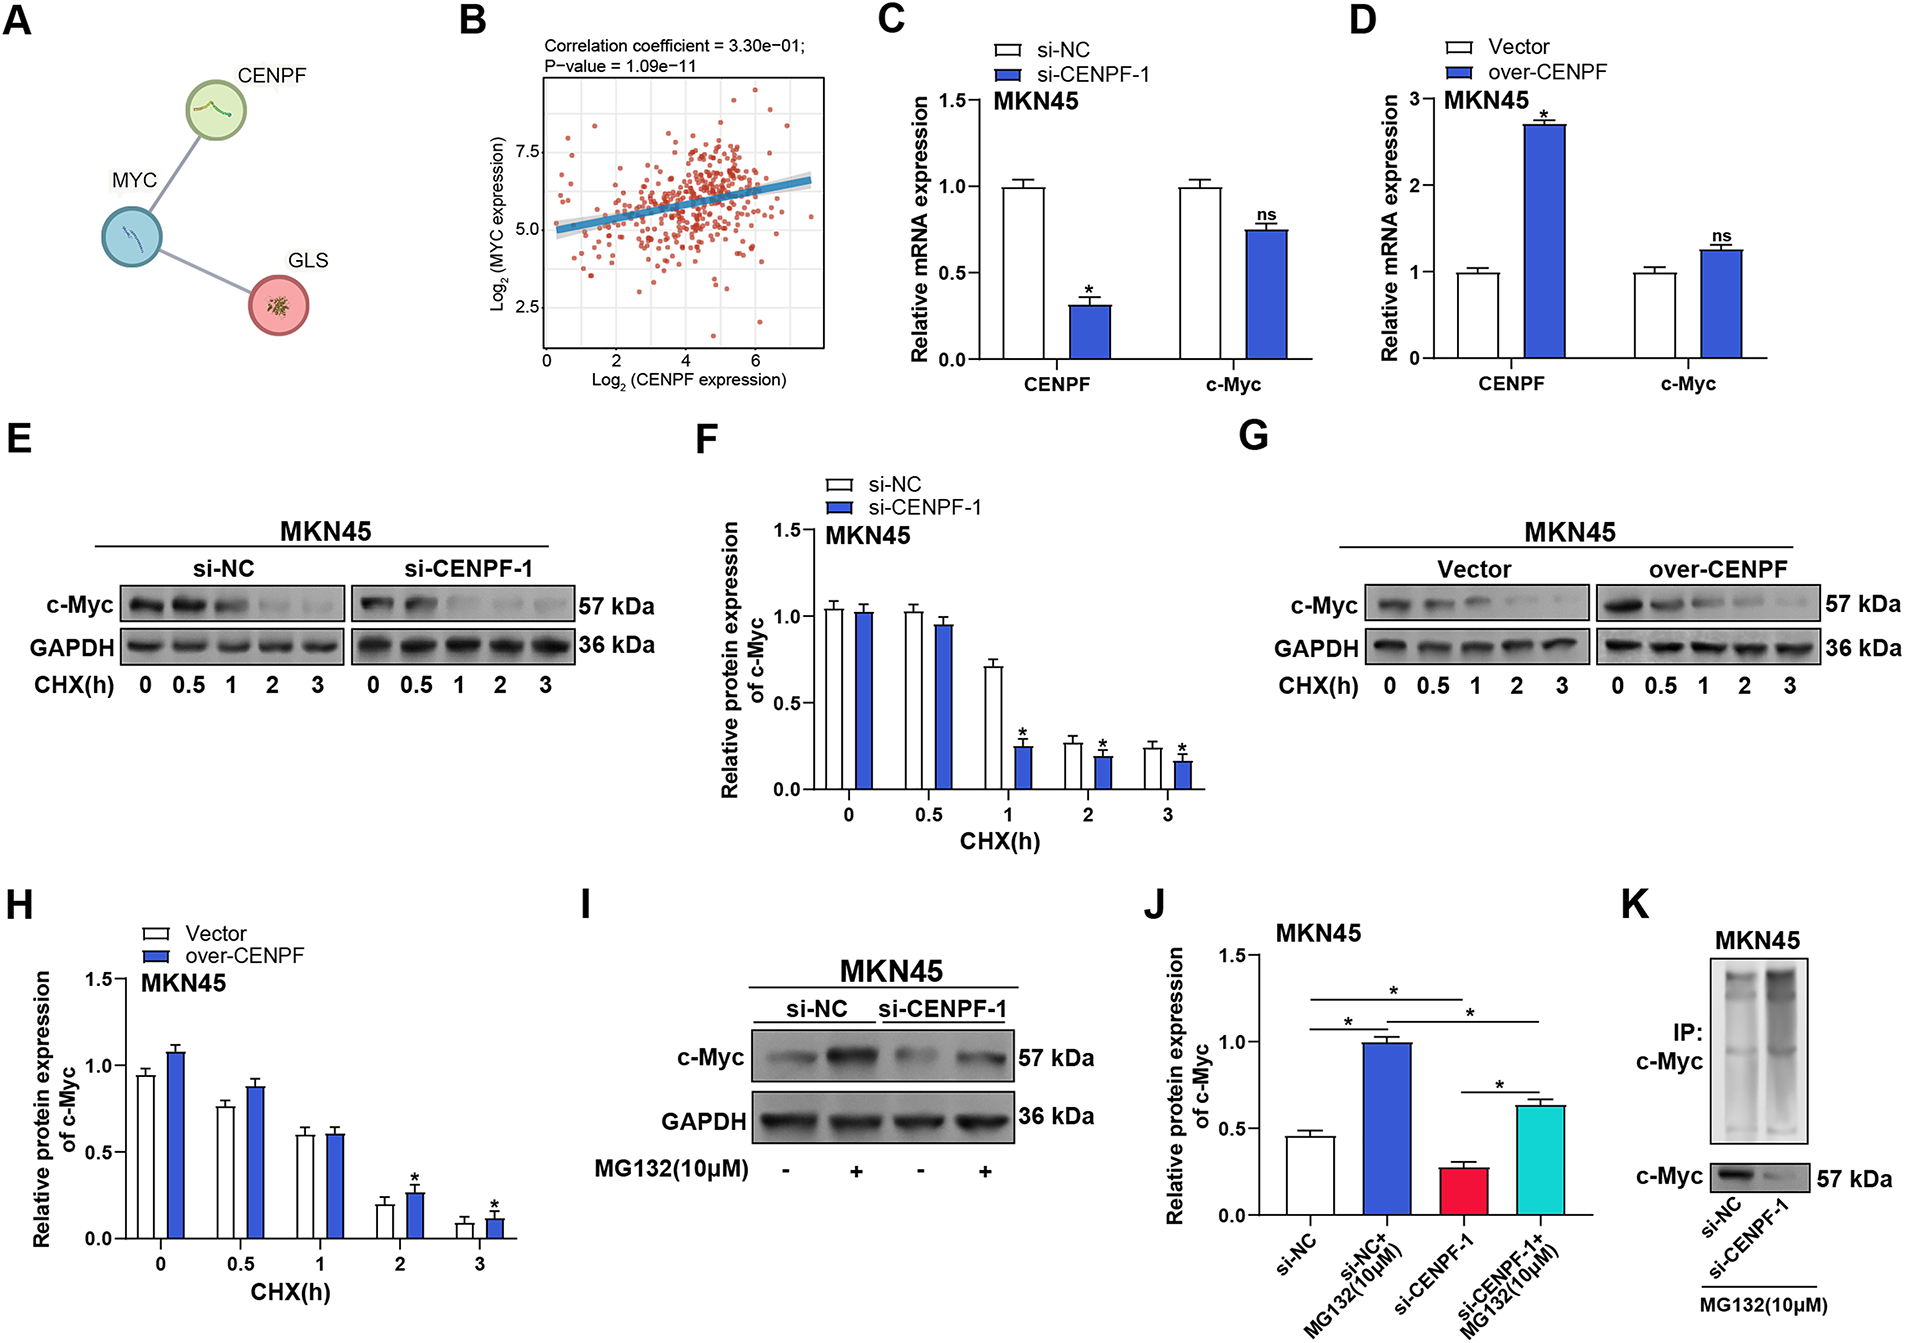
Figure 7: CENPF stabilizes c-Myc by modulating the ubiquitin-proteasome system in GC cells. (A) PPI network analysis showing the interactions between CENPF, c-Myc, and GLS. (B) Correlation analysis based on the TCGA-STAD dataset showing the correlation between CENPF and c-Myc. (C,D) RT-qPCR analysis of the effects of CENPF knockdown (C) or overexpression (D) on the mRNA expression levels of CENPF and c-Myc in MKN45 cells. (E,F) WB analysis of c-Myc degradation in MKN45 cells following CENPF knockdown and CHX treatment for the indicated times (0, 0.5, 1, 2, and 3 h). (G,H) WB analysis of c-Myc degradation in MKN45 cells overexpressing CENPF after CHX treatment at various time points. (I,J) WB analysis of the effects of proteasome inhibitor MG132 and CENPF knockdown on c-Myc protein expression levels in MKN45 cells, with quantification shown in panel (J). (K) Immunoprecipitation analysis of c-Myc ubiquitination in MKN45 cells with CENPF knockdown under MG132 treatment. GC: gastric cancer; PPI: protein-protein interaction; TCGA-STAD: the cancer genome atlas-stomach adenocarcinoma; RT-qPCR: quantitative reverse transcription polymerase chain reaction; CHX: cycloheximide. ns: not significant. *p < 0.05 vs. si-NC or si-NC + MG132 or si-CENPF-1
3.9 CENPF Enhances GC Cell Proliferation by Upregulating GLS1 Expression through c-Myc Activation
The literature by Yang et al. provided potential c-Myc binding sites in the GLS1 promoter region [22]. The direct binding of c-Myc to the GLS promoter in AGS and MKN45 cells was validated by ChIP-qPCR experiments (Fig. 8A). Luciferase reporter assays showed that CENPF knockdown decreased GLS promoter activity, while c-Myc overexpression rescued this effect (Fig. 8B), suggesting a potential interaction between CENPF and c-Myc in regulating gene expression. WB analysis of c-Myc, GLS1, and CENPF protein expression in MKN45 and AGS cells confirmed that CENPF knockdown suppressed the expression of all three proteins, while c-Myc overexpression reversed the effects of CENPF knockdown (Fig. 8C–E). Furthermore, metabolic analysis revealed that the decreased glutamine consumption and glutamate production caused by CENPF knockdown could be reversed by c-Myc overexpression (Fig. 8F,G). To verify the functional relationship between CENPF and GLS, we conducted rescue trials in MKN45 and AGS cells. CCK-8 assays showed that CENPF knockdown suppressed cell proliferation, while GLS overexpression partially restored the proliferation capacity of both cell lines (Fig. 9A,B). Consistent with these findings, colony formation assays showed that the decreased colony formation ability caused by CENPF knockdown could be effectively rescued by GLS overexpression in MKN45 and AGS cells (Fig. 9C,D). These results suggest that CENPF promotes GC cell proliferation by upregulating GLS expression through c-Myc activation, highlighting a critical role in glutamine metabolism.
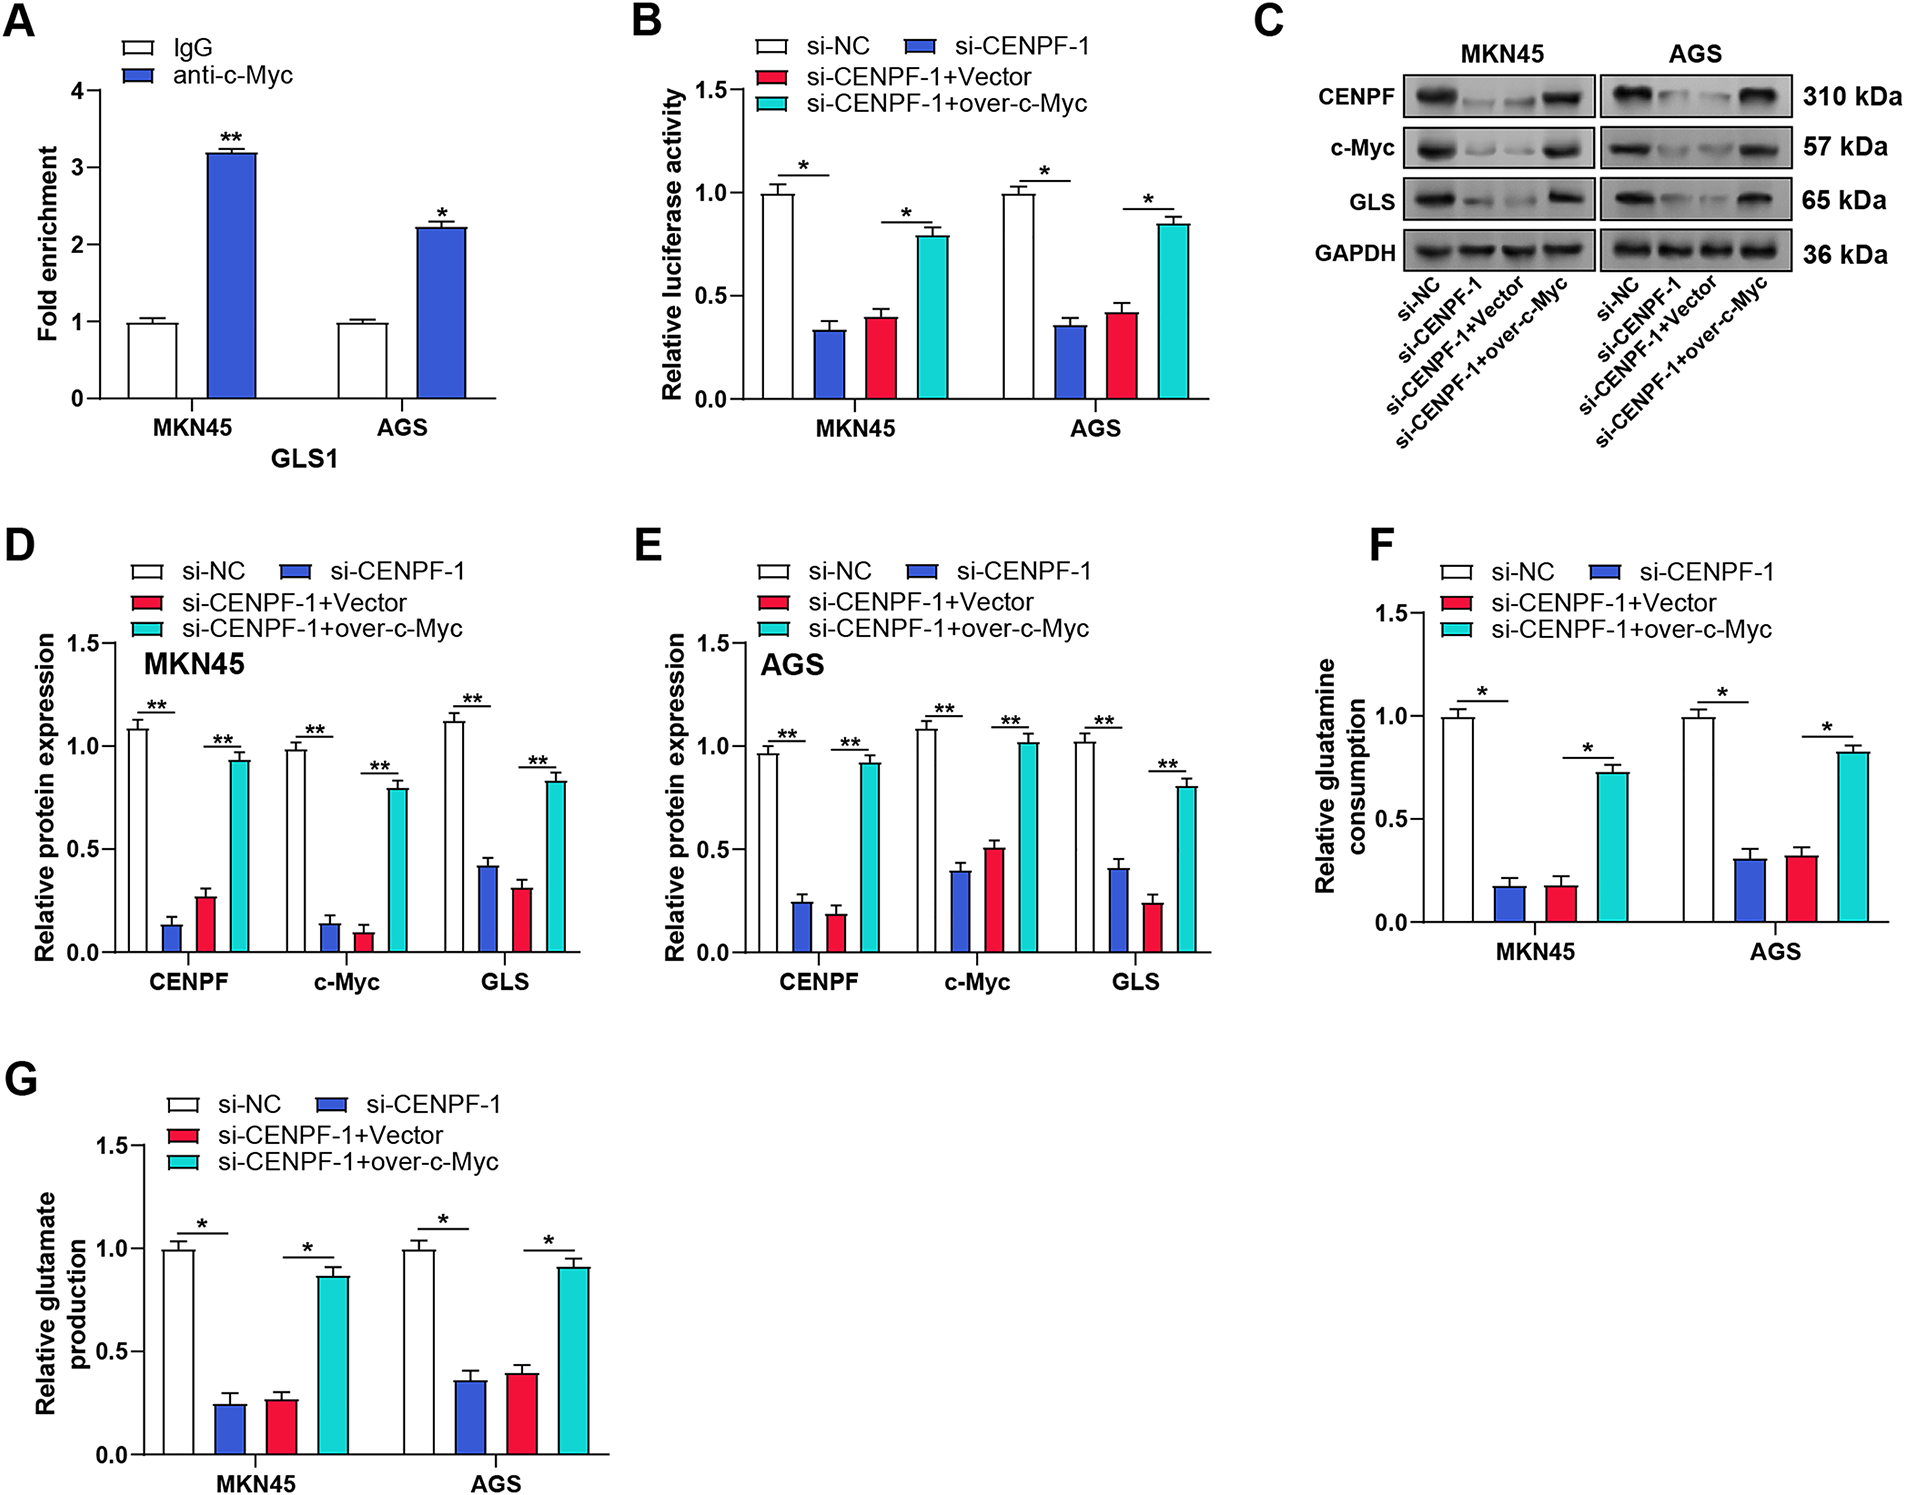
Figure 8: CENPF enhances GLS expression via c-Myc activation in GC cells. (A) ChIP-qPCR analysis of c-Myc binding to the GLS promoter in MKN45 and AGS cells. (B) Luciferase reporter assays showing GLS promoter activity in MKN45 and AGS cells with indicated treatments. (C–E) WB analysis of the effects of CENPF knockdown and c-Myc overexpression on c-Myc, GLS1, and CENPF protein levels in MKN45 and AGS cells. (F) Glutamine consumption assay showing the effects of CENPF knockdown and c-Myc overexpression on glutamine uptake in MKN45 and AGS cells. (G) Glutamate production assay demonstrating the influence of CENPF knockdown and c-Myc overexpression on glutamate generation in MKN45 and AGS cells. GC: gastric cancer; CHIP-qPCR: chromatin immunoprecipitation followed by quantitative polymerase chain reaction. *p < 0.05 vs. IgG or si-NC or si-CENPF-1 + Vector, **p < 0.01 vs. IgG or si-NC or si-CENPF-1 + Vector
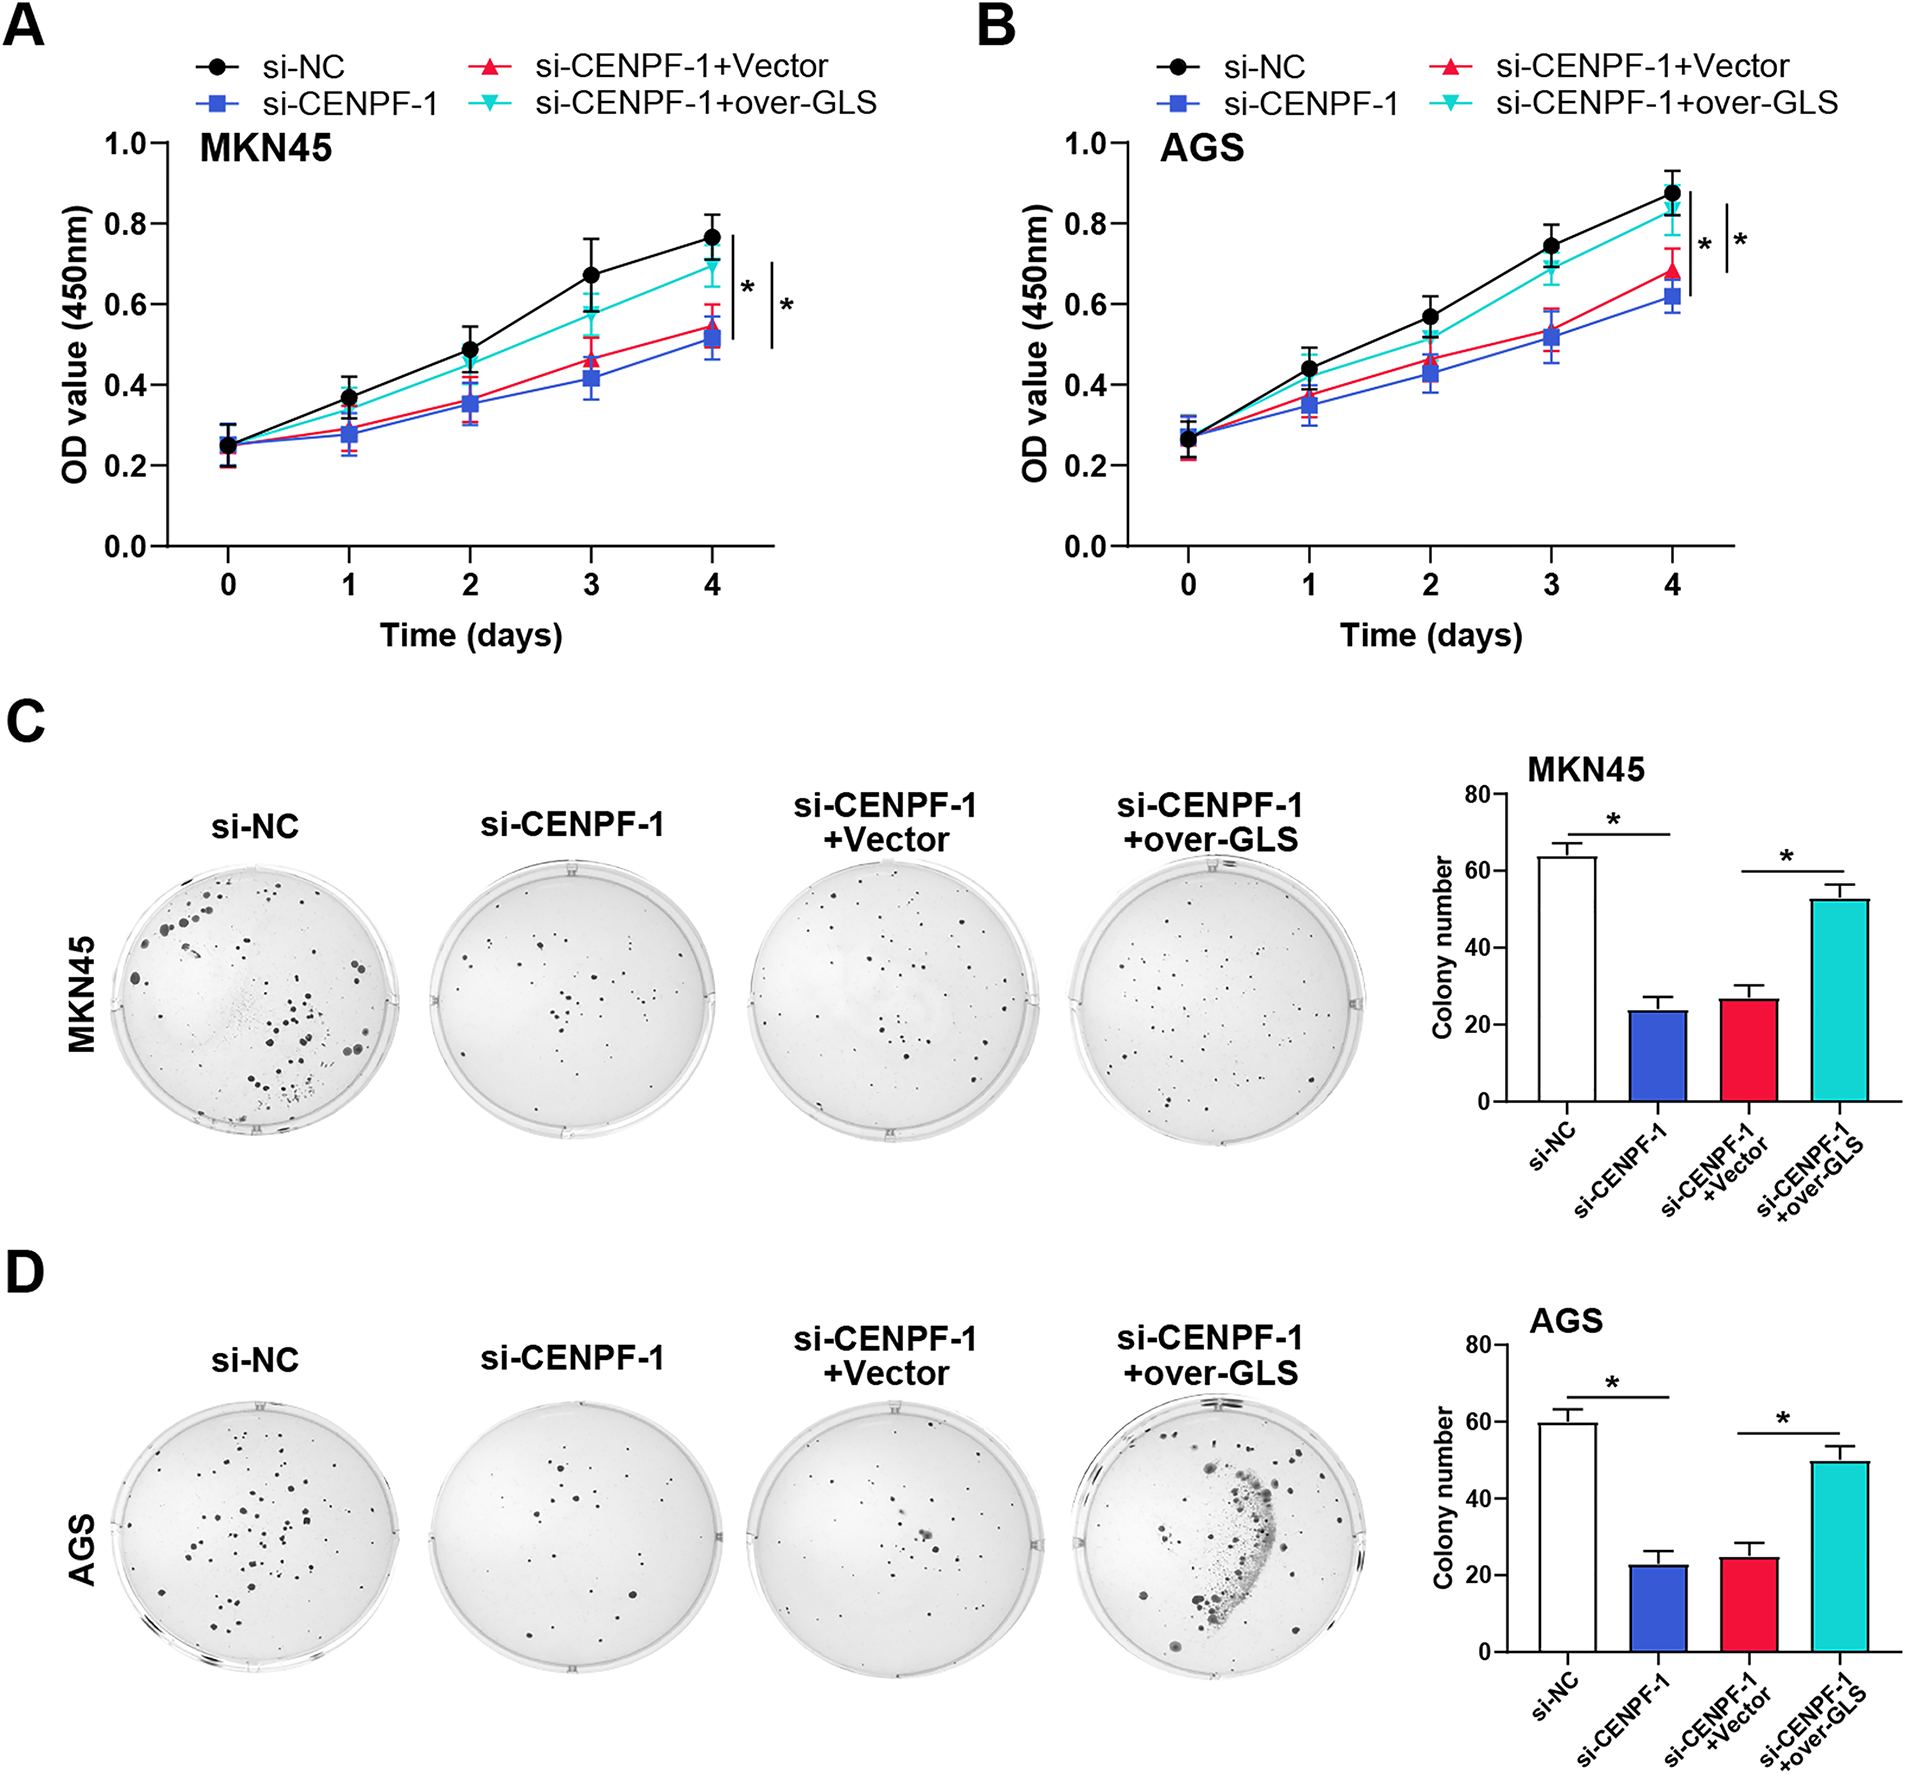
Figure 9: CENPF promotes GC cell proliferation by regulating GLS1 expression. (A,B) CCK-8 assays were performed to assess the effect of CENPF knockdown and GLS overexpression on cell viability in MKN45 (A) and AGS (B) cells. (C,D) Colony formation assays were conducted to evaluate the impact of CENPF knockdown and GLS overexpression on cell proliferation in MKN45 (C) and AGS (D) cells. Images are shown on the left, with corresponding bar graphs representing the cell number on the right. GC: gastric cancer; CCK-8: cell counting kit-8. *p < 0.05 vs. si-NC or si-CENPF-1 + Vector
As a widely prevalent malignant tumor, GC continues to provoke extensive research aimed at uncovering its underlying pathogenesis and identifying effective therapeutic strategies. In this study, differential expression analysis and PPI network analysis were employed to identify ten genes closely associated with GC, including FOXM1, NUF2, SPAG5, and others. Tang et al. demonstrated that FOXM1 enhances the stability of hTERT protein through a non-transcriptional mechanism, which is linked to the poor prognosis and progression of GC [23]. Long et al. showed that a poor prognosis is linked to considerably higher NUF2 expression in GC [24]. NUF2 promotes GC progression by regulating the G2/M transition and inhibiting apoptosis. Furthermore, the NUF2 inhibitor quercetin exhibited potent anti-cancer effects in GC cells and models. A study has found that SPAG5 is linked to a negative outcome and is significantly expressed in GC [25]. Moreover, silencing SPAG5 can inhibit GC cell proliferation, induce apoptosis, and enhance sensitivity to 5-fluorouracil. Furthermore, SPAG5 promotes tumor growth by controlling the PI3K/AKT signaling cascade. In summary, the aberrant expression and functional relevance of these genes emphasize their involvement in GC development and highlight their potential clinical relevance.
CENPF is part of the centrin protein family and is primarily engaged in interactions with microtubules, spindle stability, and the regulation of the cell cycle. Xiao et al. revealed that CENPF is upregulated in endometrial carcinoma (EC) tissues and encourages EC progression by enhancing cell invasion, proliferation, migration, and accelerating the cell cycle [26]. Additionally, CENPF exerts its effects in EC cells by regulation of the PI3K/AKT/mTOR pathway. Xu et al. suggested that the m6A modification of CENPF is regulated by methyltransferase 3, which enhances its mRNA stability through HNRNPA2B1, thereby promoting the role of CENPF in GC [27]. CENPF facilitates GC metastasis by epithelial-to-mesenchymal transition and the CENPF/FAK/MAPK axis, and its high expression is correlated with clinical features in GC patients. Zhao et al. reported that the serum expression levels of CENPF are elevated in advanced gastric cancer patients, while the levels of miR-1-3p are significantly decreased [28]. Both of these factors are associated with prognosis and may serve as risk indicators for GC prognosis. Consistently, our additional analysis of the TCGA-STAD dataset and recent literature evidence indicates that high CENPF expression correlates with poorer overall survival and adverse clinicopathological characteristics not only in gastric cancer but also in other malignancies such as hepatocellular carcinoma, lung cancer, and thyroid carcinoma [29–31]. These findings further support the prognostic value of CENPF across multiple cancer types and reinforce its potential as a biomarker for patient stratification. Consistent with these results, our study showed that CENPF was significantly upregulated in GC cell lines compared with normal gastric epithelial cells, and knockdown of CENPF in GC cells resulted in a significant decrease in their proliferation capacity. These data highlight the pro-proliferative role of CENPF in gastric cancer and suggest its involvement in the maintenance of the malignant phenotype. In addition, after knockdown of CENPF, the apoptosis rate increased, and cells in the G2 phase aggregated. The downregulated expression of key regulatory factors such as c-Myc, Cyclin B1, and CDK1 further confirmed that CENPF promotes GC progression by promoting cell cycle progression and inhibiting apoptotic signaling. These results point to CENPF’s critical carcinogenic function in GC progression, but the specific molecular mechanisms remain to be elucidated.
The reliance on glutamine by tumor cells, often referred to as “glutamine addiction” is a well-established phenomenon wherein tumor cells take up large amounts of glutamine through highly expressed SLC1A5 transporters to support rapid proliferation [32]. Within tumor cells, glutamine is catalyzed by GLS to produce glutamate, which then participates in the tricarboxylic acid (TCA) cycle and the synthesis of GSH [33]. Glutamine and its derivatives (such as glutamate) are elevated in gastric cancer tissues and can be used as markers for early diagnosis or efficacy monitoring. Liu et al. found that RUNX3 can inhibit glutamine metabolism by upregulating circDYRK1A in GC cells, thereby inhibiting cancer progression [34]. In this context, this study performed RNA sequencing and enrichment analysis on GC cells with knockdown of CENPF, revealing a potential link between CENPF and glutamine metabolism. GO-BP and KEGG analyses showed that DEGs were significantly enriched in pathways related to the biosynthesis and transport of amino acids, while GSEA analysis showed that there was a close association between CENPF and alanine, aspartate, and glutamate metabolic pathways. This pathway is a key branch of amino acid metabolism, intersecting with TCA and regulating cell survival under metabolic stress [35]. This means that CENPF may be involved in controlling glutamine addiction in GC, further emphasizing the possibility of intervening in glutamine metabolic targets. Our experimental results further confirmed these mechanisms. CENPF overexpression promoted glutamine metabolism and conferred cell resistance to apoptosis, while these effects were abolished under glutamine-deficient conditions. These results suggest that CENPF promotes GC cell survival by maintaining glutamine-driven metabolic flux.
GLS is the critical enzyme responsible for converting glutamine into glutamate, and its upregulation typically enhances glutamine metabolism in cancer cells, supporting their proliferation and survival [36]. Yu et al. comprehensively reviewed glutamate metabolism and its significance in cancer, particularly focusing on the “kidney-type” GLS1, which is commonly overexpressed in rapidly proliferating cancer cells [37]. Inhibition of GLS1 was proposed as a possible cancer treatment method. Li et al. summarized the processes of glutamine absorption, transport, and metabolism in tumor cells, highlighting its central function in regulating non-essential amino acids (NEAAs), fatty acids, nucleotides, and ATP synthesis [32]. CB-839 is a GLS inhibitor targeting glutamine metabolism. It blocks the conversion of glutamine to glutamate by inhibiting GLS1, thereby interfering with the energy metabolism and biosynthesis of tumor cells. In lung adenocarcinoma, CB-839 combined with the polyamine metabolism drug DENSpm synergistically inhibited tumor growth and enhanced efficacy by blocking glutamine metabolism and GSH synthesis [38]. Our study showed that GLS overexpression restored the proliferation capacity and inhibited apoptosis of CENPF-silenced GC cells, suggesting that GLS is a key downstream effector of CENPF. Conversely, silencing GLS reversed the growth-promoting and anti-apoptotic effects of CENPF overexpression, indicating that the role of CENPF in glutamine metabolism is largely dependent on GLS. This regulatory axis was further validated by using CB-839, an inhibitor that abolished CENPF-mediated enhancement of cell viability and glutamate/α-KG production while promoting apoptosis. These findings suggest that CENPF may modulate glutamine metabolism in GC cells, reinforcing its potential function in cancer progression and offering new perspectives for targeted therapies.
c-Myc acts as a transcriptional regulator that promotes rapid cancer cell growth by regulating various metabolic pathways, particularly those engaged in the metabolism of amino acids, fatty acids, and glucose [39,40]. Zhao et al. demonstrated that glutamine deprivation activates c-Myc, which in turn stimulates the expression of GOT1, maintains GSH synthesis, and inhibits ferroptosis [41]. SMYD2 stabilizes c-Myc by methylation and has been shown to upregulate GLS1 expression, promote glutamine metabolism, and thus enhance the resistance of liver cancer cells to sorafenib [42]. c-Myc-driven glutamine addiction has also been detected in bladder cancer, thereby promoting the malignant progression of cancer [43]. These studies suggest the possibility that c-Myc participates in metabolic reprogramming by regulating GLS1. We demonstrated that CENPF stabilizes c-Myc protein and prolongs its half-life by inhibiting ubiquitin-proteasome-mediated degradation. Our data reveal a positive regulatory axis in which CENPF promotes the stability of c-Myc, c-Myc transactivates GLS1, and the resulting upregulation of GLS1 enhances glutamine decomposition, thereby promoting GC cell proliferation. Functional analysis further validated this regulatory axis. Knockdown of CENPF impaired c-Myc protein stability, downregulated GLS1 expression, and inhibited GC cell proliferation and colony formation. Overexpression of c-Myc or GLS1 reversed these effects, confirming the functional dependency of this pathway. These findings propose that the CENPF-c-Myc-GLS axis is critical to glutamine metabolism and GC progression, offering potential targets for therapeutic intervention. Recent studies have revealed that both CENPF and c-Myc are involved in regulating metabolic reprogramming across multiple cancer types. For instance, CENPF has been reported to promote proliferation and metastasis through cell-cycle and metabolic regulation in prostate and breast cancers [20,44–46]. Meanwhile, c-Myc serves as a master regulator of glutamine metabolism in various malignancies, including hepatocellular carcinoma and colorectal cancer, by upregulating GLS1 and enhancing glutamine utilization [47,48]. Given these findings, the CENPF/c-Myc/GLS axis may represent a common regulatory mechanism underlying tumor growth and metabolic adaptation. Our study extends this concept to gastric cancer, revealing that CENPF enhances glutamine metabolism and tumor progression through the c-Myc/GLS1 signaling cascade. These results not only underscore the critical role of metabolic reprogramming in gastric cancer but also suggest that targeting the CENPF/c-Myc/GLS axis could represent a novel and broadly applicable therapeutic strategy across multiple cancer types.
Recent studies have revealed that CENPF is involved in gastric cancer progression via multiple mechanisms. For example, hnRNPR stabilizes CCNB1/CENPF mRNA to promote GC cell proliferation and metastasis [14], with such studies highlighting CENPF’s role in cell cycle regulation. Our findings expand this understanding by linking CENPF to metabolic regulation, particularly glutamine metabolism, via the CENPF-c-Myc-GLS1 axis. Unlike the hnRNPR-CCNB1/CENPF pathway, which primarily affects cell cycle progression, our study demonstrates that CENPF overexpression enhances glutamine consumption and glutamate production through c-Myc-mediated transcriptional activation of GLS, influencing both proliferation and apoptosis in GC cells. These complementary mechanisms suggest that CENPF exerts multifaceted oncogenic effects, integrating cell cycle control and metabolic reprogramming. As highlighted in Overview of perspectives on cancer, newer therapies, and future directions [49], cancer treatment is shifting toward personalized strategies targeting tumor-specific molecular mechanisms and the tumor immune microenvironment (TIME)—a trend that aligns with our findings on CENPF. The CENPF-c-Myc-GLS1 axis we identified represents a key metabolic vulnerability in GC, especially for patients with high CENPF expression (validated in TCGA-STAD/GEO datasets). Notably, several natural compounds can modulate tumor glutamine metabolism and may offer new avenues to target this axis. Inhibition of c-Myc reduces glutaminolysis and tumor growth [50], while xanthohumol, berberine, and epigallocatechin-3-gallate (EGCG) suppress glutamine uptake or synergize with GLS inhibitors to enhance antitumor efficacy [51–53]. Given that CENPF stabilizes c-Myc and promotes GLS1-mediated glutamine metabolism, these findings suggest that natural products targeting c-Myc or GLS could indirectly attenuate CENPF-driven metabolic reprogramming. Although further experimental validation is needed, natural-product-based modulation of the CENPF–c-Myc–GLS axis represents a potential strategy for metabolic therapy in gastric cancer.
Clinically, targeting the CENPF-c-Myc-GLS1 axis may have translational potential. For instance, the GLS inhibitor CB-839 [54], currently under clinical investigation, could be combined with strategies to inhibit CENPF or c-Myc [22] to suppress glutamine metabolism and tumor growth synergistically. Additionally, CENPF’s correlation with c-Myc (a known regulator of PD-L1) in our TCGA analysis hints at crosstalk with the TIME; combining CENPF inhibitors with immune checkpoint inhibitors (ICIs) may dualistically target metabolic dysregulation and immune suppression, benefiting CENPF-high, ICI-resistant GC patients. This approach not only bridges insights from CENPF’s cell cycle regulatory role and newly identified metabolic function but also aligns with the precision therapy paradigm emphasized in Overview of perspectives on cancer, newer therapies, and future directions [49], offering a tailored, effective direction for GC treatment.
Beyond therapeutic targeting, the clinical utility of CENPF extends to potential applications in non-invasive disease monitoring, a critical frontier in personalized cancer management. Liquid biopsy enables non-invasive cancer monitoring, with EVs and ctDNA emerging as key biomarkers. As highlighted in Updates on liquid biopsies in neuroblastoma for treatment response, relapse and recurrence assessment, 2024 [55], such tools support longitudinal tracking and personalized therapy. Our study identifies CENPF as a GC marker with high diagnostic accuracy (AUC = 0.839 in GSE19826, AUC = 0.823 in GSE27342). If CENPF is detectable in GC patients’ serum EVs or ctDNA, it could serve dual roles: (1) non-invasive early detection (especially in high-risk populations); (2) longitudinal monitoring of CENPF-c-Myc-GLS axis activation to guide therapy (e.g., CB-839 response). Unlike GLS1 (influenced by non-tumor factors), CENPF is GC-specific and correlates with tumor stage, reducing false positives. Future work will validate CENPF in clinical liquid samples to develop actionable GC biopsy panels.
Several limitations should be noted. First, due to limited clinical data, the association between CENPF expression and chemotherapy resistance in gastric cancer patients was not analyzed. Second, mechanistic experiments were performed in a limited number of cell lines, which may restrict the generalizability of our findings. Third, although our results suggest that CENPF stabilizes c-Myc via the proteasome, direct evidence for c-Myc ubiquitination regulation and physical interactions with CENPF is lacking. Finally, the linear presentation of results may overlook potential complexities or negative findings, highlighting the need for further validation in additional cell lines and in vivo models.
In conclusion, our study systematically identified and characterized CENPF as a pivotal oncogenic driver in GC, highlighting its function in promoting cell proliferation, inhibiting apoptosis, and regulating glutamine metabolism. Through comprehensive analysis, we demonstrated that CENPF upregulation was closely associated with key metabolic pathways, including the citric acid cycle and glutamine metabolism, which are essential for GC cell survival and proliferation. In vitro experiments confirmed that CENPF was markedly elevated in GC tissues and cell lines and encouraged cell proliferation and survival. CENPF knockdown induced G2 arrest and reduced the levels of key cell cycle regulators, suggesting a role in cell cycle progression. Mechanistically, CENPF stabilized c-Myc protein by preventing proteasomal degradation, which in turn directly bound to the GLS promoter and enhanced its transcription, thus establishing a regulatory axis connecting CENPF, GLS, and c-Myc in metabolic reprogramming, ultimately leading to increased glutamine metabolism in gastric cancer cells. These outcomes emphasize the prospects of CENPF as a therapeutic target for GC and provide new insights into the metabolic reprogramming of cancer cell proliferation. Future studies should focus on developing strategies to disrupt CENPF-mediated pathways, which may provide new avenues for targeted therapies for gastric cancer treatment.
Acknowledgement: None.
Funding Statement: This study was funded by the Medical and Health Technology Development Program in Shandong Province. Project number: 202303031600.
Author Contributions: Conception and design of the research: Min Dong, Zongchang Song, Xiaohui Lu, Chen Zhong and Minxue Lu. Acquisition of data: Min Dong, Zongchang Song and Xiaohui Lu. Analysis and interpretation of data: Min Dong, Zongchang Song and Xiaohui Lu. Statistical analysis: Minxue Lu. Drafting the manuscript: Min Dong, Zongchang Song and Xiaohui Lu. Revision of manuscript for important intellectual content: Chen Zhong and Minxue Lu. All authors reviewed and approved the final version of the manuscript.
Availability of Data and Materials: The datasets used and/or analyzed during the current study are available from the corresponding author upon reasonable request.
Ethics Approval: Not applicable.
Conflicts of Interest: The authors declare no conflicts of interest.
Appendix A
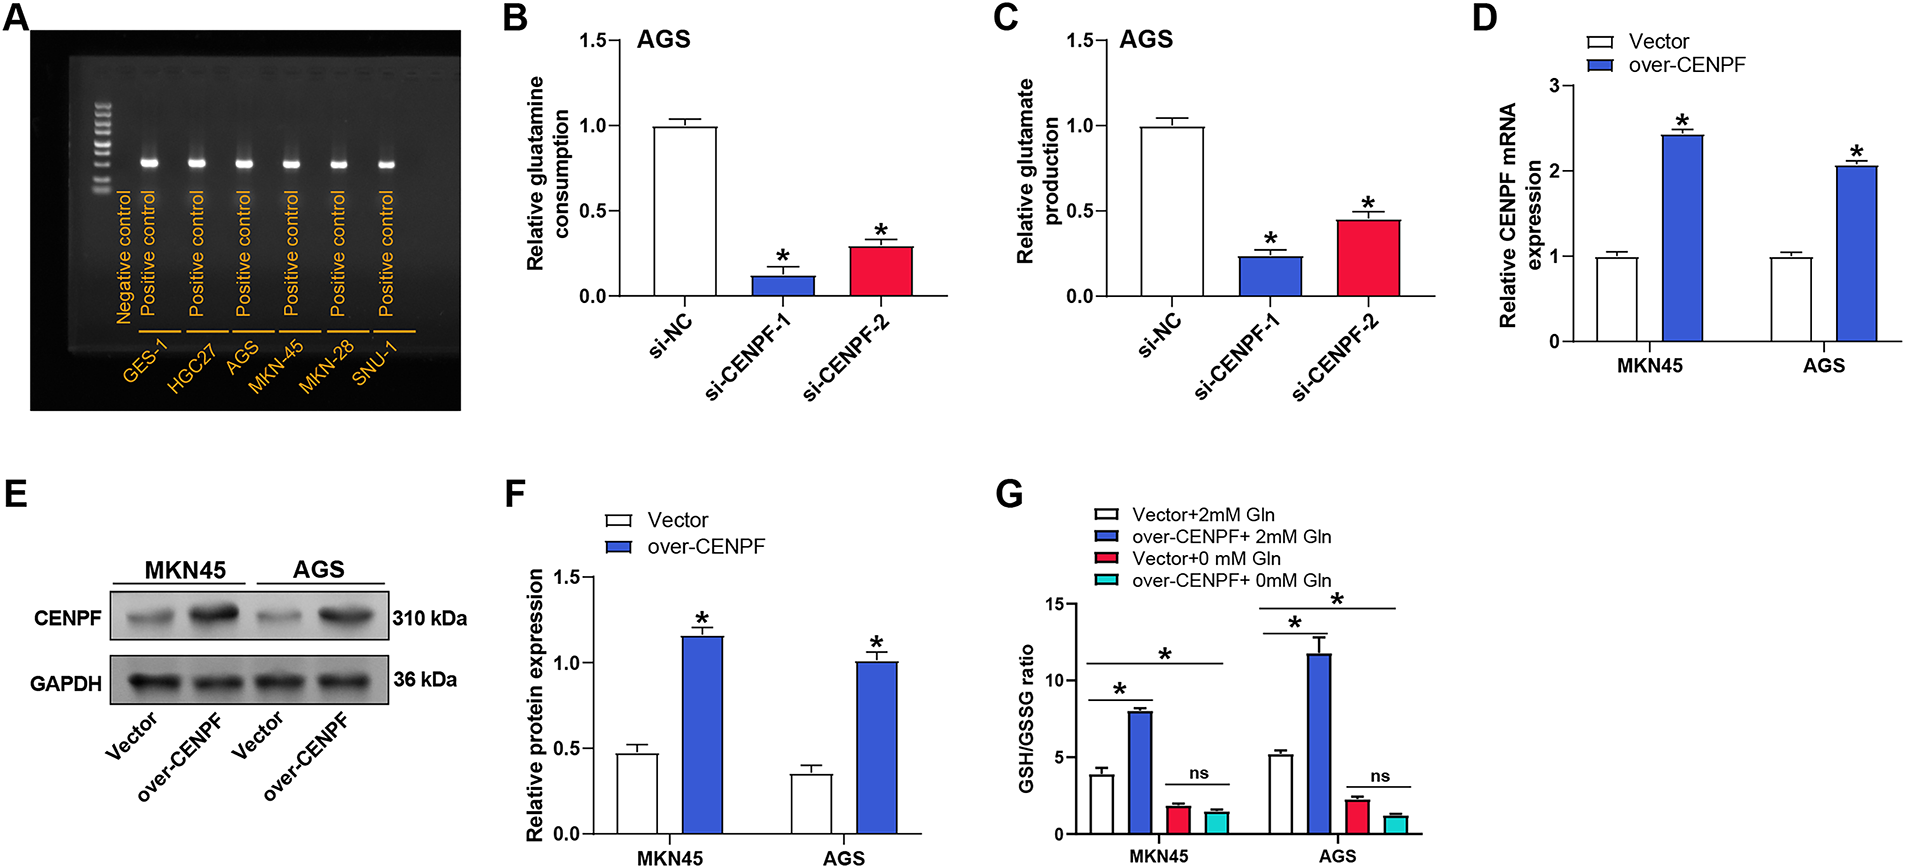
Figure A1: Effect of CENPF overexpression on glutamine consumption, glutamate production, and validation in AGS and MKN45 cells. (A) Mycoplasma detection results of all tested cell lines, including normal gastric epithelial cell line GES-1 and GC cell lines (HGC27, AGS, MKN45, MKN28, and SNU1), via PCR, with no specific bands observed, indicating no mycoplasma contamination. (B) Glutamine consumption assay showing the effect of CENPF knockdown on glutamine uptake in AGS cells. (C) Glutamate production assay demonstrating the impact of CENPF knockdown on glutamate generation in AGS cells. (D) RT-qPCR analysis of CENPF overexpression efficiency in MKN45 and AGS cells transfected with over-CENPF or a negative control vector. (E,F) WB analysis confirms CENPF overexpression efficiency in MKN45 and AGS cells, with quantitative results shown in the bar graphs. (G) RT-qPCR: Reverse transcription quantitative polymerase chain reaction. *p < 0.05 vs. si-NC or Vector or Vector + 2 mM Gln, ns: non-significant
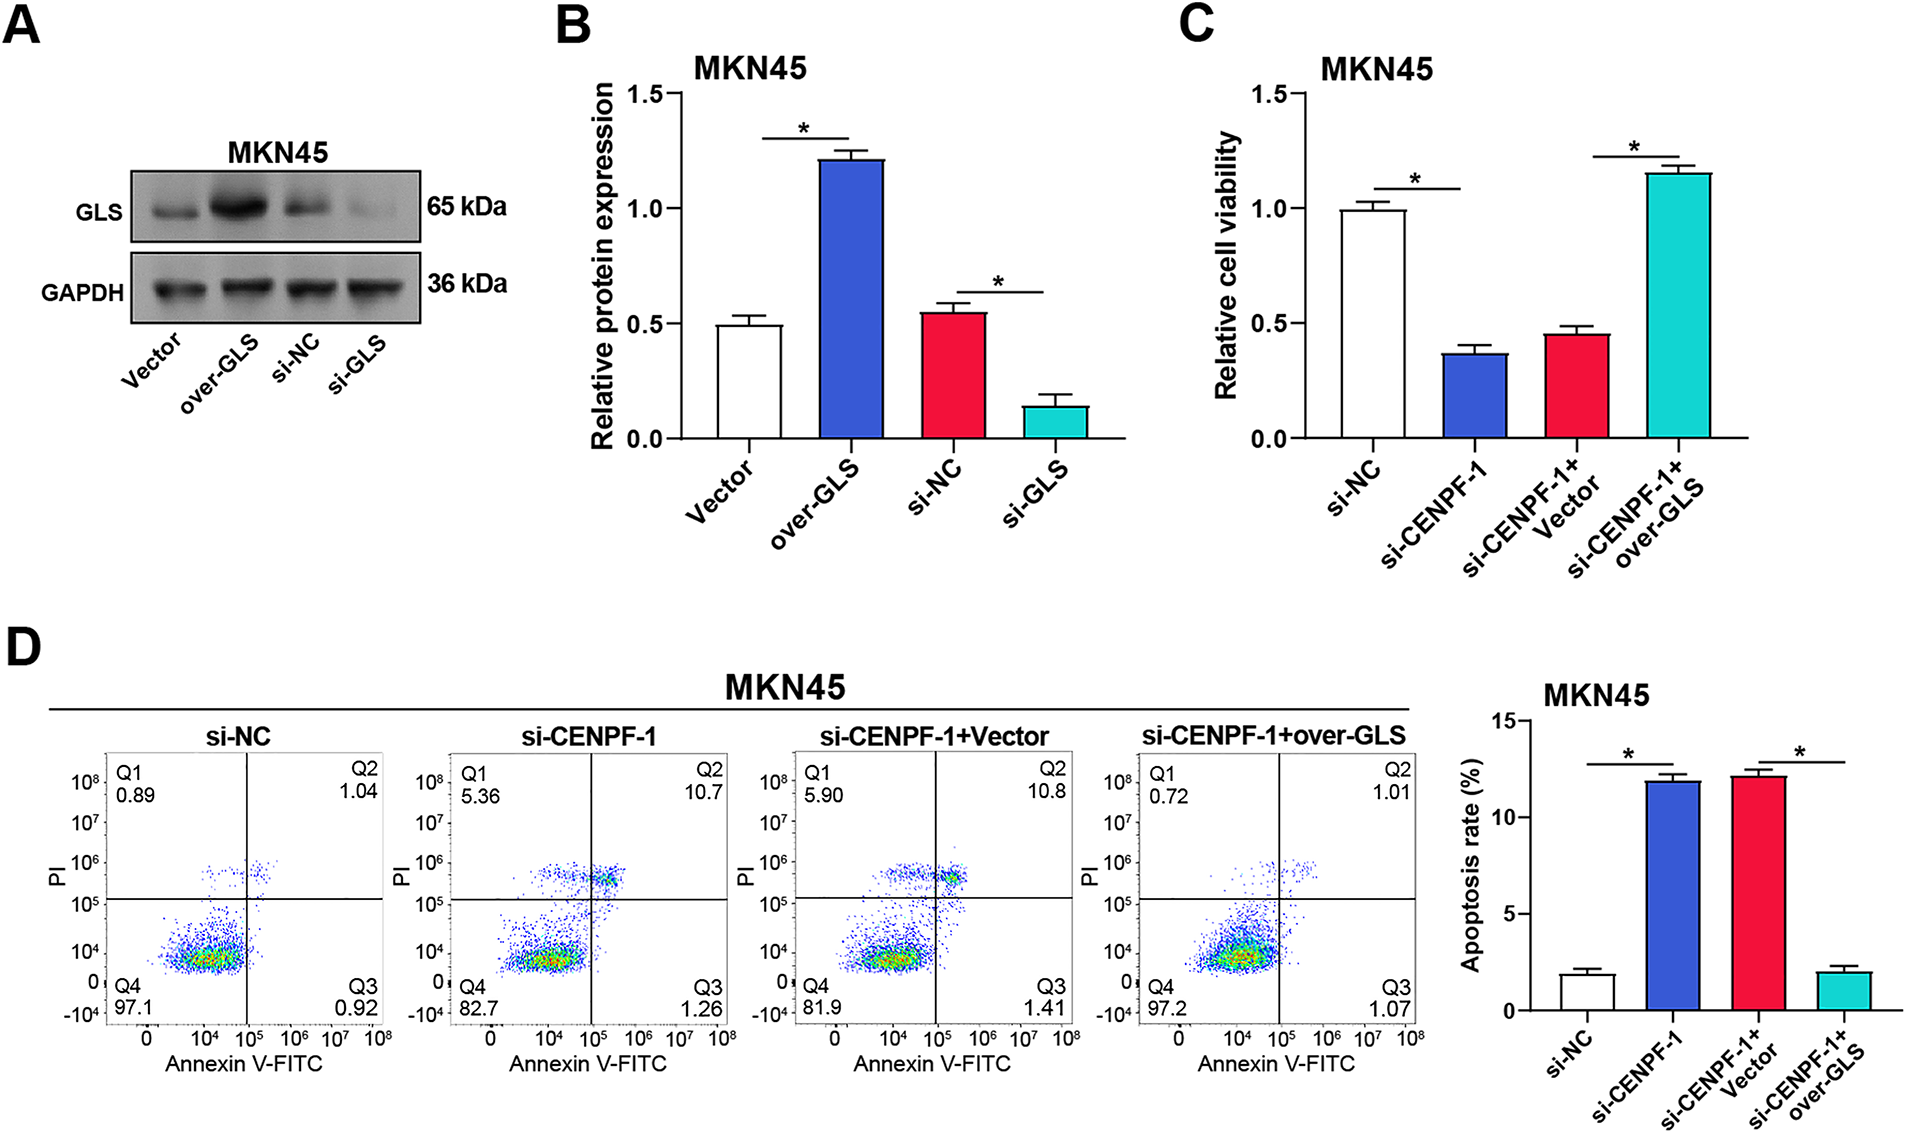
Figure A2: Effect of CENPF knockdown and GLS overexpression on cell viability, apoptosis, and GLS expression in MKN45 cells. (A,B) WB analysis confirming the efficiency of GLS overexpression and knockdown in MKN45 cells, with quantitative results shown in the bar graphs. (C) CCK-8 assay evaluating the impact of CENPF knockdown and GLS overexpression on MKN45 cell viability. (D) Flow cytometry analysis assessing the effect of CENPF knockdown and GLS overexpression on apoptosis in MKN45 cells, with quantitative data presented in the bar graph. CCK-8: cell counting kit-8. *p < 0.05 vs. Vector or si-NC or si-CENPF-1 + Vector
References
1. Yang WJ, Zhao HP, Yu Y, Wang JH, Guo L, Liu JY, et al. Updates on global epidemiology, risk and prognostic factors of gastric cancer. World J Gastroenterol. 2023;29(16):2452–68. doi:10.3748/wjg.v29.i16.2452. [Google Scholar] [PubMed] [CrossRef]
2. Thrift AP, Wenker TN, El-Serag HB. Global burden of gastric cancer: epidemiological trends, risk factors, screening and prevention. Nat Rev Clin Oncol. 2023;20(5):338–49. doi:10.1038/s41571-023-00747-0. [Google Scholar] [PubMed] [CrossRef]
3. Kumar S, Patel GK, Ghoshal UC. Helicobacter pylori-induced inflammation: possible factors modulating the risk of gastric cancer. Pathogens. 2021;10(9):1099. doi:10.3390/pathogens10091099. [Google Scholar] [PubMed] [CrossRef]
4. Sundar R, Nakayama I, Markar SR, Shitara K, van Laarhoven HWM, Janjigian YY, et al. Gastric cancer. Lancet. 2025;405(10494):2087–102. doi:10.1016/S0140-6736(25)00052-2. [Google Scholar] [PubMed] [CrossRef]
5. Yoo HC, Han JM. Amino acid metabolism in cancer drug resistance. Cells. 2022;11(1):140. doi:10.3390/cells11010140. [Google Scholar] [PubMed] [CrossRef]
6. Deters BJ, Saleem M. The role of glutamine in supporting gut health and neuropsychiatric factors. Food Sci Hum Wellness. 2021;10(2):149–54. doi:10.1016/j.fshw.2021.02.003. [Google Scholar] [CrossRef]
7. Li S, Wen X, Yang X, Wang L, Gao K, Liang X, et al. Glutamine protects intestinal immunity through microbial metabolites rather than microbiota. Int Immunopharmacol. 2023;124(Pt A):110832. doi:10.1016/j.intimp.2023.110832. [Google Scholar] [PubMed] [CrossRef]
8. Wang D, Wan X. Progress in research on the role of amino acid metabolic reprogramming in tumour therapy: a review. Biomed Pharmacother. 2022;156(9):113923. doi:10.1016/j.biopha.2022.113923. [Google Scholar] [PubMed] [CrossRef]
9. Li W, Zhong Q, Deng N, Wang H, Ouyang J, Guan Z, et al. Identification of a novel prognostic model for gastric cancer utilizing glutamine-related genes. Heliyon. 2024;10(19):e37985. doi:10.1016/j.heliyon.2024.e37985. [Google Scholar] [PubMed] [CrossRef]
10. Kotsari M, Dimopoulou V, Koskinas J, Armakolas A. Immune system and hepatocellular carcinoma (HCCnew insights into HCC progression. Int J Mol Sci. 2023;24(14):11471. doi:10.3390/ijms241411471. [Google Scholar] [PubMed] [CrossRef]
11. Hu X, Ma Z, Xu B, Li S, Yao Z, Liang B, et al. Glutamine metabolic microenvironment drives M2 macrophage polarization to mediate trastuzumab resistance in HER2-positive gastric cancer. Cancer Commun. 2023;43(8):909–37. doi:10.1002/cac2.12459. [Google Scholar] [PubMed] [CrossRef]
12. Huang Y, Chen X, Wang L, Wang T, Tang X, Su X. Centromere protein F (CENPF) serves as a potential prognostic biomarker and target for human hepatocellular carcinoma. J Cancer. 2021;12(10):2933–51. doi:10.7150/jca.52187. [Google Scholar] [PubMed] [CrossRef]
13. Tan F, Tang Y, He Z. Role of CCNB1, CENPF, and neutrophils in lung cancer diagnosis and prognosis. Medicine. 2023;102(46):e35802. doi:10.1097/MD.0000000000035802. [Google Scholar] [PubMed] [CrossRef]
14. Chen EB, Qin X, Peng K, Li Q, Tang C, Wei YC, et al. HnRNPR-CCNB1/CENPF axis contributes to gastric cancer proliferation and metastasis. Aging. 2019;11(18):7473–91. doi:10.18632/aging.102254. [Google Scholar] [PubMed] [CrossRef]
15. Michalak M, Warnken U, Schnölzer M, Gabius HJ, Kopitz J. Detection of malignancy-associated phosphoproteome changes in human colorectal cancer induced by cell surface binding of growth-inhibitory galectin-4. IUBMB Life. 2019;71(3):364–75. doi:10.1002/iub.1987. [Google Scholar] [PubMed] [CrossRef]
16. Bin YL, Hu HS, Tian F, Wen ZH, Yang MF, Wu BH, et al. Metabolic reprogramming in gastric cancer: trojan horse effect. Front Oncol. 2022;11:745209. doi:10.3389/fonc.2021.745209. [Google Scholar] [PubMed] [CrossRef]
17. Ni Q, Yu J, Niu Y, Han Z, Hu B, Wang Y, et al. Single-cell transcriptomic data reveal the cellular heterogeneity of glutamine metabolism in gastric premalignant lesions and early gastric cancer. Acta Biochim Biophys Sin. 2025;57(10):1670–83. doi:10.3724/abbs.2025061. [Google Scholar] [PubMed] [CrossRef]
18. Capes-Davis A, Theodosopoulos G, Atkin I, Drexler HG, Kohara A, MacLeod RAF, et al. Check your cultures! A list of cross-contaminated or misidentified cell lines. Int J Cancer. 2010;127(1):1–8. doi:10.1002/ijc.25242. [Google Scholar] [PubMed] [CrossRef]
19. Rao X, Huang X, Zhou Z, Lin X. An improvement of the 2–ΔΔCT method for quantitative real-time polymerase chain reaction data analysis. Biostat Bioinforma Biomath. 2013;3(3):71–85. doi:10.1089/cmb.2012.0279. [Google Scholar] [PubMed] [CrossRef]
20. Shahid M, Kim M, Lee MY, Yeon A, You S, Kim HL, et al. Downregulation of CENPF remodels prostate cancer cells and alters cellular metabolism. Proteomics. 2019;19(11):e1900038. doi:10.1002/pmic.201900038. [Google Scholar] [PubMed] [CrossRef]
21. Shen YA, Hong J, Asaka R, Asaka S, Hsu FC, Suryo Rahmanto Y, et al. Inhibition of the MYC-regulated glutaminase metabolic axis is an effective synthetic lethal approach for treating chemoresistant ovarian cancers. Cancer Res. 2020;80(20):4514–26. doi:10.1158/0008-5472.CAN-19-3971. [Google Scholar] [PubMed] [CrossRef]
22. Yang J, Chen F, Lang L, Yang F, Fu Z, Martinez J, et al. Therapeutic targeting of the GLS1-c-Myc positive feedback loop suppresses glutaminolysis and inhibits progression of head and neck cancer. Cancer Res. 2024;84(19):3223–34. doi:10.1158/0008-5472.CAN-24-0254. [Google Scholar] [PubMed] [CrossRef]
23. Tang Q, Liu C, Zhang S, He L, Liu Y, Wang J, et al. FOXM1 increases hTERT protein stability and indicates poor prognosis in gastric cancer. Neoplasia. 2023;36:100863. doi:10.1016/j.neo.2022.100863. [Google Scholar] [PubMed] [CrossRef]
24. Long B, Zhou H, Xiao L, Jiang X, Li J, Ma Z, et al. Targeting NUF2 suppresses gastric cancer progression through G2/M phase arrest and apoptosis induction. Chin Med J. 2024;137(20):2437–51. doi:10.1097/CM9.0000000000003006. [Google Scholar] [PubMed] [CrossRef]
25. An J, Yang L, Pan Y, He Y, Xie H, Tao Y, et al. SPAG5 activates PI3K/AKT pathway and promotes the tumor progression and chemo-resistance in gastric cancer. DNA Cell Biol. 2022;41(10):893–902. doi:10.1089/dna.2021.0531. [Google Scholar] [PubMed] [CrossRef]
26. Xiao H, Zhang Za, Wey C. CENPF facilitates endometrial cancer cell progression through PI3K/AKT/mTOR pathway. Eur J Gynaecol Oncol. 2023;44(1):106–14. doi:10.22514/ejgo.2023.013. [Google Scholar] [CrossRef]
27. Xu P, Yang J, Chen Z, Zhang X, Xia Y, Wang S, et al. N6-methyladenosine modification of CENPF mRNA facilitates gastric cancer metastasis via regulating FAK nuclear export. Cancer Commun. 2023;43(6):685–705. doi:10.1002/cac2.12443. [Google Scholar] [PubMed] [CrossRef]
28. Zhao J, Liu S, Zhang G, Shen Y, Fengchen L, Bing X. Expression of CENPF and miR-1-3p in the serum of patients with advanced gastric cancer and their correlation with prognosis. J Pract Med. 2024;40(3):365–70. (In Chinese). doi:10.5230/jgc.2019.19.e28. [Google Scholar] [PubMed] [CrossRef]
29. Gudivada IP, Amajala KC. Integrative bioinformatics analysis for targeting hub genes in hepatocellular carcinoma treatment. Curr Genomics. 2025;26(1):48–80. doi:10.2174/0113892029308243240709073945. [Google Scholar] [PubMed] [CrossRef]
30. Treviño-Juarez AS, Gonzalez-Gonzalez JG, Rodriguez-Gutierrez R, Sanchez-Garcia A, Gonzalez-Velazquez CD. Integrative bioinformatic analysis identifies differentially expressed gene targets as potential biomarkers for anaplastic thyroid cancer. J Egypt Natl Canc Inst. 2025;37(1):16. doi:10.1186/s43046-025-00282-2. [Google Scholar] [PubMed] [CrossRef]
31. Yu Y, Li L, Luo B, Chen D, Yin C, Jian C, et al. Predicting potential therapeutic targets and small molecule drugs for early-stage lung adenocarcinoma. Biomed Pharmacother. 2024;174(4):116528. doi:10.1016/j.biopha.2024.116528. [Google Scholar] [PubMed] [CrossRef]
32. Li X, Peng X, Li Y, Wei S, He G, Liu J, et al. Glutamine addiction in tumor cell: oncogene regulation and clinical treatment. Cell Commun Signal. 2024;22(1):12. doi:10.1186/s12964-023-01449-x. [Google Scholar] [PubMed] [CrossRef]
33. Zhong X, He Z, Yin L, Fan Y, Tong Y, Kang Y, et al. Glutamine metabolism in tumor metastasis: genes, mechanisms and the therapeutic targets. Heliyon. 2023;9(10):e20656. doi:10.1016/j.heliyon.2023.e20656. [Google Scholar] [PubMed] [CrossRef]
34. Liu H, Xue Q, Cai H, Jiang X, Cao G, Chen T, et al. RUNX3-mediated circDYRK1A inhibits glutamine metabolism in gastric cancer by up-regulating microRNA-889-3p-dependent FBXO4. J Transl Med. 2022;20(1):120. doi:10.1186/s12967-022-03286-x. [Google Scholar] [PubMed] [CrossRef]
35. Todisco S, Convertini P, Iacobazzi V, Infantino V. TCA cycle rewiring as emerging metabolic signature of hepatocellular carcinoma. Cancers. 2020;12(1):68. doi:10.3390/cancers12010068. [Google Scholar] [PubMed] [CrossRef]
36. De Los Santos-Jiménez J, Campos-Sandoval JA, Alonso FJ, Márquez J, Matés JM. GLS and GLS2 glutaminase isoenzymes in the antioxidant system of cancer cells. Antioxidants. 2024;13(6):745. doi:10.3390/antiox13060745. [Google Scholar] [PubMed] [CrossRef]
37. Yu W, Yang X, Zhang Q, Sun L, Yuan S, Xin Y. Targeting GLS1 to cancer therapy through glutamine metabolism. Clin Transl Oncol. 2021;23(11):2253–68. doi:10.1007/s12094-021-02645-2. [Google Scholar] [PubMed] [CrossRef]
38. Han X, Wang D, Yang L, Wang N, Shen J, Wang J, et al. Activation of polyamine catabolism promotes glutamine metabolism and creates a targetable vulnerability in lung cancer. Proc Natl Acad Sci U S A. 2024;121(13):e2319429121. doi:10.1073/pnas.2319429121. [Google Scholar] [PubMed] [CrossRef]
39. Prieto J, García-Cañaveras JC, León M, Sendra R, Ponsoda X, Izpisúa Belmonte JC, et al. C-MYC triggers lipid remodelling during early somatic cell reprogramming to pluripotency. Stem Cell Rev Rep. 2021;17(6):2245–61. doi:10.1007/s12015-021-10239-2. [Google Scholar] [PubMed] [CrossRef]
40. Chiodi I, Perini C, Berardi D, Mondello C. Asparagine sustains cellular proliferation and c-Myc expression in glutamine-starved cancer cells. Oncol Rep. 2021;45(6):1–12. doi:10.3892/or.2021.8047. [Google Scholar] [PubMed] [CrossRef]
41. Zhao Y, Wang Y, Miao Z, Liu Y, Yang Q. C-Myc protects hepatocellular carcinoma cell from ferroptosis induced by glutamine deprivation via upregulating GOT1 and Nrf2. Mol Biol Rep. 2023;50(8):6627–41. doi:10.1007/s11033-023-08495-1. [Google Scholar] [PubMed] [CrossRef]
42. Xu K, Ding J, Zhou L, Li D, Luo J, Wang W, et al. SMYD2 promotes hepatocellular carcinoma progression by reprogramming glutamine metabolism via c-Myc/GLS1 axis. Cells. 2022;12(1):25. doi:10.3390/cells12010025. [Google Scholar] [PubMed] [CrossRef]
43. Huang Z, Liu B, Li X, Jin C, Hu Q, Zhao Z, et al. RUNX2 enhances bladder cancer progression by promoting glutamine metabolism. Neoplasia. 2025;60:101120. doi:10.1016/j.neo.2024.101120. [Google Scholar] [PubMed] [CrossRef]
44. Shahid M, Lee MY, Piplani H, Andres AM, Zhou B, Yeon A, et al. Centromere protein F (CENPFa microtubule binding protein, modulates cancer metabolism by regulating pyruvate kinase M2 phosphorylation signaling. Cell Cycle. 2018;17(24):2802–18. doi:10.1080/15384101.2018.1557496. [Google Scholar] [PubMed] [CrossRef]
45. Zhou M, Li X, Wang W, Wu J, Tan J. PSMD14/E2F1 axis-mediated CENPF promotes the metastasis of triple-negative breast cancer through inhibiting ferroptosis. Cancer Sci. 2025;116(8):2281–95. doi:10.1111/cas.70064. [Google Scholar] [PubMed] [CrossRef]
46. Wang D, Xu W, Huang M, Ma W, Liu Y, Zhou X, et al. CENPF knockdown inhibits adriamycin chemoresistance in triple-negative breast cancer via the Rb-E2F1 axis. Sci Rep. 2023;13(1):1803. doi:10.1038/s41598-023-28355-z. [Google Scholar] [PubMed] [CrossRef]
47. Duan R, Zhai Y, Wang Q, Zhao L, Wang Y, Yu N, et al. LINC01764 promotes colorectal cancer cells proliferation, metastasis, and 5-fluorouracil resistance by regulating glucose and glutamine metabolism via promoting c-MYC translation. MedComm. 2024;5(11):e70003. doi:10.1002/mco2.70003. [Google Scholar] [PubMed] [CrossRef]
48. Zeng Y, Jiang H, Zhang X, Xu J, Wu X, Xu Q, et al. Canagliflozin reduces chemoresistance in hepatocellular carcinoma through PKM2-c-Myc complex-mediated glutamine starvation. Free Radic Biol Med. 2023;208(9):571–86. doi:10.1016/j.freeradbiomed.2023.09.006. [Google Scholar] [PubMed] [CrossRef]
49. Joshi RM, Telang B, Soni G, Khalife A. Overview of perspectives on cancer, newer therapies, and future directions. Oncol Transl Med. 2024;10(3):105–9. doi:10.1097/ot9.0000000000000039. [Google Scholar] [CrossRef]
50. Kleszcz R, Paluszczak J, Krajka-Kuźniak V, Baer-Dubowska W. The inhibition of c-MYC transcription factor modulates the expression of glycolytic and glutaminolytic enzymes in FaDu hypopharyngeal carcinoma cells. Adv Clin Exp Med. 2018;27(6):735–42. doi:10.17219/acem/68979. [Google Scholar] [PubMed] [CrossRef]
51. Zhang P, Wang Q, Lin Z, Yang P, Dou K, Zhang R. Berberine inhibits growth of liver cancer cells by suppressing glutamine uptake. Onco Targets Ther. 2019;12:11751–63. doi:10.2147/OTT.S235667. [Google Scholar] [PubMed] [CrossRef]
52. Carmo F, Silva C, Martel F. Inhibition of glutamine cellular uptake contributes to the cytotoxic effect of xanthohumol in triple-negative breast cancer cells. Nutr Cancer. 2022;74(9):3413–30. doi:10.1080/01635581.2022.2076889. [Google Scholar] [PubMed] [CrossRef]
53. Li C, Feng Y, Wang W, Xu L, Zhang M, Yao Y, et al. Targeting glutaminolysis to treat multiple myeloma: an in vitro evaluation of glutaminase inhibitors telaglenastat and epigallocatechin-3-gallate. Anticancer Agents Med Chem. 2023;23(7):779–85. doi:10.2174/1871520622666220905142338. [Google Scholar] [PubMed] [CrossRef]
54. Yang WH, Qiu Y, Stamatatos O, Janowitz T, Lukey MJ. Enhancing the efficacy of glutamine metabolism inhibitors in cancer therapy. Trends Cancer. 2021;7(8):790–804. doi:10.1016/j.trecan.2021.04.003. [Google Scholar] [PubMed] [CrossRef]
55. Jahangiri L. Updates on liquid biopsies in neuroblastoma for treatment response, relapse and recurrence assessment. Cancer Genet. 2024;288(2):32–9. doi:10.1016/j.cancergen.2024.09.001. [Google Scholar] [PubMed] [CrossRef]
Cite This Article
 Copyright © 2026 The Author(s). Published by Tech Science Press.
This work is licensed under a Creative Commons Attribution 4.0 International License , which permits unrestricted use, distribution, and reproduction in any medium, provided the original work is properly cited.
 Downloads
 Citation Tools