
 Submit a Paper
 Propose a Special lssue
 Open Access
ARTICLE
Transcriptome Analysis and Genes Function Verification of Root Development of Paeonia suffruticosa under Sandy Loam Cultivation
1 College of Landscape Architecture and Art, Henan Agricultural University, Zhengzhou, 450002, China
2 School of Horticulture Landscape Architecture, Henan Institute of Science and Technology, Xinxiang, 453003, China
3 College of Forestry, Hainan University, Haikou, 570228, China
* Corresponding Authors: Zheng Wang. Email: ; Songlin He. Email:
# Contributed equally to this work and are co-first authors
Phyton-International Journal of Experimental Botany 2022, 91(12), 2791-2812. https://doi.org/10.32604/phyton.2022.023572
Received 03 May 2022; Accepted 06 June 2022; Issue published 29 August 2022
 View Full Text
 Download PDF
Abstract
Relatively poor in vitro rooting has limited the large-scale commercial production of tree peony. In this study, on the basis of transcriptome sequencing, differentially expressed genes and the associated metabolic pathways were identified in tree peony roots at different stages of root formation under sandy loam cultivation. A total of 31.63 Gb raw data were generated and 120,188 unigenes (mean length of 911.98 bp) were annotated according to six databases (NR, NT, GO, KEGG, COG, and Swiss-Prot). Analyses of the ungerminated root primordium period, induced root primordium period, and root formation period detected 8,232, 6,907, and 10,687 differentially expressed genes related to 133, 132, and 133 metabolic pathways, respectively. Two significantly differentially expressed genes (Unigene13430_All and CL10096.Contig1_All) were associated with the auxin pathway. The full-length Unigene13430_All coding sequence (843 bp) encoded 280 amino acids, whereas the full-length CL10096.Contig1_All coding sequence (1,470 bp) encoded 489 amino acids. Unigene13430_All and CL10096.Contig1_All were identified as IAA gene family members and were respectively named PsIAA27 and PsARF19. The qRT-PCR analysis and functional verification indicated that the expressions of PsARF19 and PsIAA27 in tree peony seedlings, cuttings and grafted seedlings were significant different. PsARF19 promoted root development, it might be a regulatory gene related to the formation of tree peony roots, while PsIAA27 inhibited lateral root development, and it might be involved in controlling auxin sensitivity during root formation. The results of this study may form the basis of future investigations on the mechanism mediating peony root formation. The transcriptome data will be an excellent resource for researchers interested in characterizing the rooting-related tree peony genes.Keywords
Supplementary Material
Supplementary Material FileTree peony, which is a deciduous subshrub in the family Paeoniaceae, produces large and brightly colored flowers. In China, it is a popular traditional flower that has high ornamental and medicinal values [1,2]. Traditionally, peony is mainly propagated by cuttings and grafting, both of which can take root effectively, and the best performance is in sandy loam soil [3,4]. The advantages of plant tissue culture include rapid reproduction, high multiplication coefficient, short cycle, and retention of the excellent traits of the mother plant. Accordingly, it has recently been widely used for the rapid reproduction of tree peony [5,6]. However, there are several problems associated with tree peony test-tube seedlings (e.g., poor induction of roots, low rooting rate, low quality of the roots, and low survival rate after transplantation), which seriously affect the development of rapid propagation methods for the commercial cultivation of peony [6,7]. Therefore, to establish an efficient tissue culture system for tree peony, the problems related to poor rooting, especially root formation, must be addressed [4,7]. The explants used in tissue culture were equivalent to cuttings and scions. Therefore, explored the rooting mechanism of seedlings, and combined with the evidence of cuttings and grafting, could provide theoretical support for the rooting of tree peony in vitro. Several studies have been conducted on tree peony root development, but they mainly focused on the effects of the growth medium, hormone levels, and endogenous phenolics [5,7,8]. Unfortunately, the underlying molecular mechanism is still unclear.
Root development is a complex process regulated by nutrients, oxidase activity, environmental conditions, and various endogenous hormones [9–12]. Of these factors, endogenous hormones, especially auxin, are particularly important for plant rooting [13,14]. Auxin has been confirmed as the main hormone that promotes root formation in Vigna radiata, Arabidopsis, Mangifera and other plants [15–18]. More specifically, auxin directly regulates plant root growth and development, but it also indirectly affects the expression of root development-related genes, thereby regulating root formation [19,20].
High-throughput transcriptome sequencing (RNA-seq) can analyze gene expression in specific plant parts and during particular stages [21,22]. It has been commonly used to identify differentially expressed genes (DEGs) and key genes that regulate plant growth and development [4,23]. Many new rooting-related genes were identified in Saccharum sp., Chrysanthemum, and Zea mays by transcriptome sequencing, and their relationships with auxin and other related hormones have been clarified in follow-up studies [21,24,25]. Thus, RNA-seq may be useful for identifying rooting-related genes to elucidate the mechanism mediating root formation in tree peony. The transcriptome sequencing of tree peony to date has primarily focused on tissue culture browning, genetic breeding, and the floral fragrance mechanism [18,26,27]. There are no reports describing research on the mechanism underlying root formation and the relationship with endogenous hormones at the transcription level.
In this study, a transcriptome sequencing analysis was performed to screen and identify DEGs and the associated metabolic pathways at different stages of tree peony root development under sandy loam cultivation. Gene Ontology (GO) and Kyoto Encyclopedia of Genes and Genomes (KEGG) pathway enrichment analyses revealed many of the DEGs were involved in auxin metabolism. Additionally, the rooting-related genes were screened, after which their expression levels in seedlings, cuttings and grafted seedlings were analyzed by quantitative real-time polymerase chain reaction (qRT-PCR) and their functions were verified. The results of these analyses may be useful for characterizing the main molecular mechanism controlling tree peony root differentiation. Furthermore, the data presented in this manuscript may provide the theoretical basis for future investigations of the tree peony rooting mechanism and the establishment of viable peony tissue culture and rapid propagation systems.
2.1 Plant Materials and Treatments
Tree peony (Paeonia suffruticosa ‘Fengdanbai’) was used as the study material. All plants were grown in a nursery at the Henan Agricultural University in Zhengzhou, China. Seedlings were approximately 10 years old, cultivated in sandy loam soil, and their growth condition was good. The external morphology and the anatomical structure of the roots were examined to determine the three critical rooting period (Fig. 1): ungerminated root primordium (R1), induced root primordium (R2), and lateral root formation (R3). The roots which were positive and negative 0.5 cm with the occurrence point of lateral roots were intercepted as the materials for RNA-Seq and qRT-PCR. The screening method of the critical period of rooting and the sampling method of cuttings and grafted seedlings referred to our previous research [28]. The current year semi-lignified twigs of ‘Fengdanbai’ which was 10 years old used above were collected as the cuttings and scions for qRT-PCR materials. They were planted in sandy loam soil, and cultivated in a glass greenhouse at a temperature of 15°C ± 2°C and an air humidity of 50%. The phloem of the rootstock interface and roots during the rooting critical stage were collected as qRT-PCR materials [28]. For each sample, the root materials were examined in triplicate, and placed in a sterile 50 mL centrifuge tube, immediately frozen in liquid nitrogen, and stored at −80°C until analyzed.
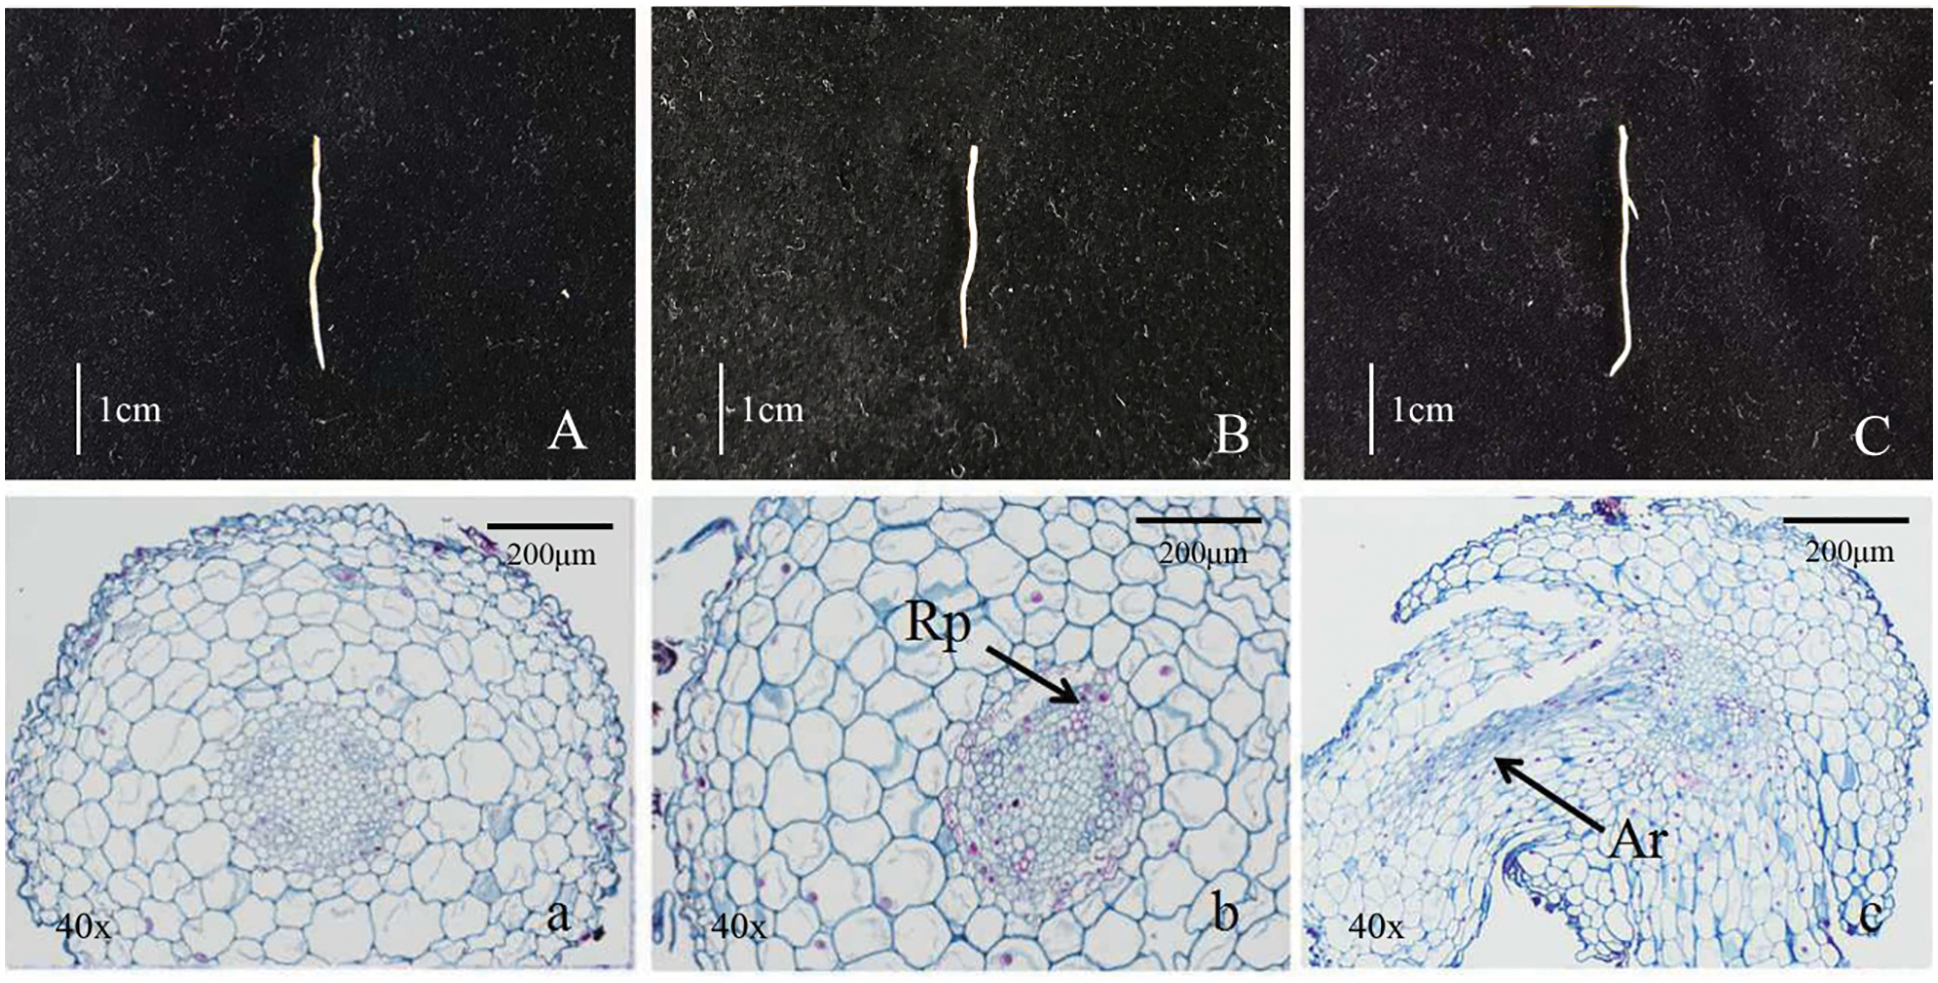
Figure 1: Morphological and anatomical observation of tree peony root (A/a, Root primordium ungerminated period/R1; B/b, Root primordium induction period/R2; C/c, Lateral root formation period/R3, Rp. Lateral root primordium; Lr. Lateral root)
2.2 RNA Extraction, Construction of the cDNA Library, and Transcriptome Sequencing
Total RNA was isolated from fresh root tissue of R1, R2, and R3 according to a modified CTAB procedure [29]. The RNA concentration and quality were determined using the 2100 Bioanalyzer (Agilent Technologies, Santa Clara, CA, USA) and the NanoDrop 1000 UV/Visible spectrophotometer (Thermo Scientific, Waltham, MA, USA), respectively. The cDNA library was constructed from the high-quality RNA samples and then sequenced by Shenzhen Hengchuang Biotechnology Co., Ltd. (China). The preliminary quantitative analysis was performed using the Qubit® 2.0 Fluorometer (Life Technologies, Grand Island, NY, USA). The insert fragment size of the library was determined using the 2100 Bioanalyzer (Agilent Technologies, Santa Clara, CA, USA). The double-stranded cDNA of the above-mentioned samples was sequenced using the GA IIx system (Illumina, CA, USA).
2.3 De Novo Transcriptome Assembly and Annotation
The raw transcriptome sequencing data were filtered to obtain the original clean data. A de novo sequence assembly was used because of a lack of an available fully sequenced tree peony reference genome. This sequence was compared with the sequences of other model plants available in the NCBI database using the BLASTn algorithm. The quality of the library was assessed (e.g., insert length check and matched fragment randomness check). The fragments per kilobase of transcript per million fragments mapped value [30] was used as an index for measuring gene expression levels. The EBseq software [31] was used to analyze the data for the different sample groups. The following criteria were used to identify DEGs (i.e., differentially expressed genes): expression level fold-change ≥2 and false discovery rate <0.01. On the basis of the COG (i.e., cluster of orthologous groups of proteins), GO (i.e., gene ontology), KEGG (i.e., kyoto encyclopedia of genes and genomes), Swiss-Prot, NR (i.e., non-redundant amino acids), and NT (i.e., non-redundant nucleotides) databases, the functions, types, and enriched metabolic pathways of the DEGs were determined.
2.4 Transcriptome Data Verification and Differentially Expressed Gene Analysis
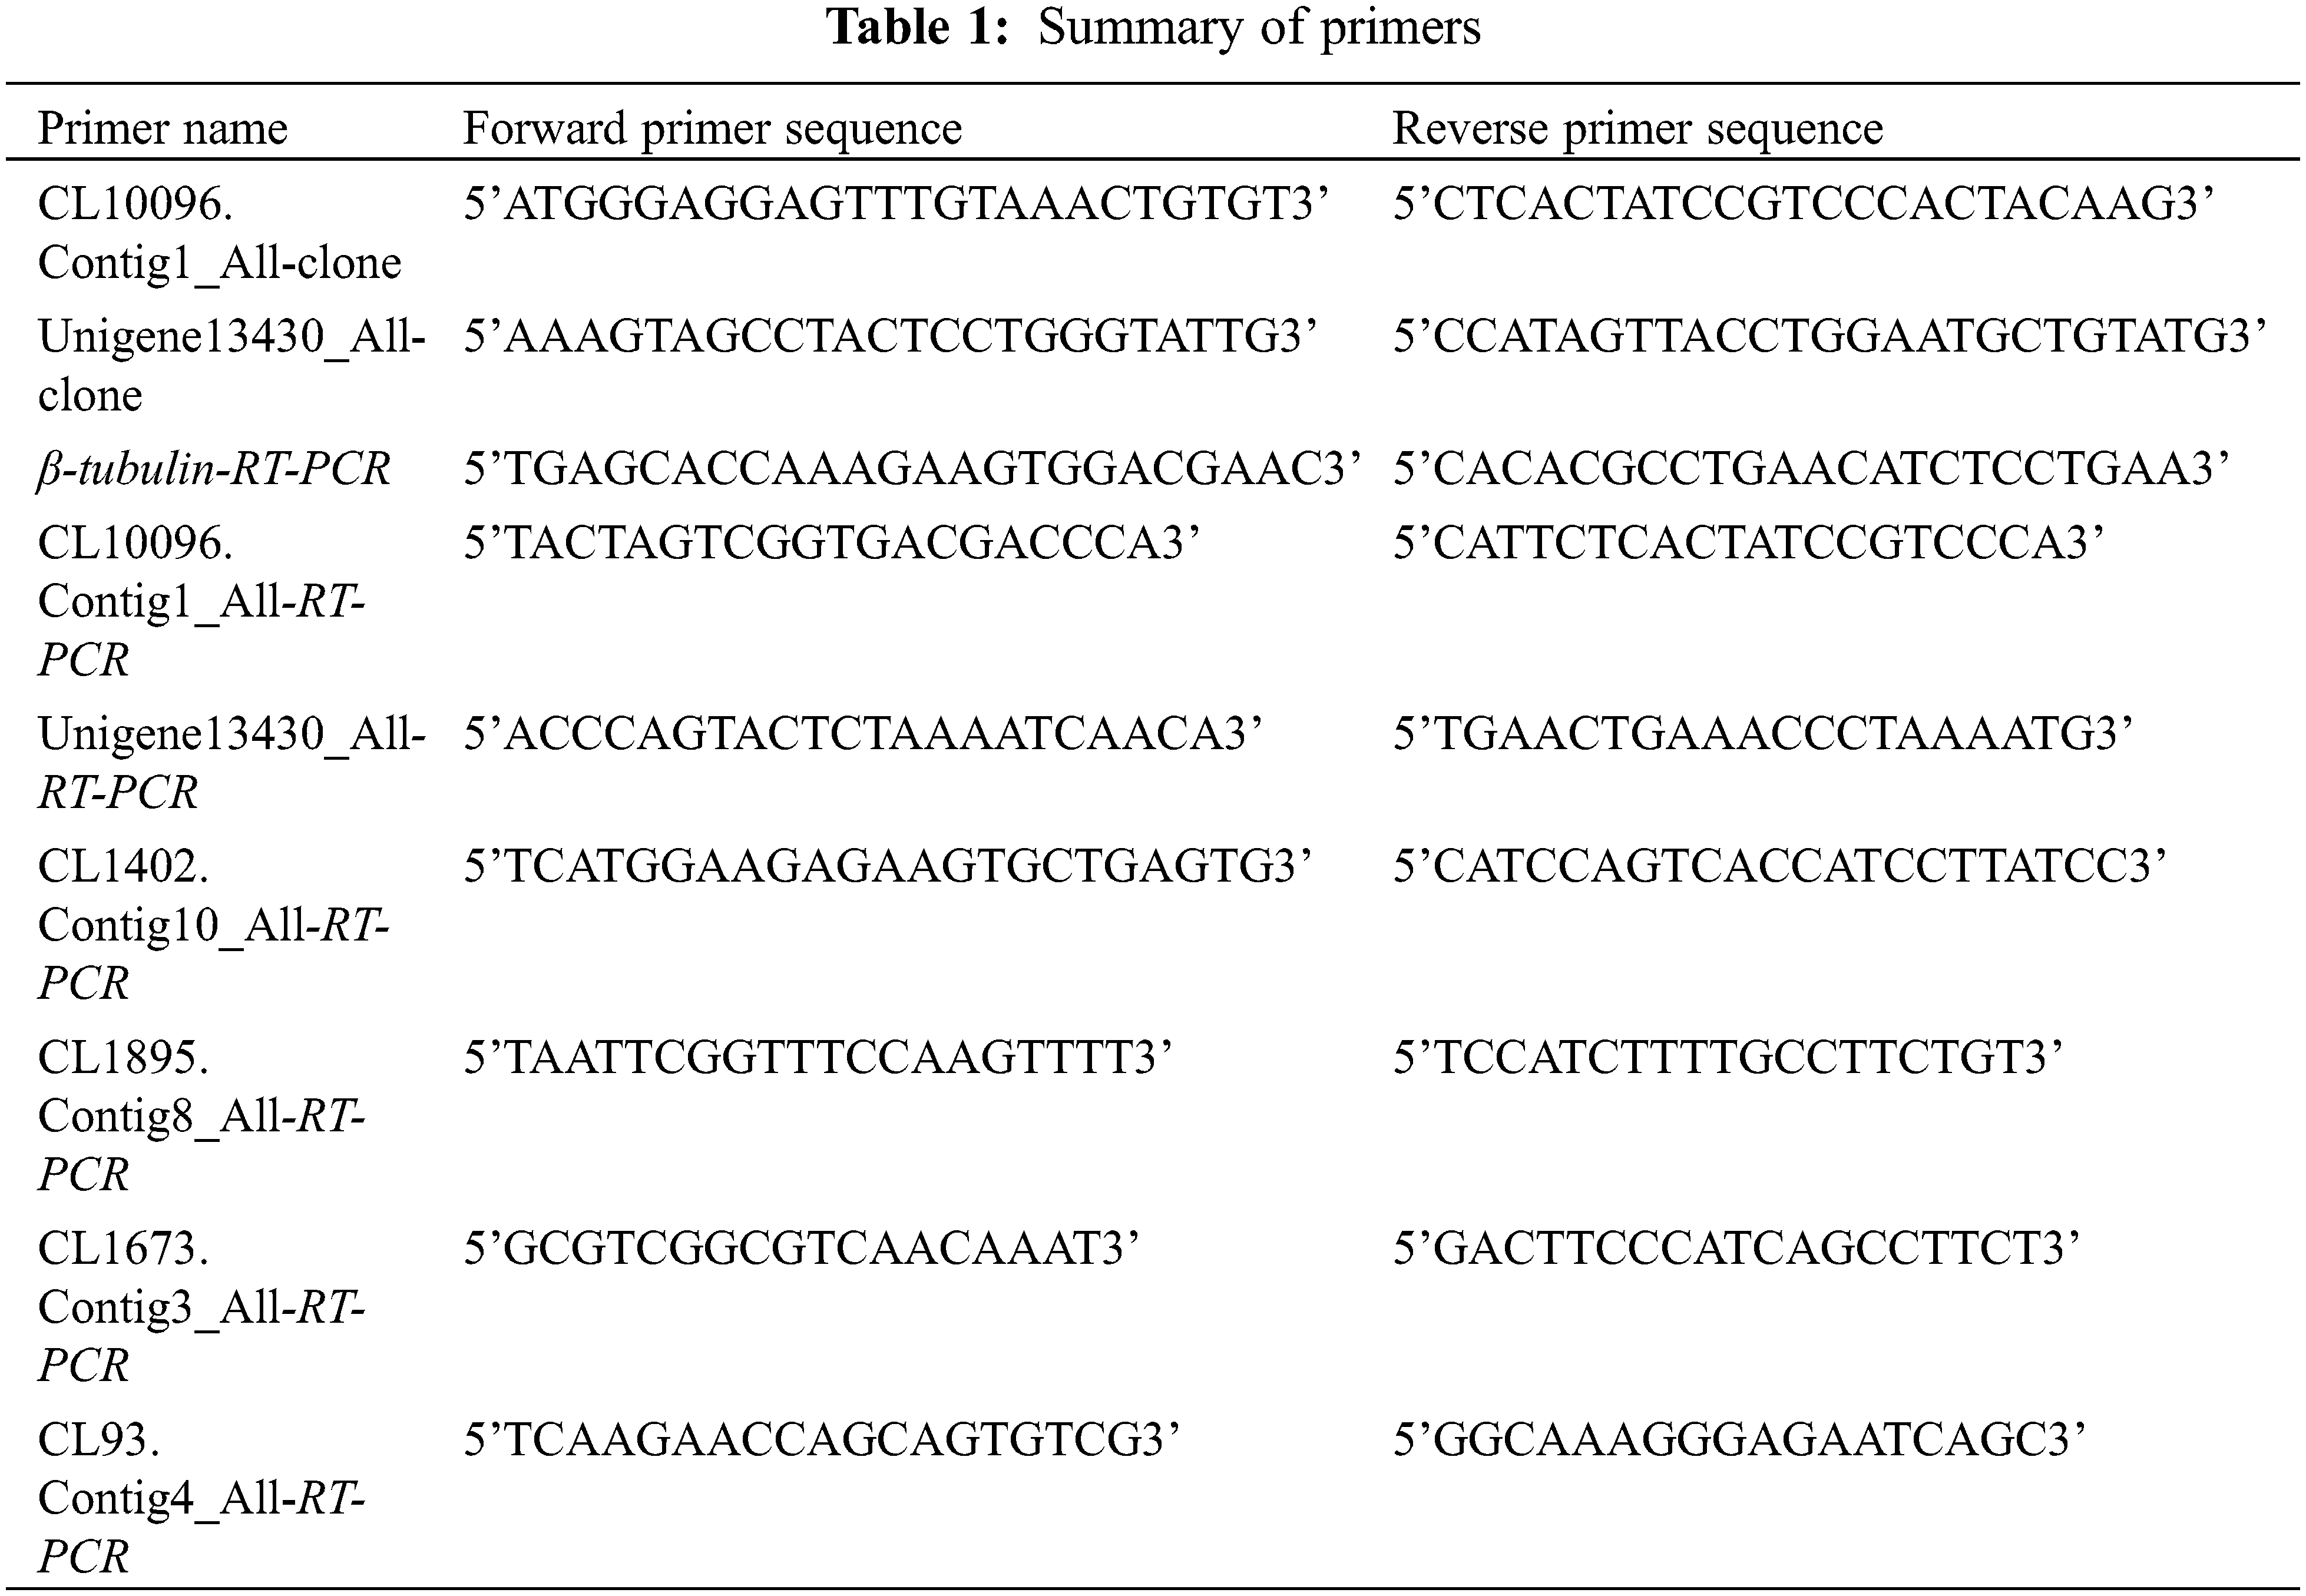
12 differentially expressed genes were randomly selected from the transcriptome sequencing data, and detected the expression levels by qRT-PCR technology in three different developmental stages of tree peony. By analyzing the transcriptome sequencing data, two significant differentially expressed rooting-related genes were selected and cloned. BioXM2.7 was used to translate the open reading frame (ORF). The physicochemical properties and conserved domains were estimated using analytical tools at the NCBI (https://www.ncbi.nlm.nih.gov/). The online software SMART (http://smart.embl-heidelberg.de) was used for domain analysis. DNAMAN8 was used for multiple sequence alignment and MEGA7.0 was used to construct phylogenetic trees with the neighbor-joining method. Primer 5.0 was used for designing the qRT-PCR primers, which were synthesized by Guangzhou Saizhe Biotechnology Co., Ltd. (China). A peony β-tubulin gene (GenBank: EF608942.1) was used as the internal reference gene. The related gene IDs and primer sequences are listed in Table 1.
2.5 Construction of the Arabidopsis Overexpression Vector
Primers containing restriction sites were designed (Table 1) for the amplification of the full-length ORF of the target gene. The PCR product was purified (Tiangen DP204, Beijing, China) and inserted into the pGEM-T Easy vector. The recombinant plasmid was then inserted into Escherichia coli cells. A single clone was sequenced. After confirming the sequence was accurate, the plasmid was extracted and then digested by restriction enzymes (Nco I, Spe I, Takara Biomedical Technology Co., Ltd., Beijing, China). The target fragment was inserted into a pCAMBIA1302 vector.
2.6 Functional Verification of Transformed Arabidopsis Plants
The constructed pCAMBIA1302 overexpression vector was inserted into wild-type Arabidopsis plants according to an Agrobacterium tumefaciens-mediated inflorescence dip method [32]. Transgenic seedlings were selected on 1/2MS medium (containing 100 mg⋅L−1 Cef and 25 mg⋅L−1 Hyg). The number of PsIAA27 and PsARF19 overexpression positive transgenic Arabidopsis obtained were 15 and 18, respectively. They were then transplanted into matrix (perlite: ver-miculite = 1:1) and analyzed. The phenotypic examination and identification were initiated starting with the T1 generation plants. Continuing to cultivate transgenic Arabidopsis to harvest T2 homozygous transgenic Arabidopsis, 3 plants with the same growth status were selected for qRT-PCR and index determination. Details regarding the primers are listed in Table 1.
All data in this research underwent a two-way analysis of variance (ANOVA), and significant differences between the means were tested using Duncan’s post-hoc test (p ≤ 0.05). All statistical analyses were conducted using the Microsoft Office 2010 and SPSS 19.0 (SPSS, Chicago, USA) program for Windows.
3.1 Morphological and Anatomical Observation of Adventitious Root Formation Process
Morphological anatomic observation of the growth process of root primordium germination and lateral roots was shown in Fig. 1. The root surface was smooth in the Fig. 1A, and there was no sign of root primordium sprouting (Fig. 1a). The root surface in Fig. 1B was smooth and without convex, but it had obvious root primordium germination phenomenon (Fig. 1b). A large number of bulges had been found on the root surface in Fig. 1C and indefinite root had been formed (Fig. 1c). The above three periods were named as R1 (ungerminated root primordium), R2 (induced root primordium) and R3 (lateral root formation), respectively, and these roots were used as test materials for transcriptome sequencing analysis.
3.2 Illumina Sequencing and de Novo Transcriptome Assembly
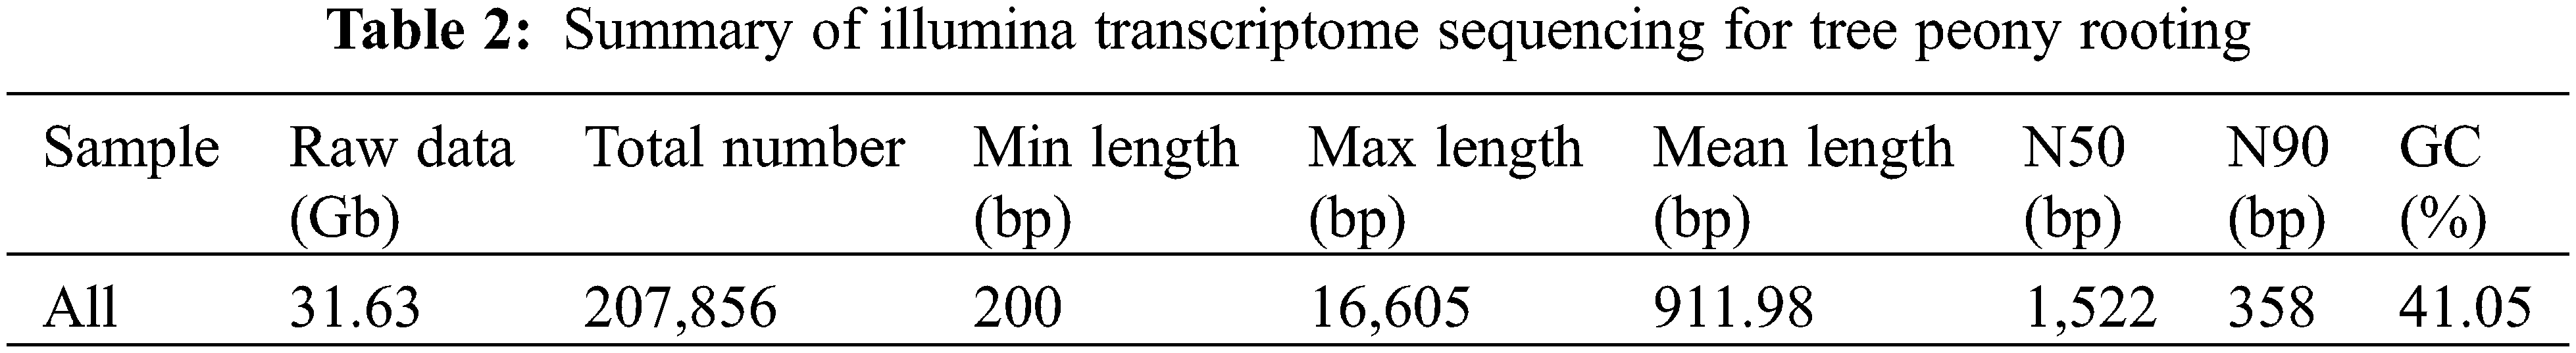
A total of 31.63 Gb raw data (i.e., raw sequence data) were obtained during the transcriptome sequencing analysis in the three periods of R1, R2 and R3 (Table 2). Additionally, 207,856 unigenes were assembled after eliminating the adapter sequences, ambiguous reads, and low-quality reads, with a minimum length (i.e., minimum sequence length) of 200 bp, a maximum length (i.e., maximum sequence length) of 16,605 bp, and a mean length (i.e., mean sequence length) of 911.98 bp. The N50 (i.e., contig N50 and scaffold N50) length, N90 (i.e., contig N90 and scaffold N90) length, and GC (i.e., guanine and cytosine) content of the assembled unigenes were 1,522 bp, 358 bp, and 41.05%, respectively.
3.3 Functional Annotation of the Tree Peony Rooting Transcriptome
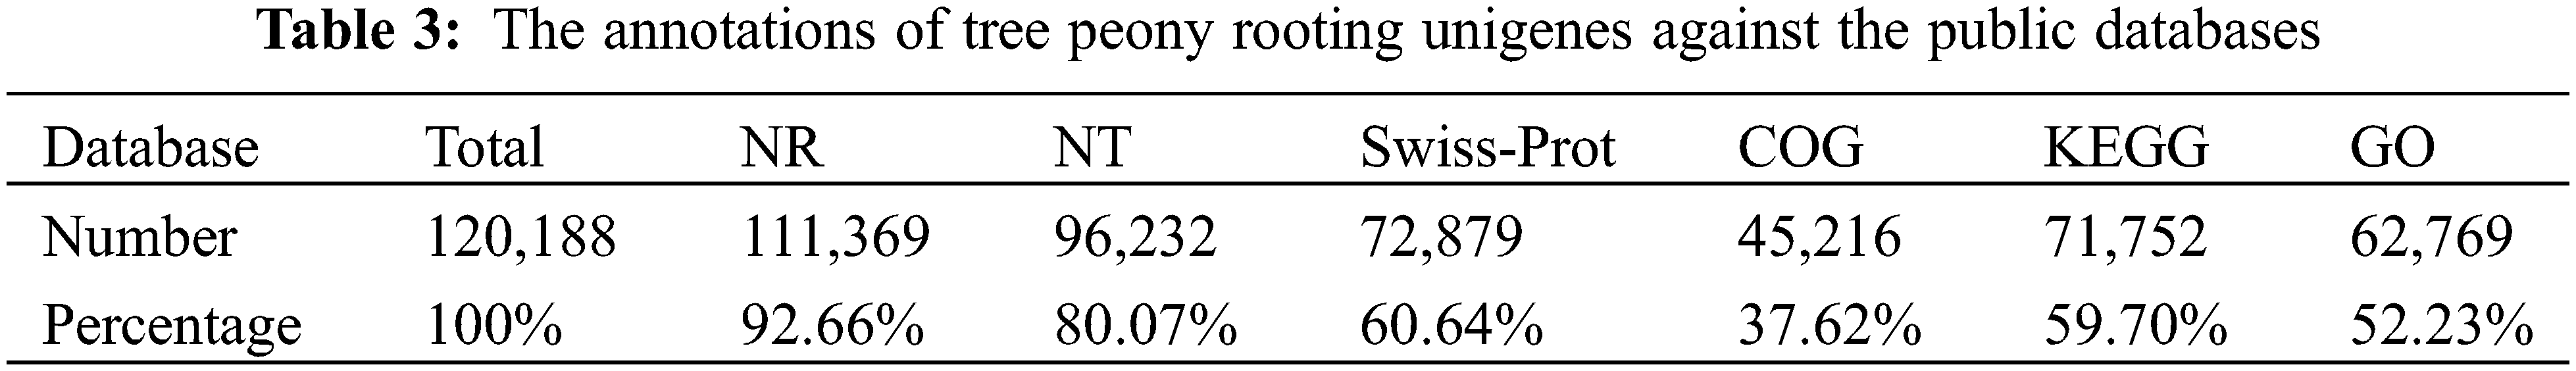
A total of 120,188 unigenes were annotated using one nucleotide database and five functional protein databases (Table 3). Of these unigenes, 111,369 (92.66%) were annotated on the basis of the NR database, 96,232 (80.07%) were annotated according to the NT database, 72,879 (60.64%) were annotated using the Swiss-Prot database, 45,216 (37.62%) were annotated on the basis of the COG database, 71,752 (59.70%) were annotated according to the KEGG database, and 62,769 (52.23%) were annotated using the GO database.
In the R1 vs. R2 comparison, 41,162 DEGs were identified, of which 10,642 were up-regulated and 30,520 were down-regulated. In the R1 vs. R3 comparison, 53,436 DEGs were detected, of which 14,636 were up-regulated and 38,800 were down-regulated. The R2 vs. R3 comparison revealed 34,538 DEGs, of which 14,496 were up-regulated and 20,042 were down-regulated. The comparisons indicated that as the root primordium developed, an increasing number of unigenes had a down-regulated expression level. Thus, the number of down-regulated genes exceeded the number of up-regulated genes (Fig. 2).
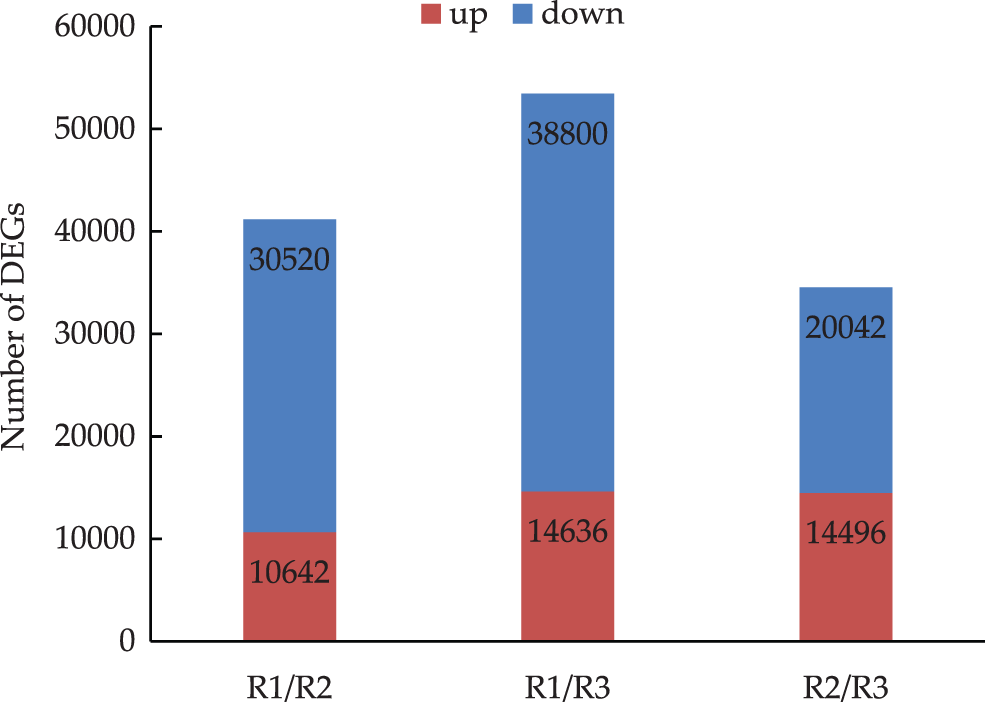
Figure 2: Differentially expressed genes in three evelopmental stages of tree peony rooting (R1 vs. R2: R1/R2 stage, R1 vs. R3: R1/R3 stage, and R2 vs. R3: R2/R3 stage. The numbers of DEGs are marked in the column chart)
The differential gene expression in each metabolic pathway varied among the three stages of tree peony root development (Fig. 3). The comparison of differential gene expression in different stages indicated that most of the DEGs in the pathways were down-regulated. Of the examined metabolic pathways, carbohydrate metabolism had the most DEGs. There were 314 DEGs between R1 and R2, of which 218 were down-regulated (i.e., 69%). There were 371 DEGs between R2 and R3, most of which were down-regulated. There were 336 DEGs between R1 and R3, of which 102 were up-regulated and 234 were down-regulated. Moreover, the expression level of the down-regulated genes was double that of the up-regulated. The number of DEGs in hormone was second more than others. There were 226 DEGs between R2 and R3, of which 129 were down-regulated (i.e., 57.1%) and 97 were up-regulated (i.e., 42.9%). There were 321 DEGs between R1 and R2, of which 256 were down-regulated (i.e., 79.8%) and 65 were up-regulated (i.e., 20.2%). There were 227 DEGs between R1 and R3, of which 56 were up-regulated (i.e., 24.7%) and 171 were down-regulated (i.e., 75.3%).
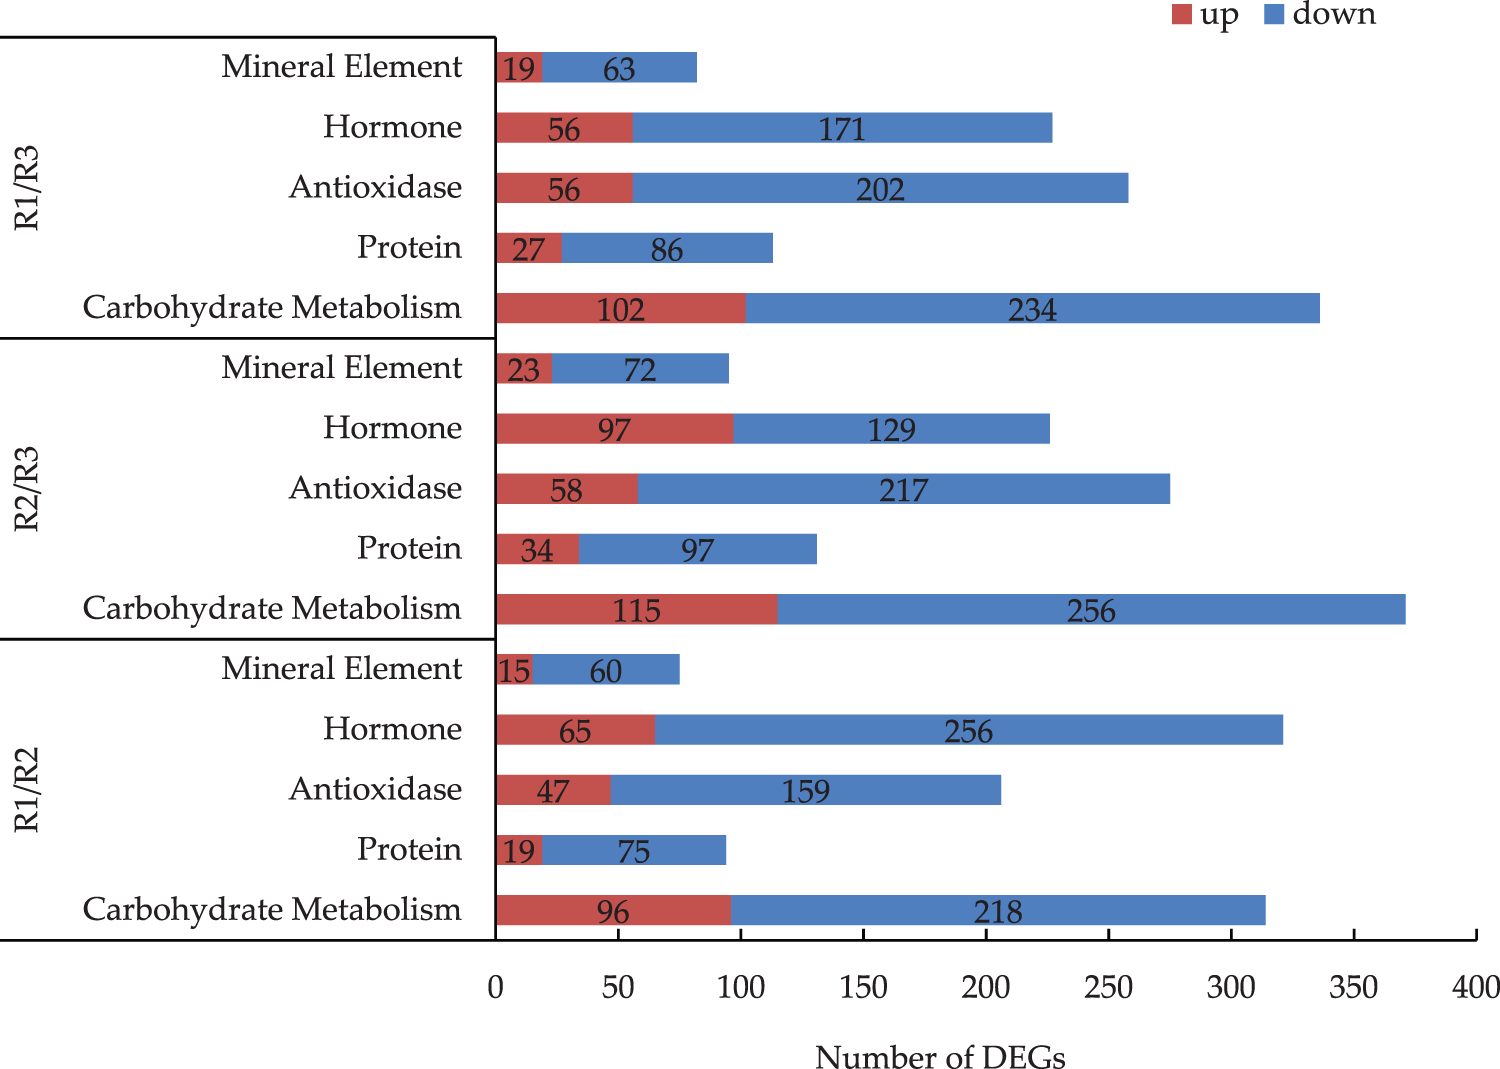
Figure 3: Analysis of the DEGs of main metabolic pathways in the R1/R2 stage, R1/R3 stage, and R2/R3 stage (The numbers of DEGs are marked in the column chart)
Regarding the R1 vs. R2 comparison, the most and least common pathways associated with the DEGs were the auxin and gibberellin pathways, respectively (Fig. 4). An examination of the expression levels of the genes related to the hormone metabolism pathway revealed there were more down-regulated genes than up-regulated genes. In the R2 vs. R3 comparison, there was roughly the same number of up-regulated and down-regulated genes involved in the auxin pathway. For the R1 vs. R3 comparison, there were substantially more down-regulated genes than up-regulated genes. The down-regulated DEGs were mainly related to the zeatin, gibberellin, and abscisic acid metabolic pathways. Of the examined hormone pathways, auxin pathway had the most DEGs. There were 127 DEGs between R1 and R2, of which 9 were up-regulated (i.e., 7.1%) and 118 were down-regulated (i.e., 92.9%). There were 87 DEGs between R2 and R3, of which 42 were up-regulated (i.e., 48.3%) and 45 were down-regulated (i.e., 51.7%). There were 39 DEGs between R1 and R3, of which 9 were up-regulated (i.e., 23.1%) and 30 were down-regulated (i.e., 76.9%).
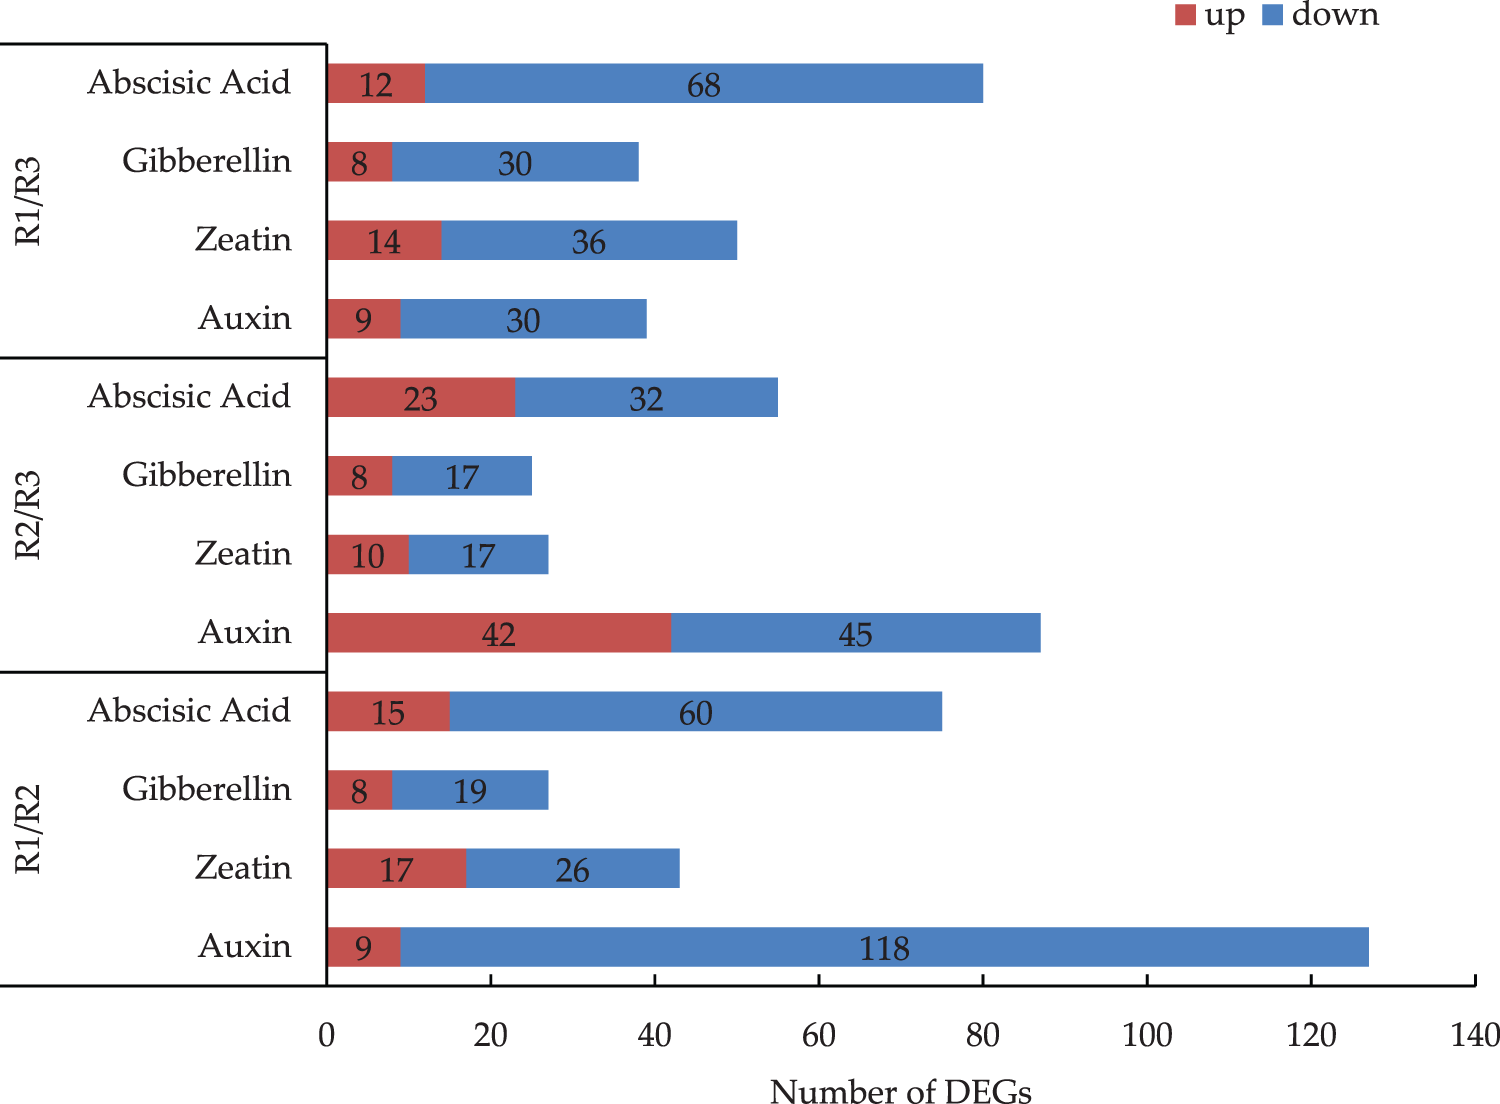
Figure 4: Analysis of the DEGs of four kinds of hormonal pathways in the R1/R2 stage, R1/R3 stage, and R2/R3 stage (The numbers of DEGs are marked in the column chart)
3.5 GO Term Enrichment Analysis of DEGs
An analysis of the annotated peony differential unigenes using the GO database divided the sequences into 55 subcategories in the three main functional categories (i.e., biological process, cellular component, and molecular function) (Fig. 5). The most common annotated GO terms in the biological process category were regulation of transcription, transcription, carbohydrate metabolic process, metabolic process, and defense response. The predominant cellular component GO terms were integral component of membrane, nucleus, cytoplasm, plasma membrane, and intracellular. The main molecular function GO terms were ATP binding, DNA binding, RNA binding, metal ion binding, and sequence-specific DNA binding transcription factor activity.
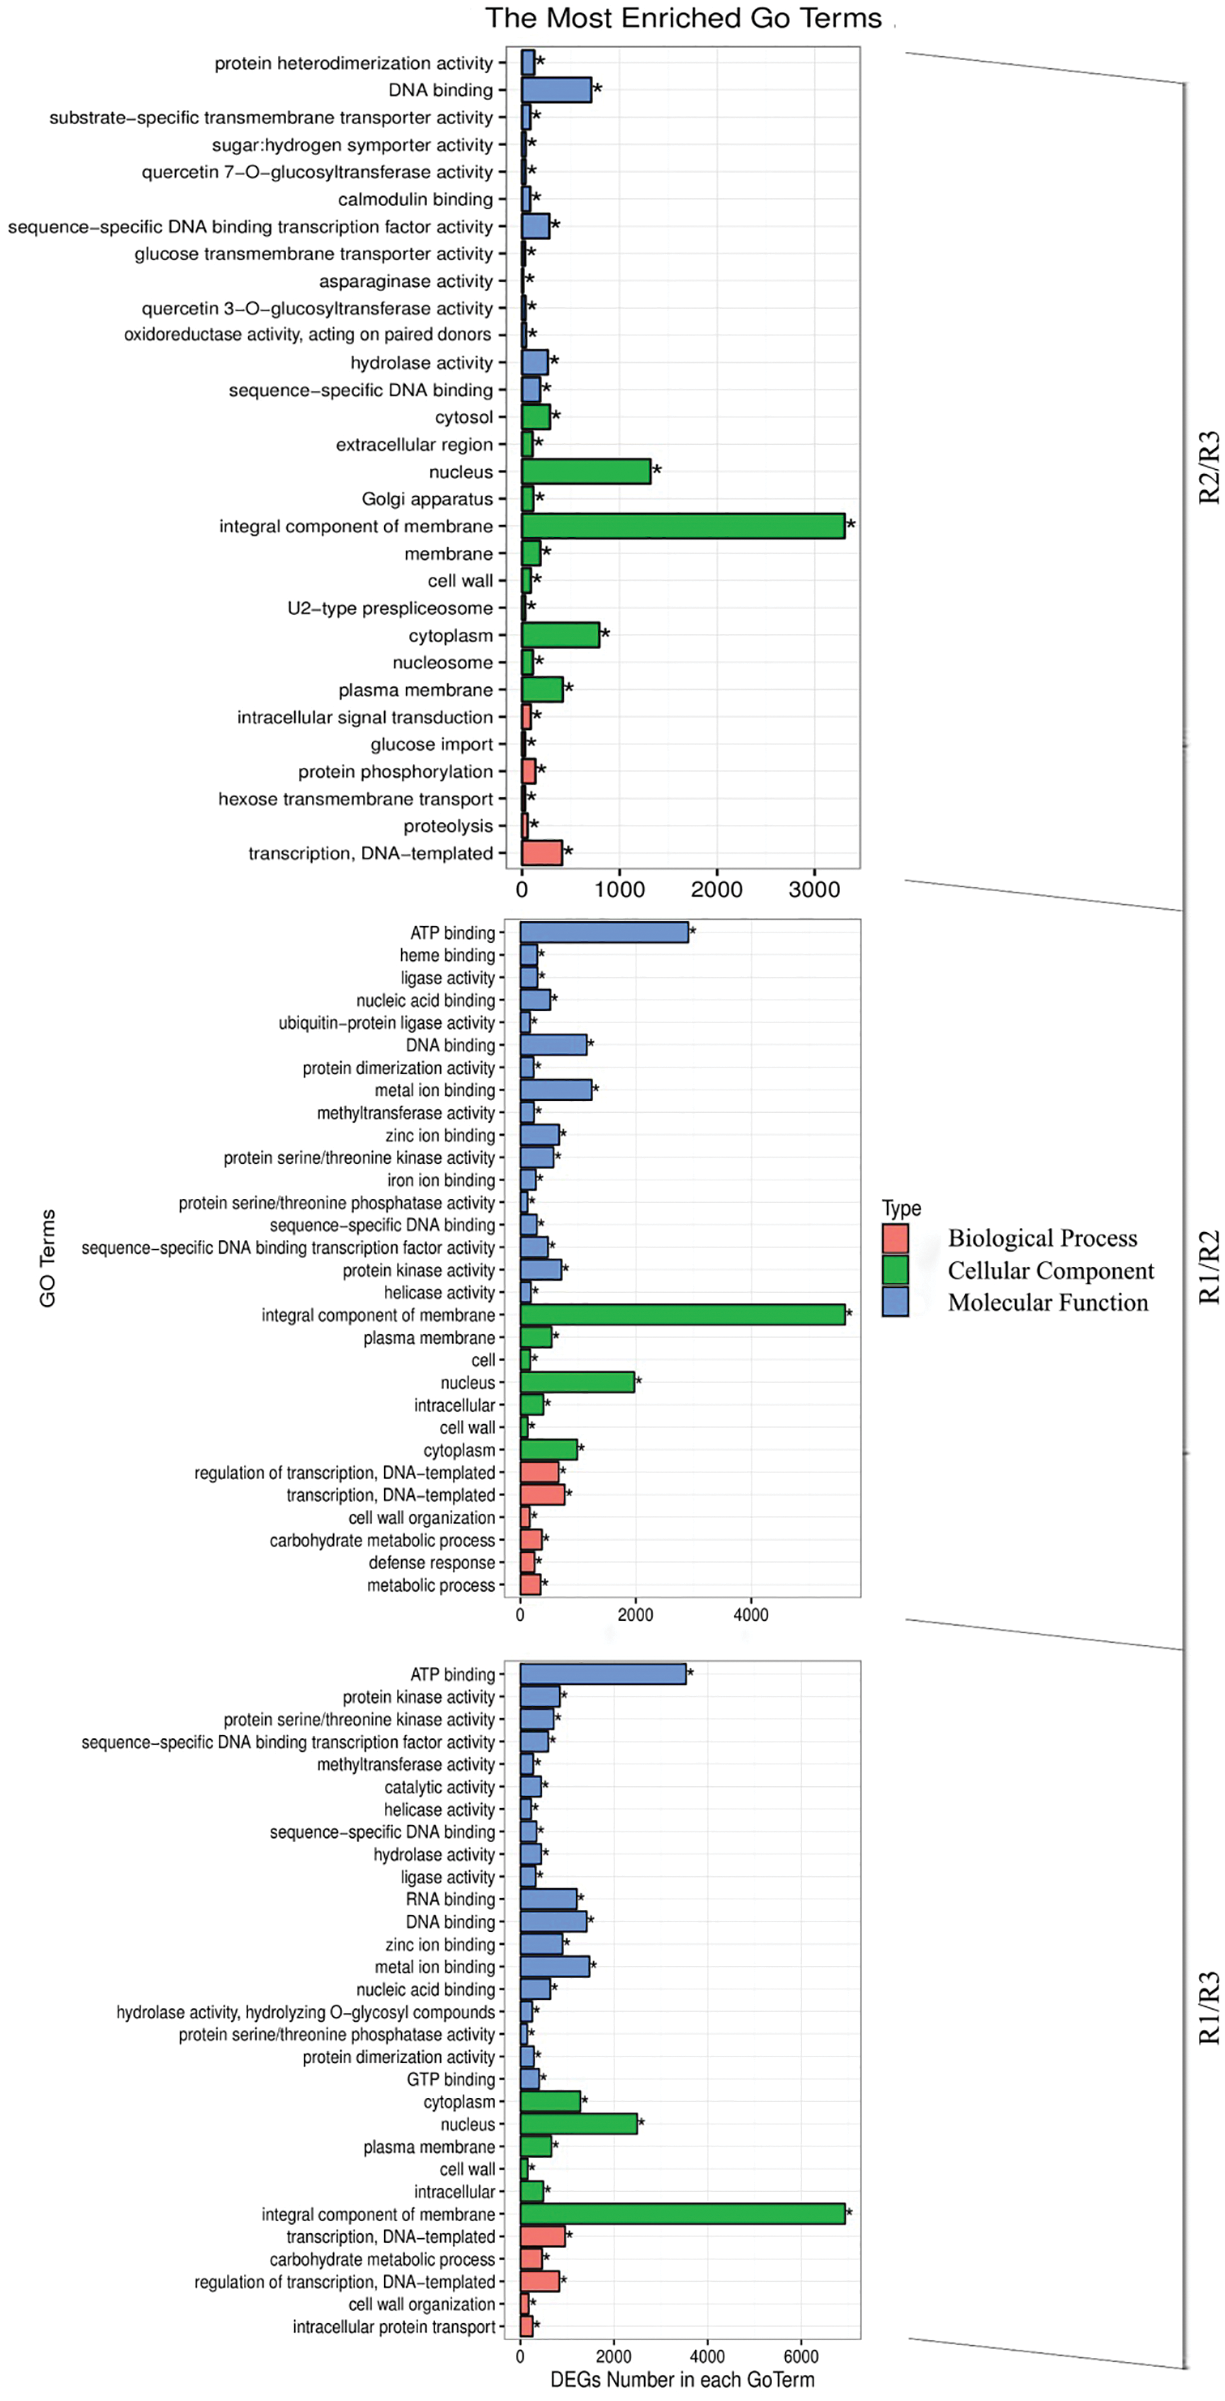
Figure 5: Differential gene GO classification in the R1/R2 stage, R1/R3 stage, and R2/R3 stage
3.6 KEGG Pathway Enrichment Analysis of DEGs
The active metabolic pathways associated with the tree peony rootings in the three examined differentiation stages were clarified by a KEGG pathway enrichment analysis. The 10,687, 8,232, and 6,907 DEGs detected for the R1, R2, and R3 periods were involved in 133, 133, and 132 metabolic pathways, respectively (Fig. 6). The top three metabolic pathways were plant hormone signal transduction, starch and sucrose metabolism, and RNA transport. Other enriched metabolic pathways among the DEGs were mRNA surveillance pathway, endocytosis, and phenylpropanoid biosynthesis. The plant hormone signal transduction played an important regulatory role in the three root development stages of tree peony.
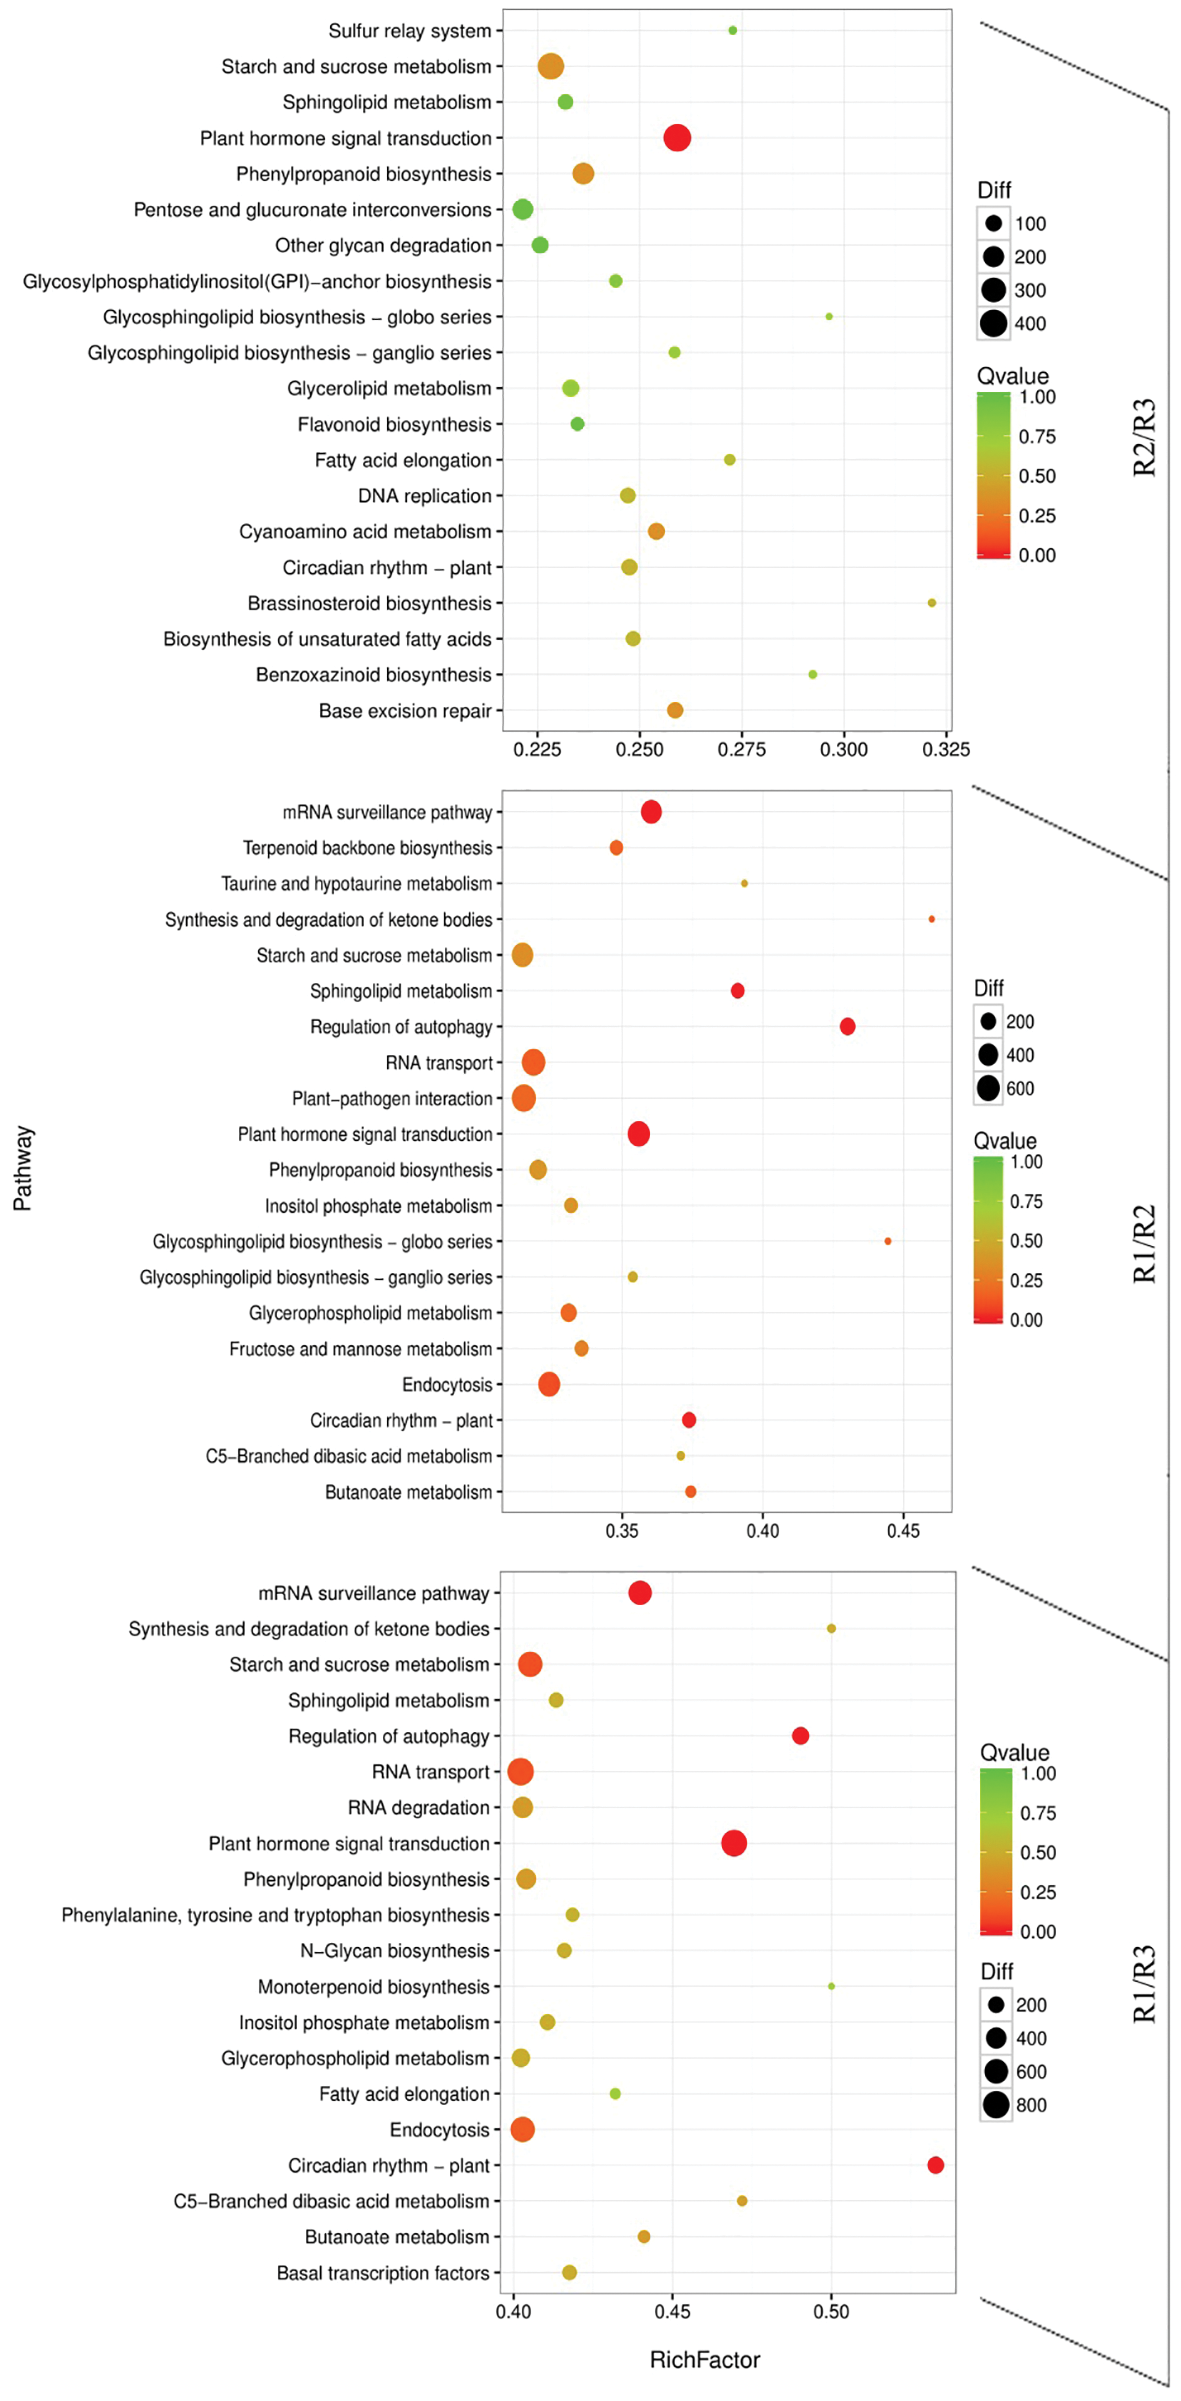
Figure 6: KEGG pathway enrichment scatter map of differentially expressed transcripts in the R1/R2 stage, R1/R3 stage, and R2/R3 stage
3.7 Rooting-Related Transcription Factor Analysis
A total of 58 transcription factor families were annotated following the sequence alignment and screening of known transcription factors (Fig. 7). The top five transcription factor families were MYB (393 genes), bHLH (271 genes), bZIP (212 genes), C3H (212 genes), and ERF (190 genes). Additionally, there were many transcription factors belonging to auxin transcription factor ARF (94 genes), and transcription factors AP2 (97 genes), GATA (56 genes), LBD (62 genes) and NAC (172 genes) involved in auxin regulation, the transcription factors ARF (94 genes), bHLH (271 genes), bZIP (212 genes), NAC (172 genes), WOX (17 genes), WRKY (166 genes), etc., were closely related to root genesis.
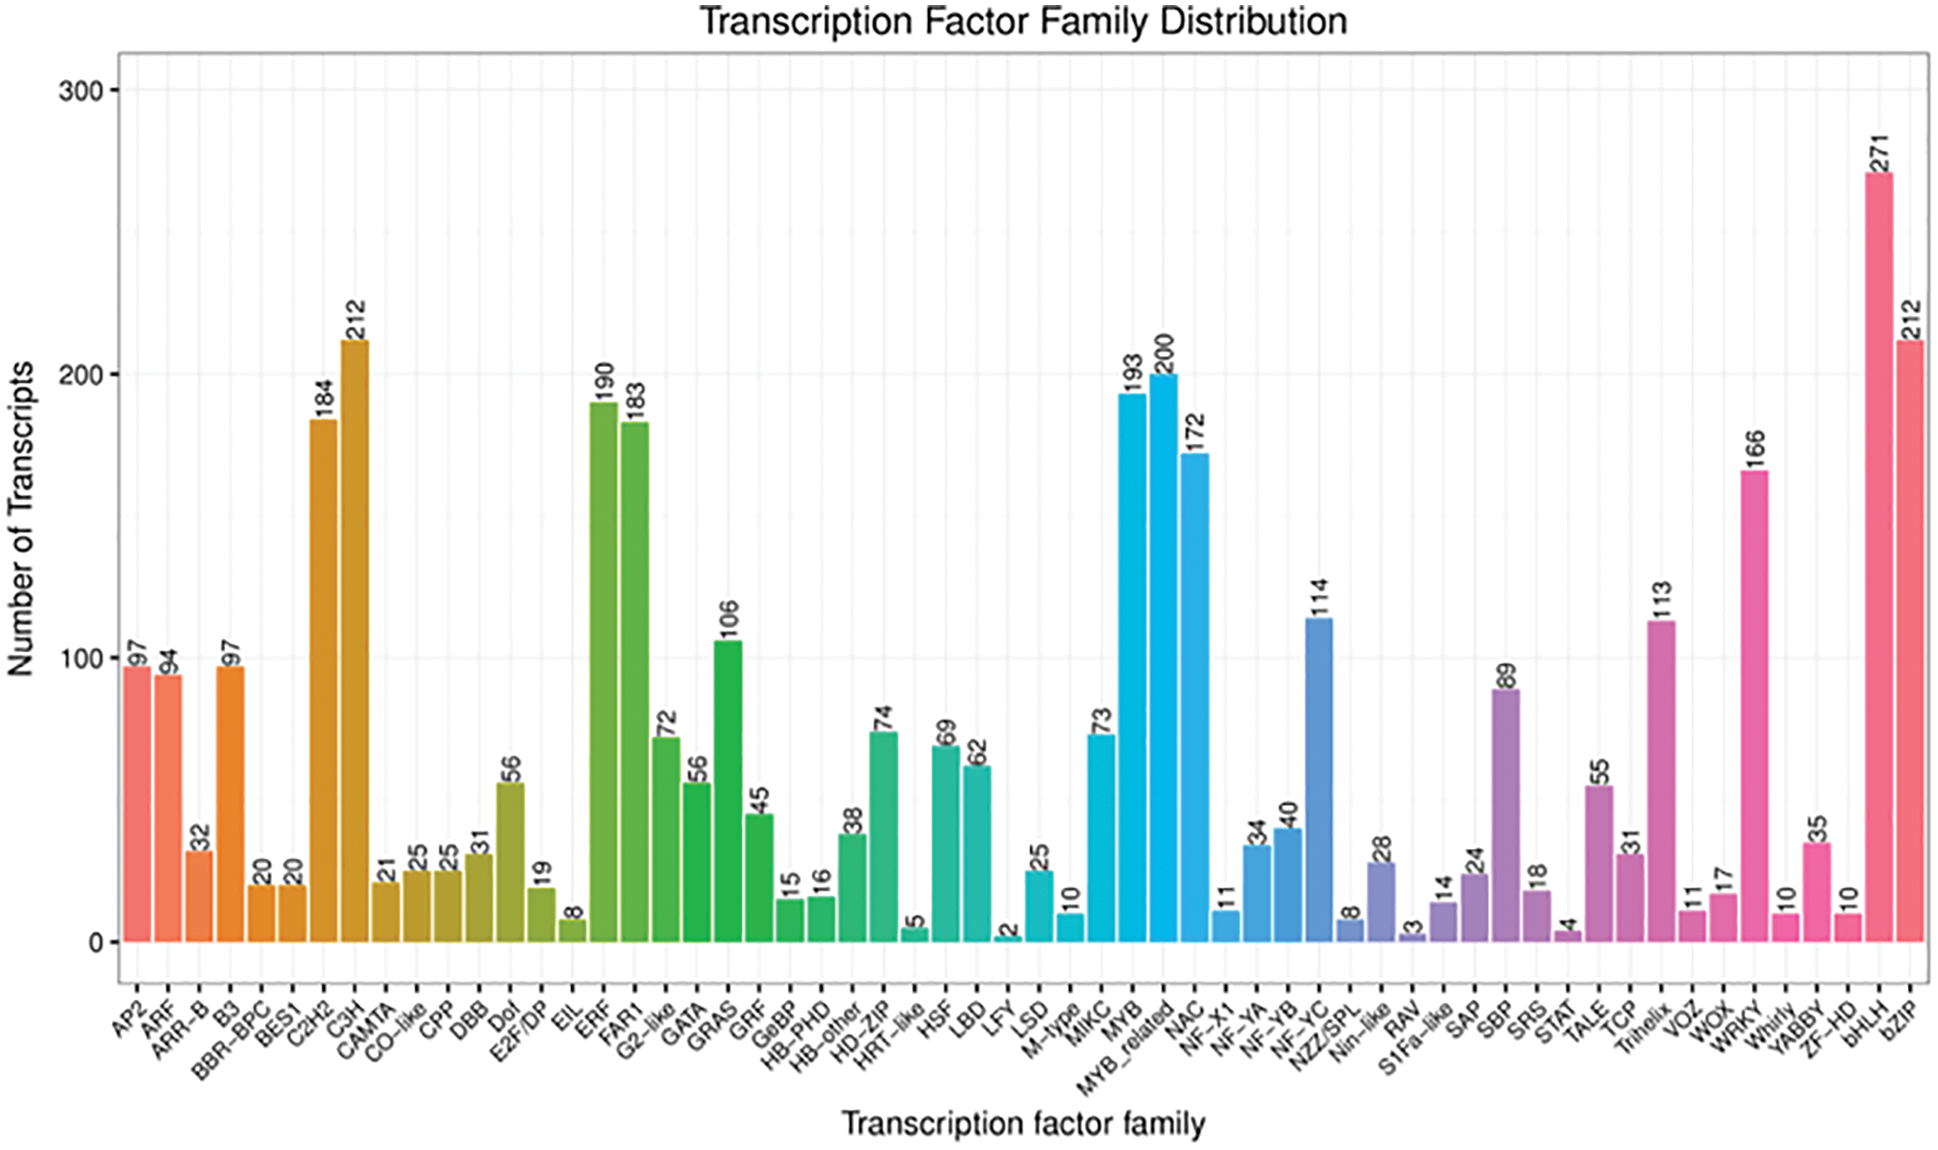
Figure 7: Transcription factor families (The numbers of transcription factor are marked at the top of the column chart)
3.8 qRT-PCR Verification of Transcriptome Data
In order to verify the reliability of the transcriptome data, 12 differentially expressed genes were randomly selected and detected the expression levels by qRT-PCR in three different developmental stages, and then compared with the RNA-seq results. The specific results are shown in the Fig. 8, there were some differences in the expression levels of the 12 genes between qRT-PCR and RNA-seq, but the overall expression trends were analogous in the three periods. Therefore, the transcriptome data was reliable.
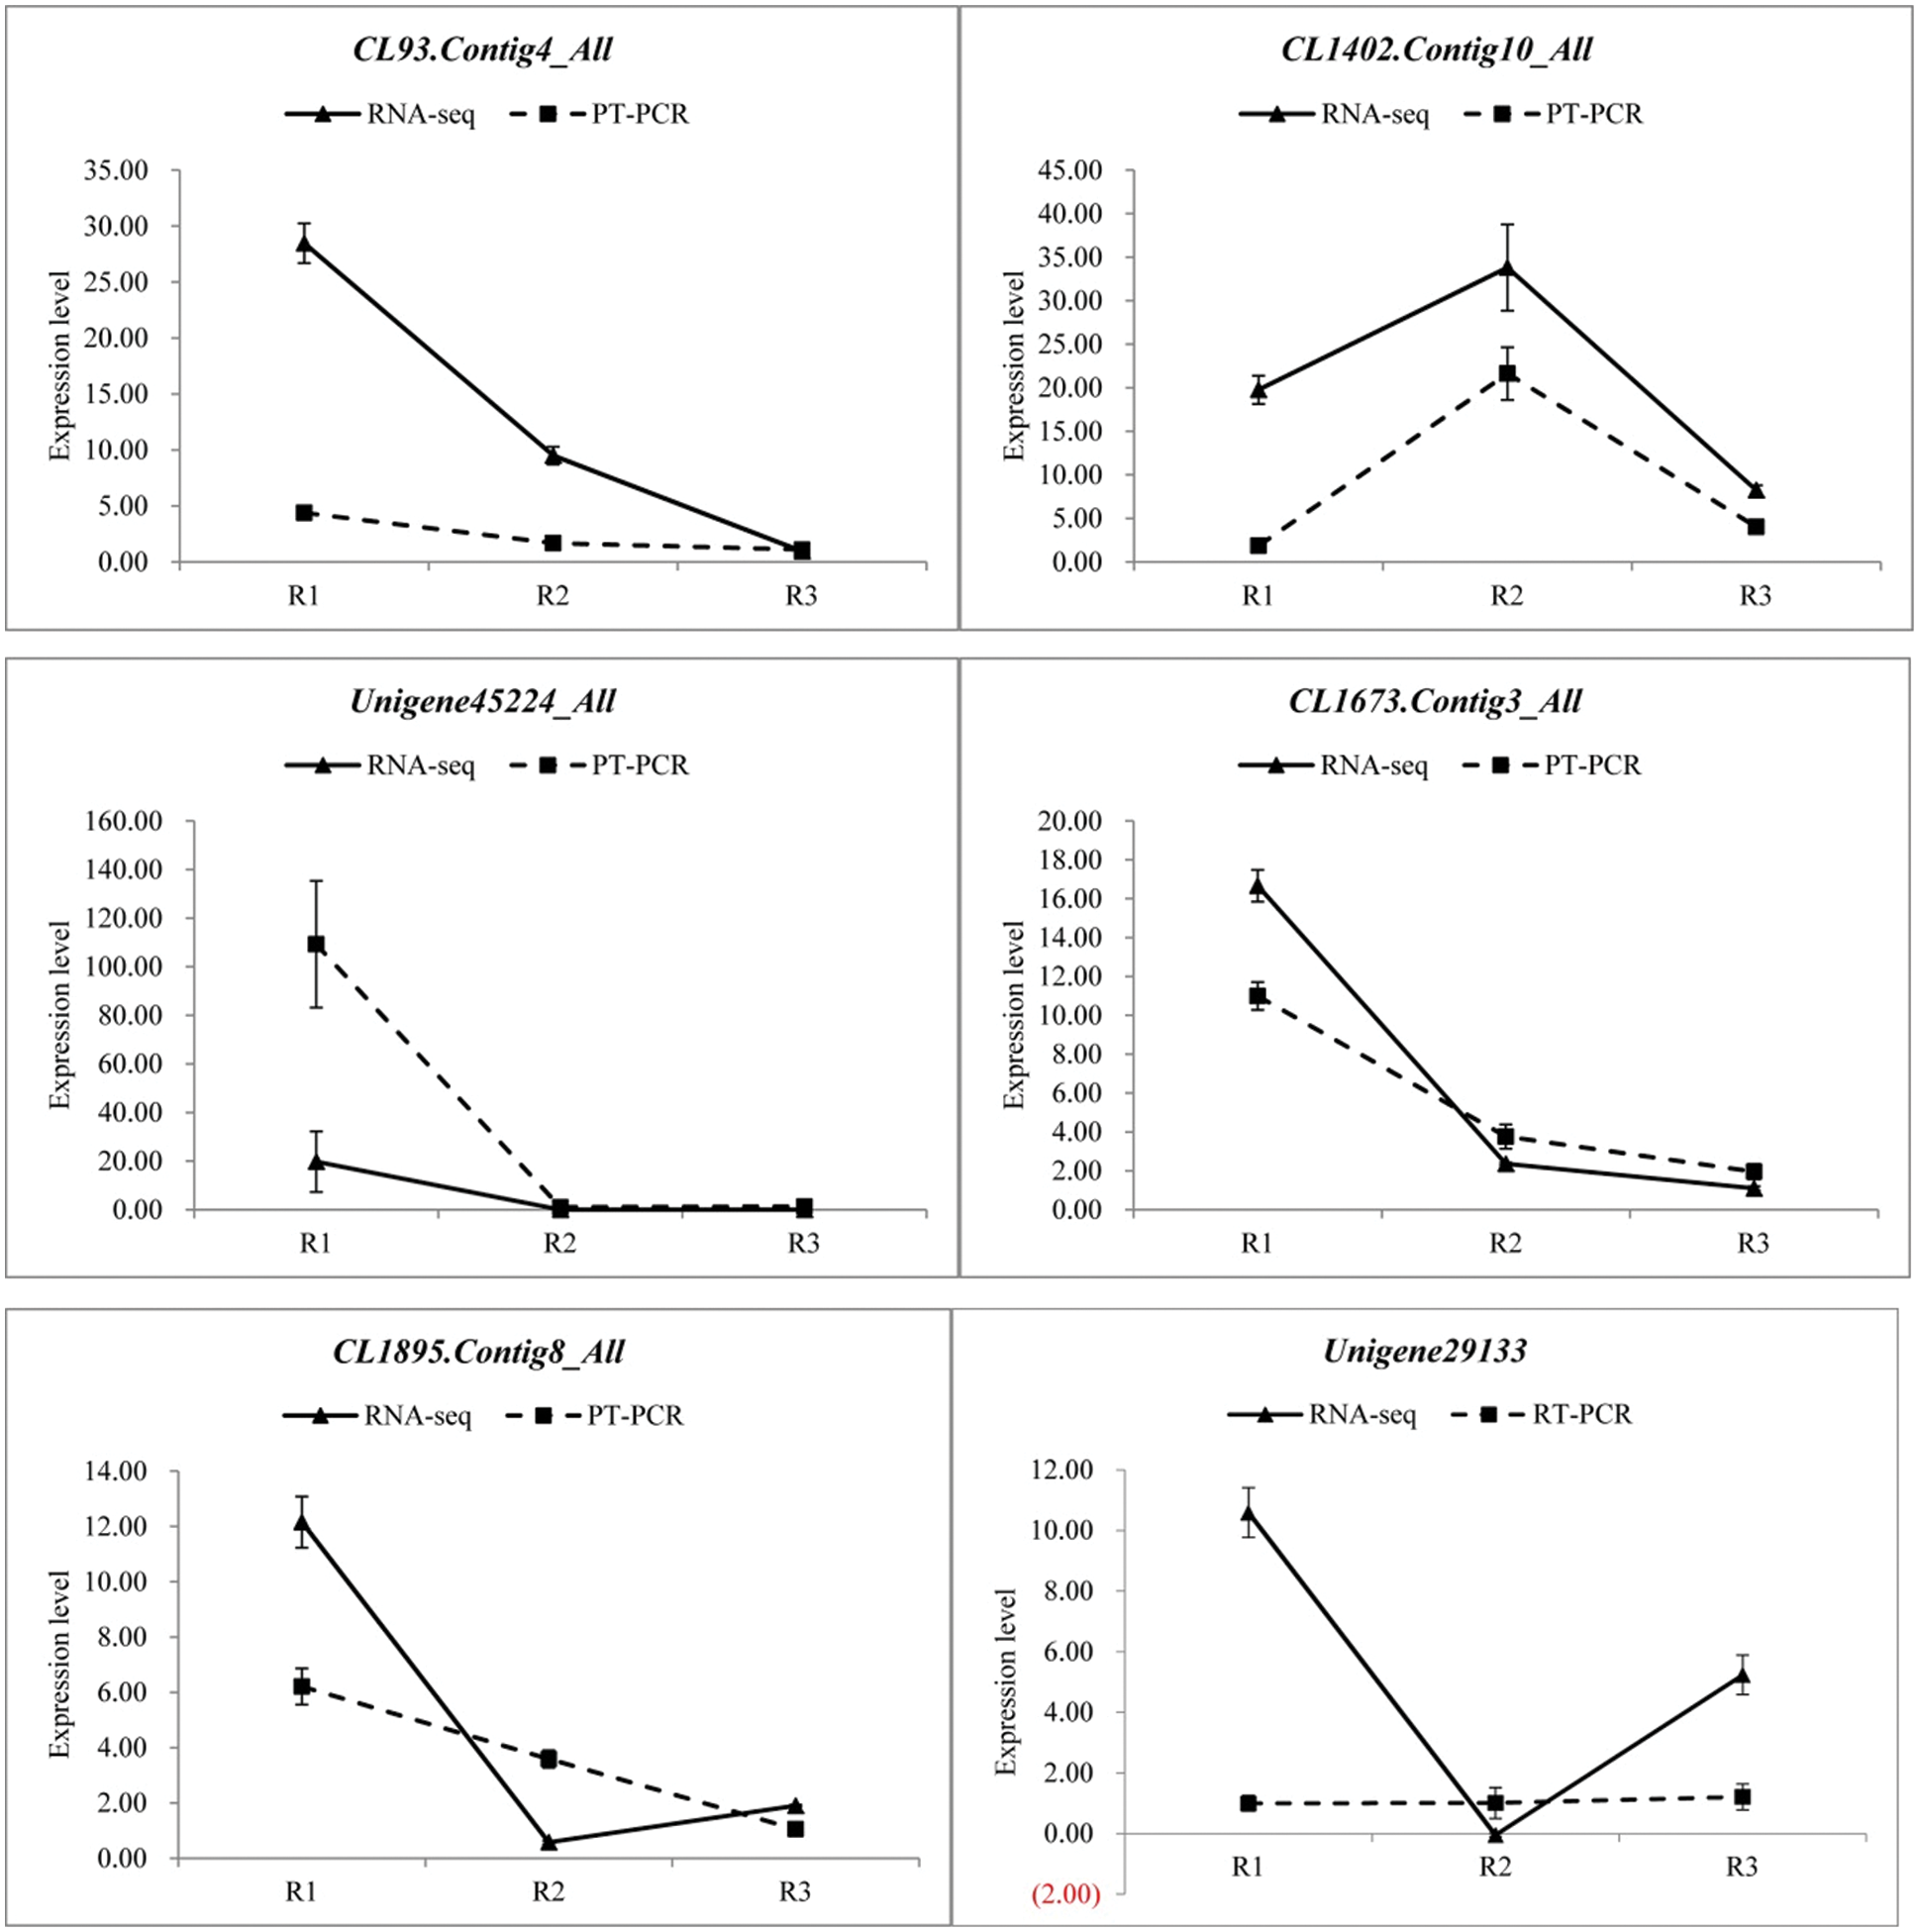
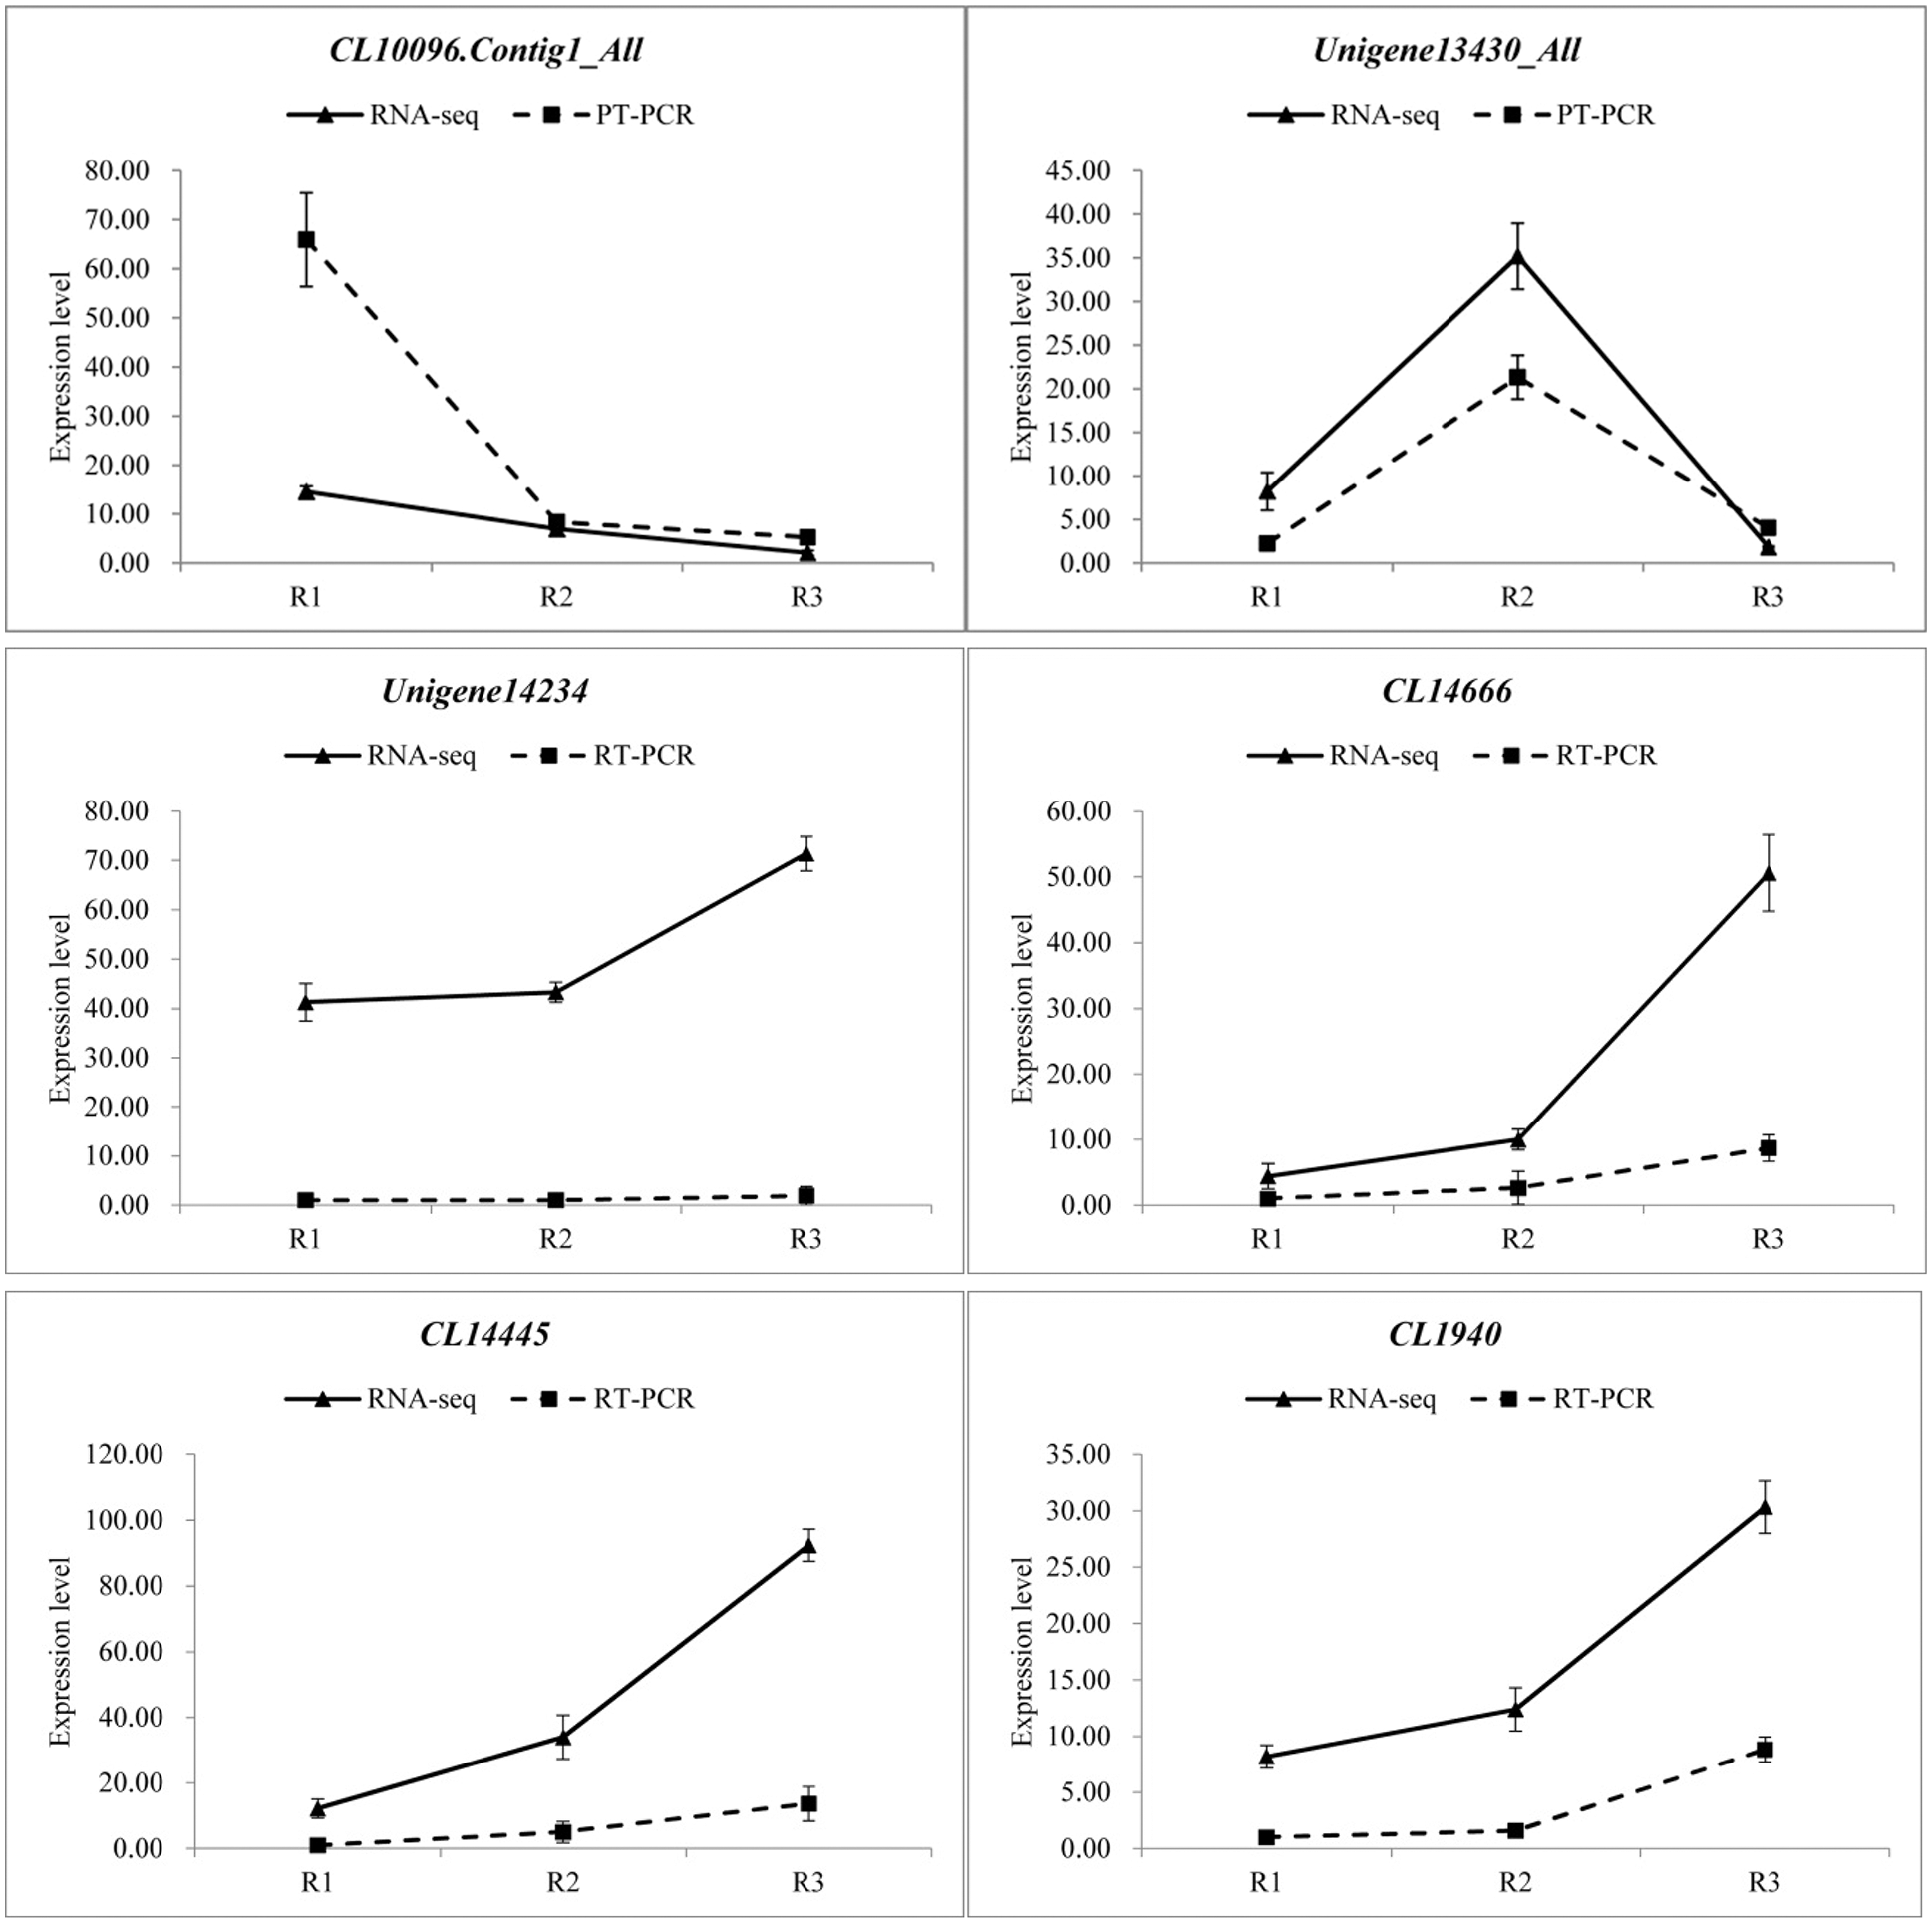
Figure 8: qRT-PCR verification of transcriptome data (Random selection of 12 differential genes, Each column represents the mean of three independent measurements. Error bars represent the SD of the mean values. Diferent letters represent signifcant diference at p ≤ 0.05 using Duncan’s post-hoc test)
3.9 Heatmap Analysis of DEGs in Auxin Pathway
The cluster annotation and heatmap analysis of DEGs in the auxin pathway (Fig. 9) showed that Unigene13430_All was highly expressed in the R2 period, extremely low in the R3 period, and centered in the R1 period. CL10096.Contig1_ All also expressed very low in R3, but high in R1, and relatively low in R2. Unigene 61813_All and CL14666.Contig4_All were highly expressed only in R1 period, CL12740.Contig1_All was highly expressed in R1 and R2. The DEGs were mainly annotated in IAA27, ARF19, IAA9, ARF8 and other families. Among them, Unigene13430_All and CL10096.Contig1_All showed the most significant differences in expression levels at R1, R2 and R3 periods.
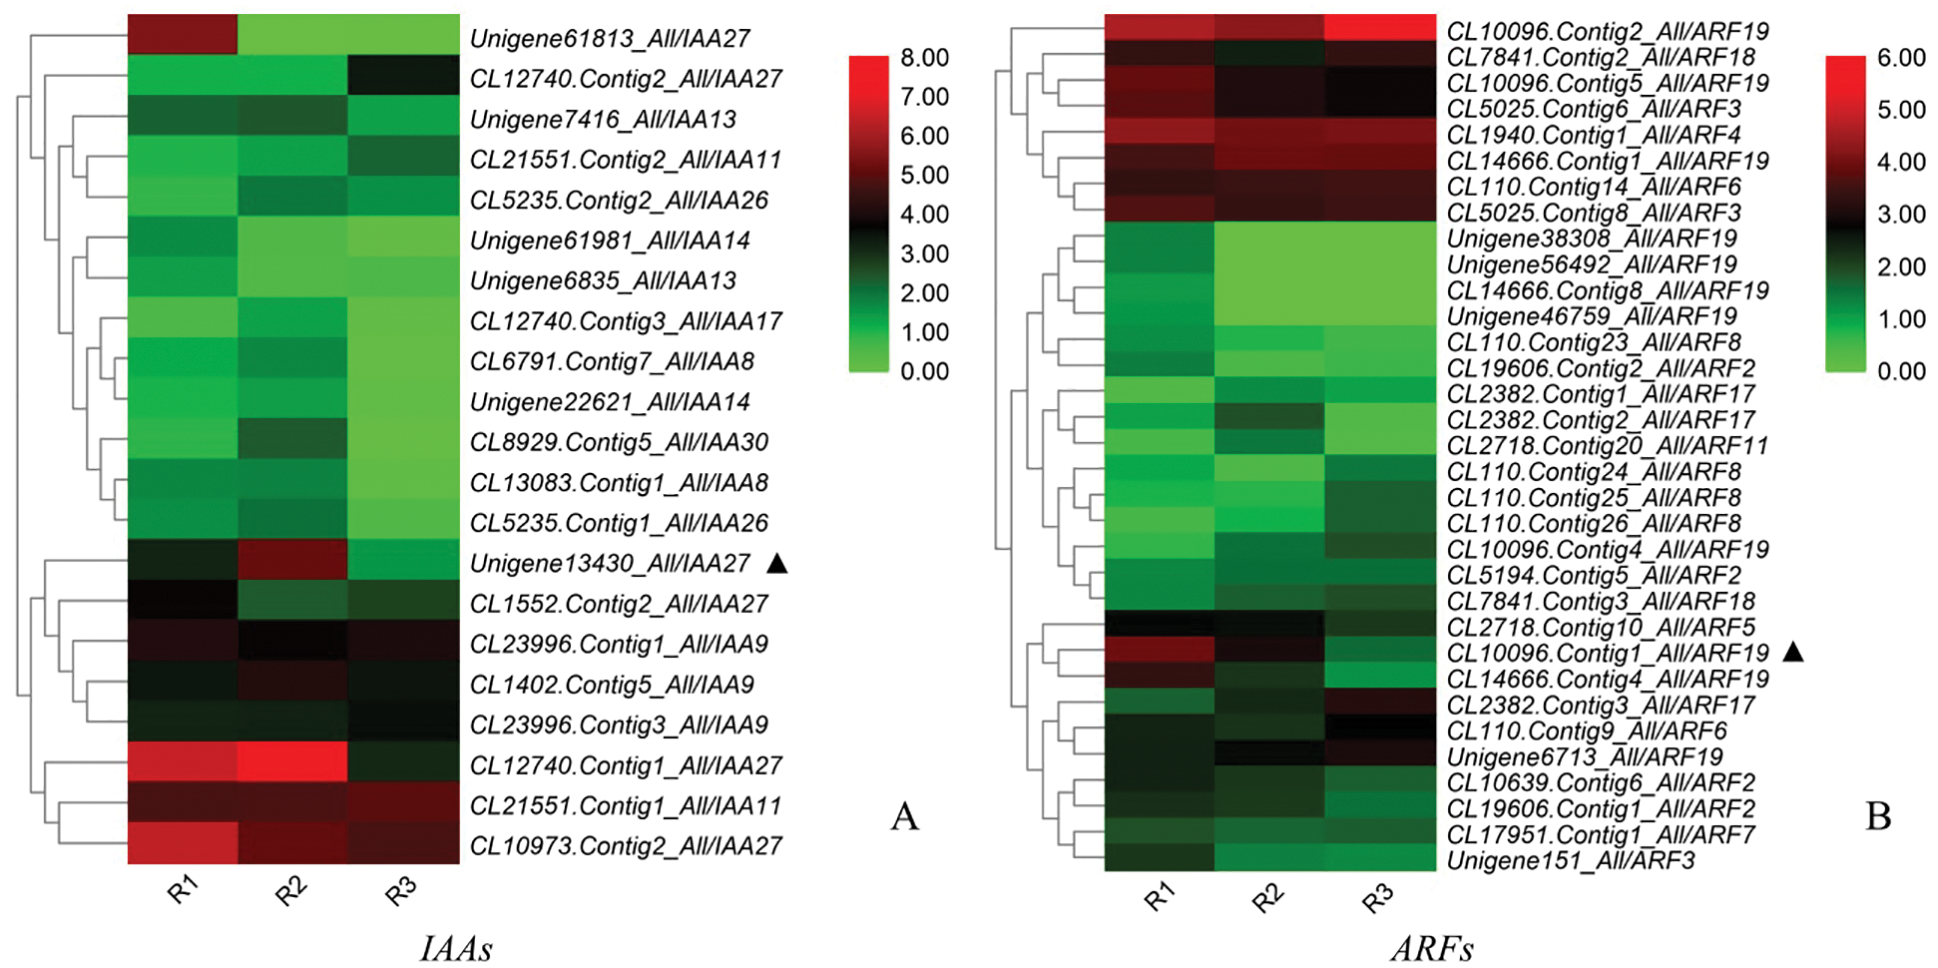
Figure 9: Heatmap analysis of the IAAs and ARFs gene expression levels in the R1, R2, and R3 stages (A: IAAs; B: ARFs. The colour scale indicates a relative fold-change, with red indicates high expression and green low expression)
3.10 Cloning and Analysis of DEGs in Auxin Pathway
Since the most DEGs were clustered into auxin pathway, mainly IAA27 and ARF19, the related genes Unigene13430_All and CL10096.Contig1_All were cloned by combining transcriptome database. Their sequences were amplified by PCR. The full-length Unigene13430_All coding sequence consists of 843 bp, encoding 280 amino acids. The full-length CL10096.Contig1_All coding sequence comprises 1,470 bp, encoding 489 amino acids. A smart BLAST protein sequence analysis revealed that Unigene13430_All encode a complete AUX-IAA domain, which was similar with the IAA27 of Macadamia ntegrifolia, Telopea speciosissima, Vitis riparia, Juglans regia, Carya illinoinensis, Ziziphus jujuba, Prunnus avium, Vigna unguiculata and Cajanus cajan (Fig. 10A). CL10096.Contig1_All also encode a complete AUX-IAA domain, which was similar with the ARF19 of Vitis inifera, Prosopis alba, Carica papaya, Pistacia vera, Jatropha curcas, Quercus lobata, Hevea brasiliensis, Camellia sinensis and Ricinus communis (Fig. 10B).
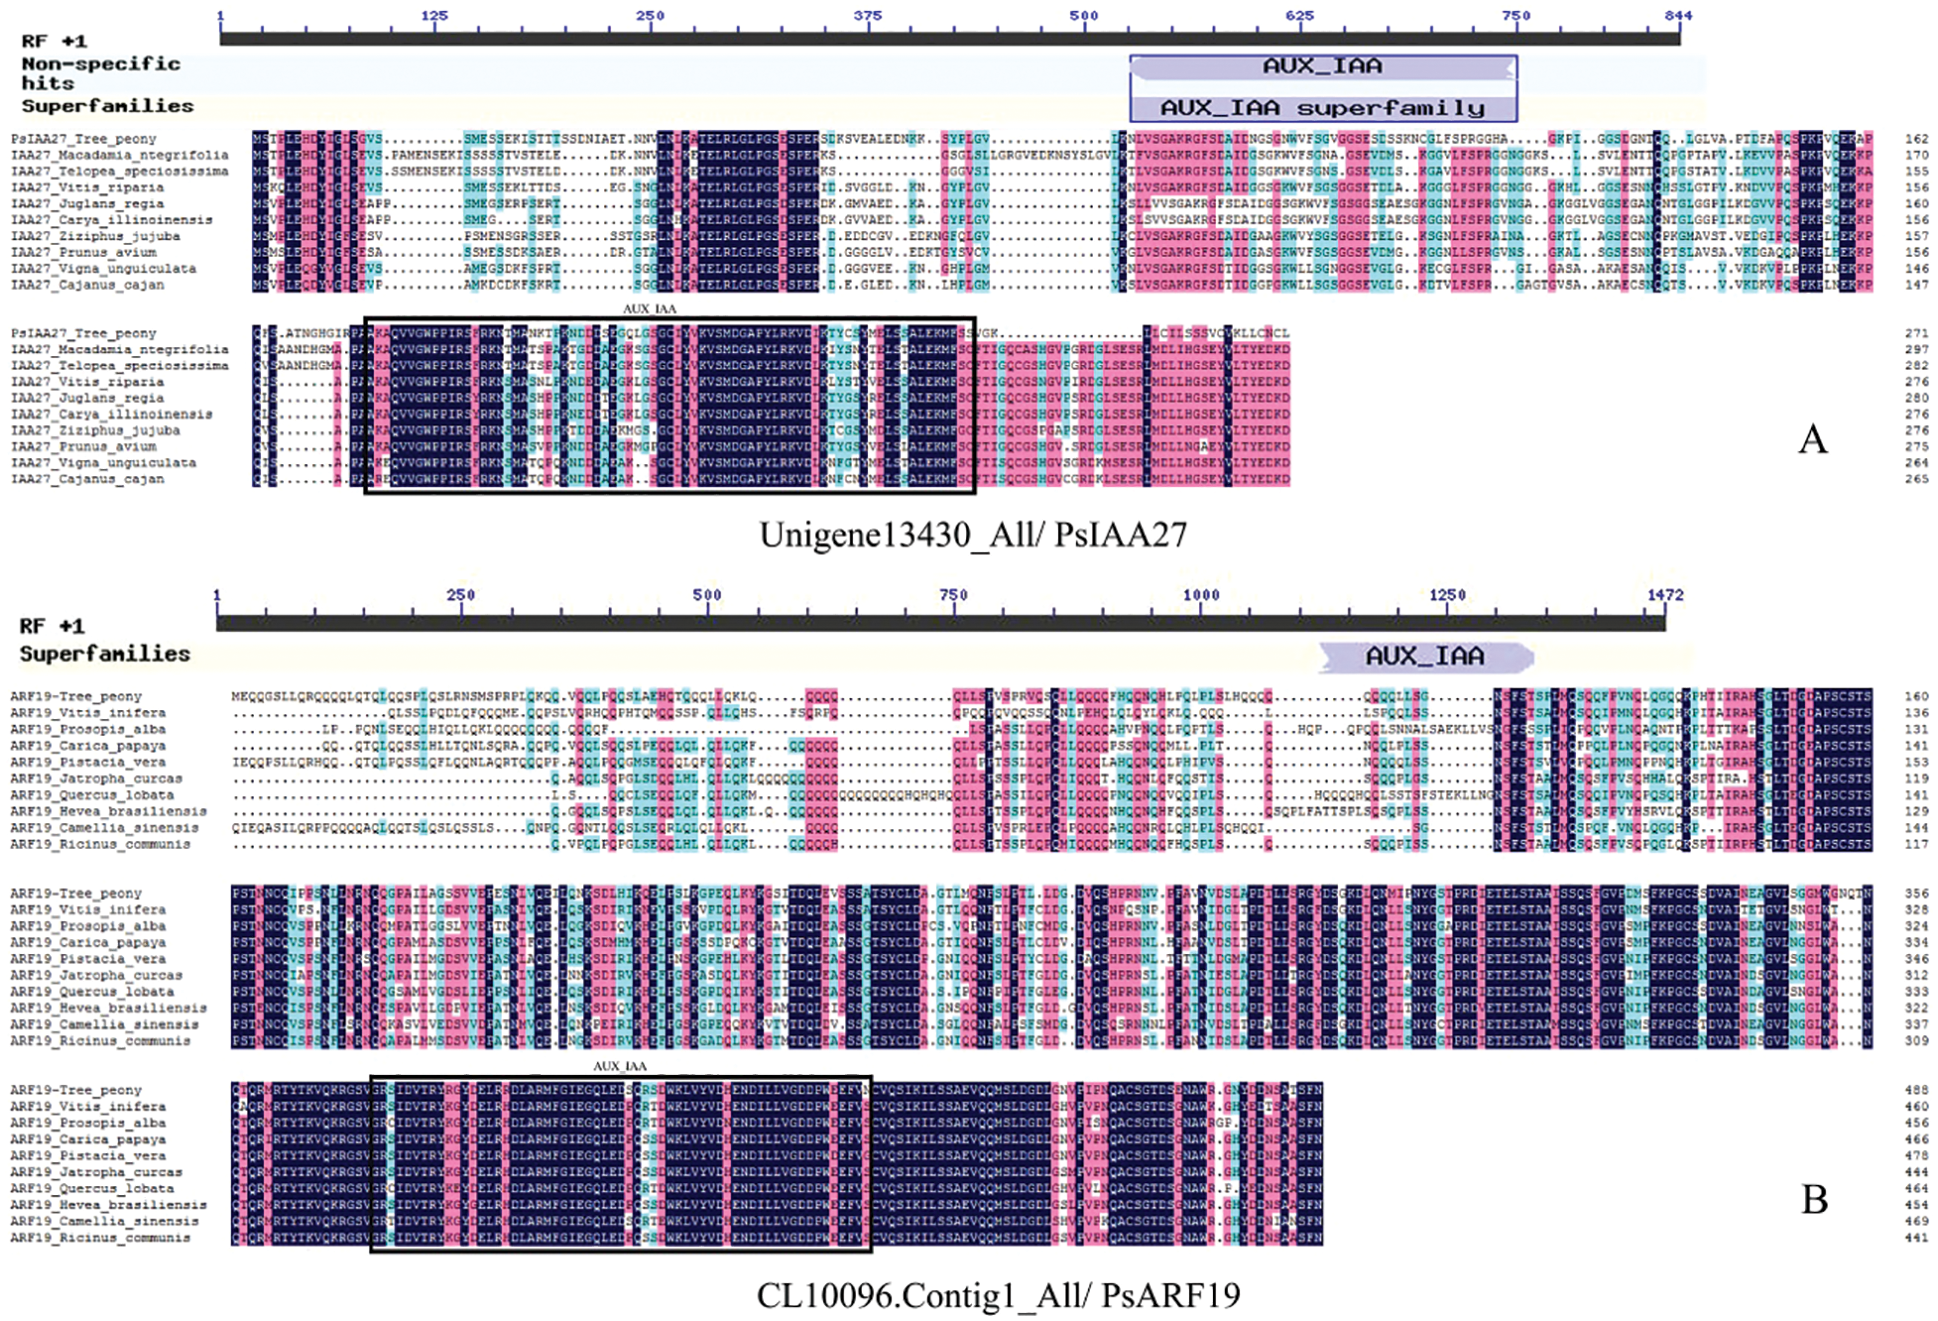
Figure 10: Protein conservative domain analysis (A: Unigene13430_All/PsIAA27, B: CL10096.Contig1_All/PsARF19)
Phylogenetic tree clustering analysis of Unigene13430_All and CL10096.Contig1_All with all IAA and ARF sequences in Arabidopsis thaliana showed that Unigene13430_All was clustered with IAA27 in Arabidopsis thaliana, and CL10096.Contig1_All was clustered with ARF19 in Arabidopsis thaliana. Therefore, Unigene13430_All and CL10096.Contig1_All were designated as PsIAA27 and PsARF19 in tree peony, respectively (Fig. 11).
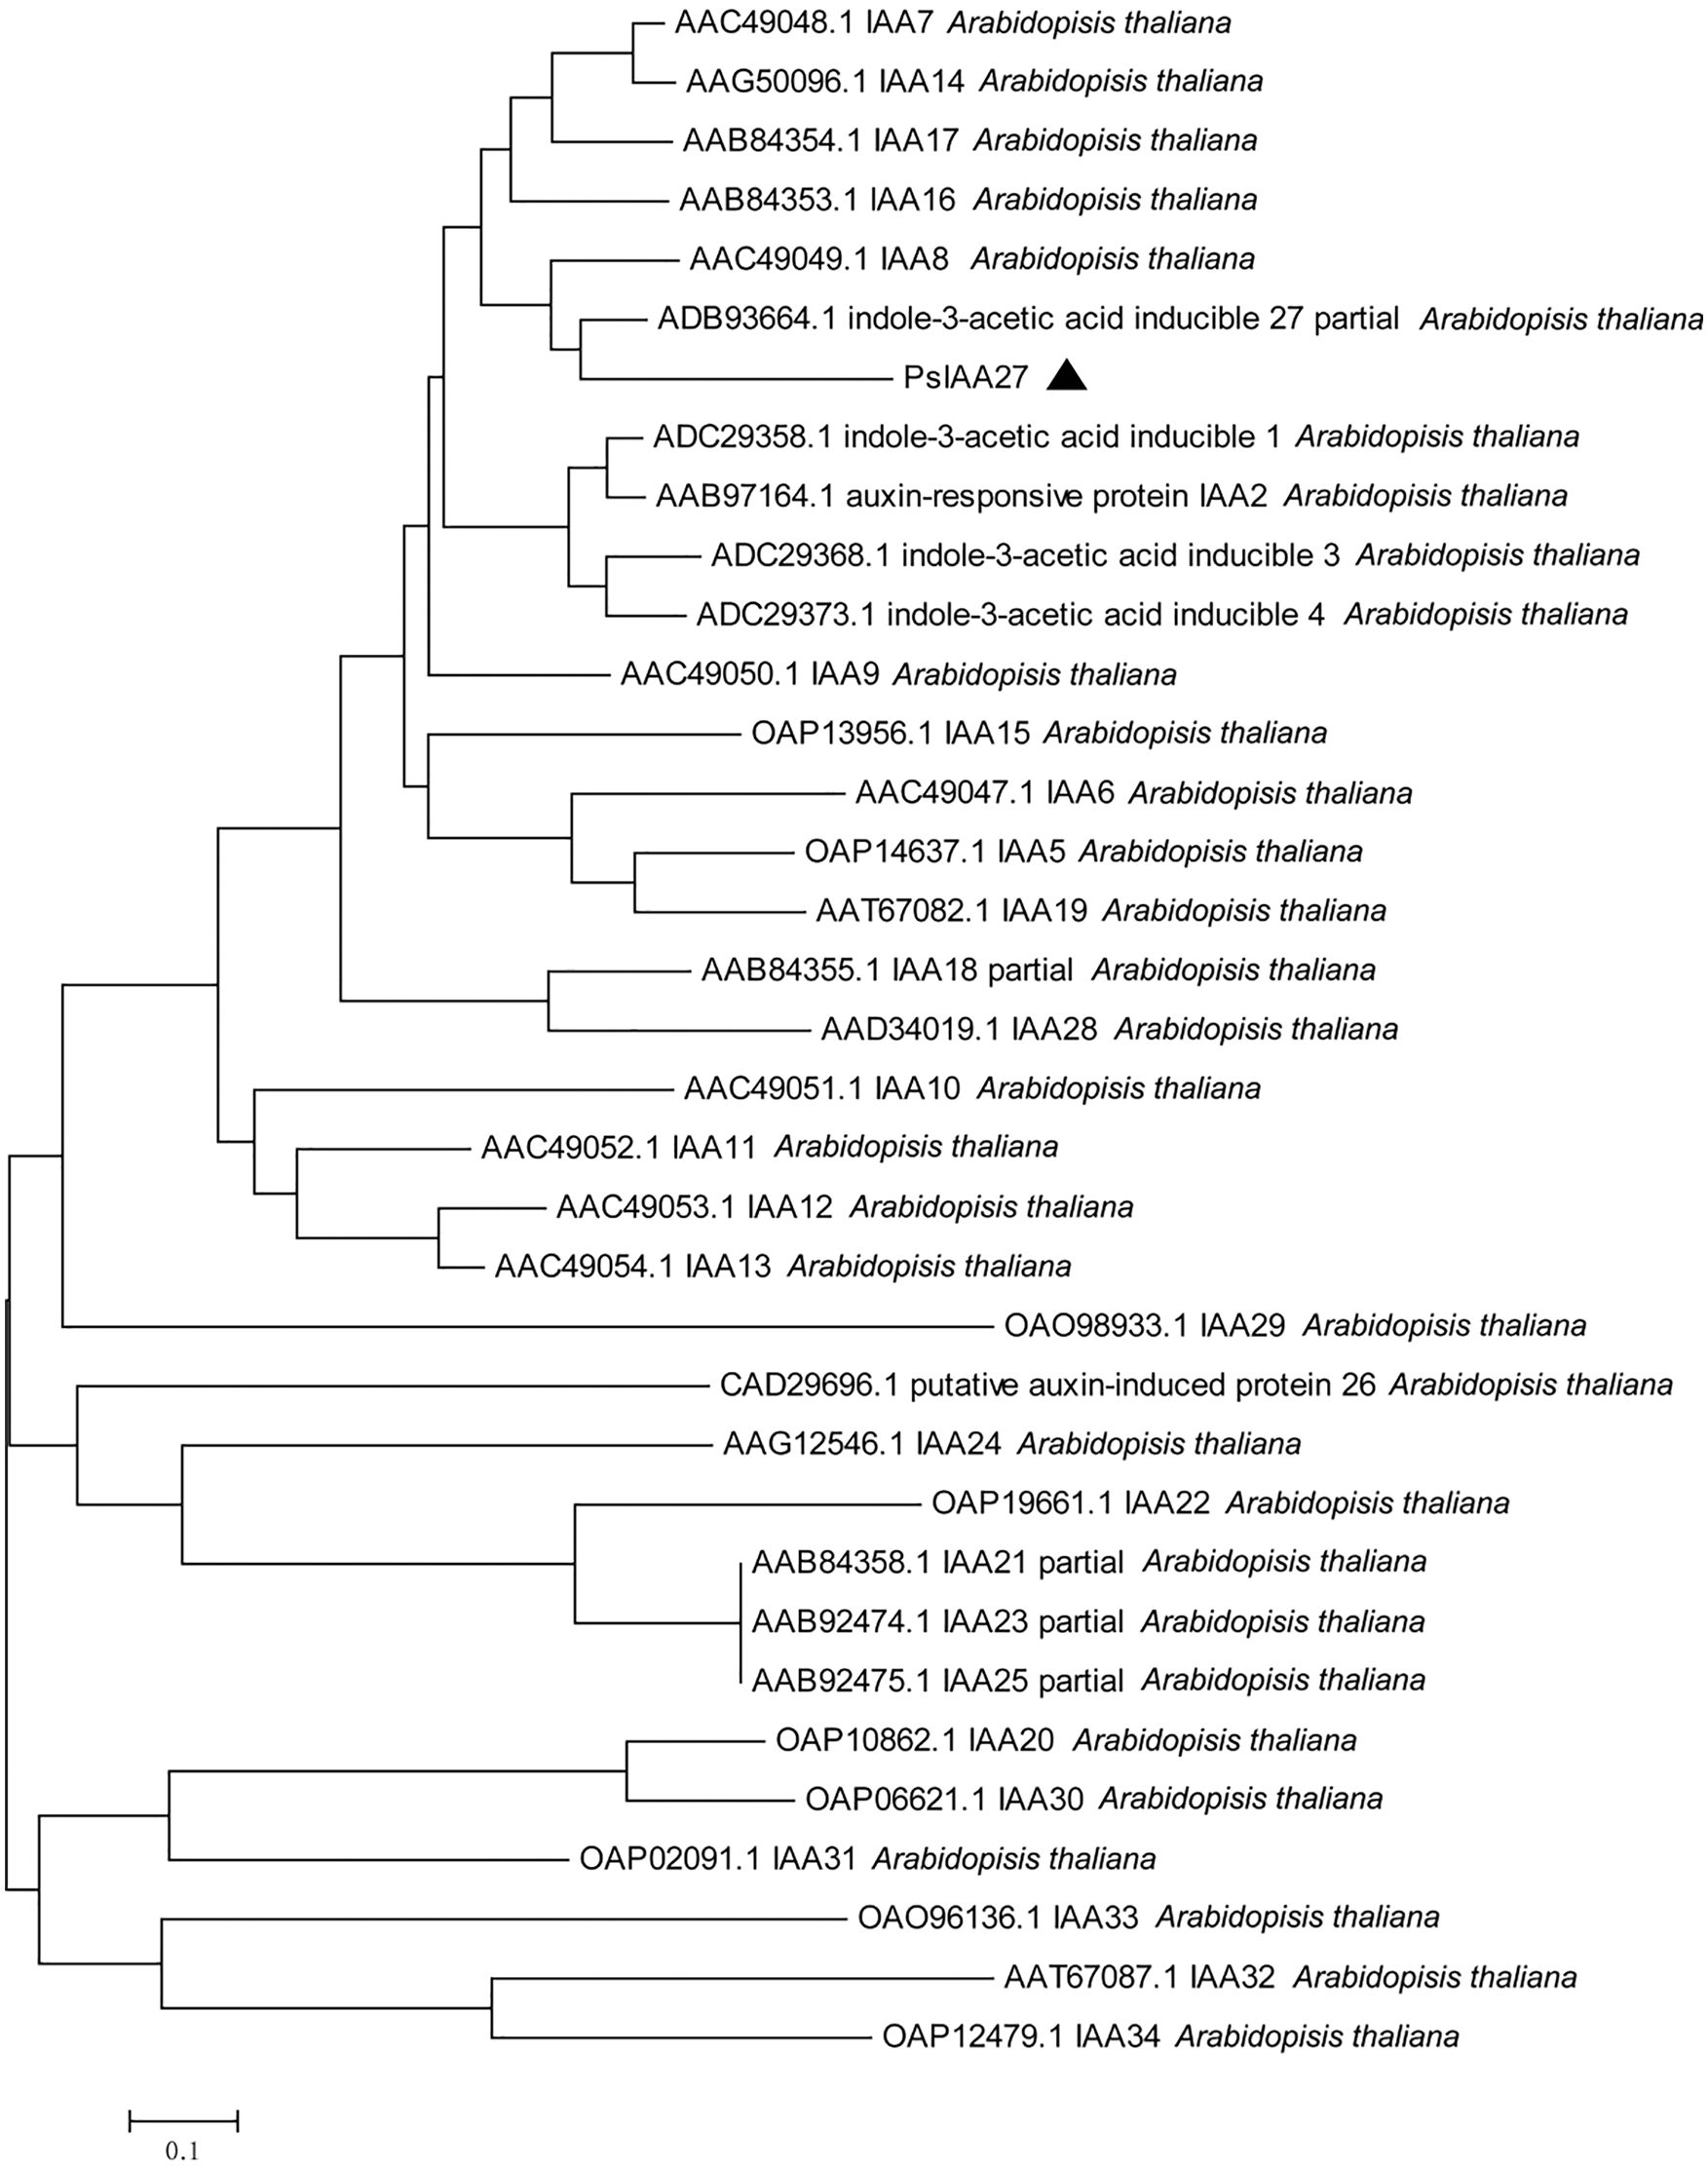
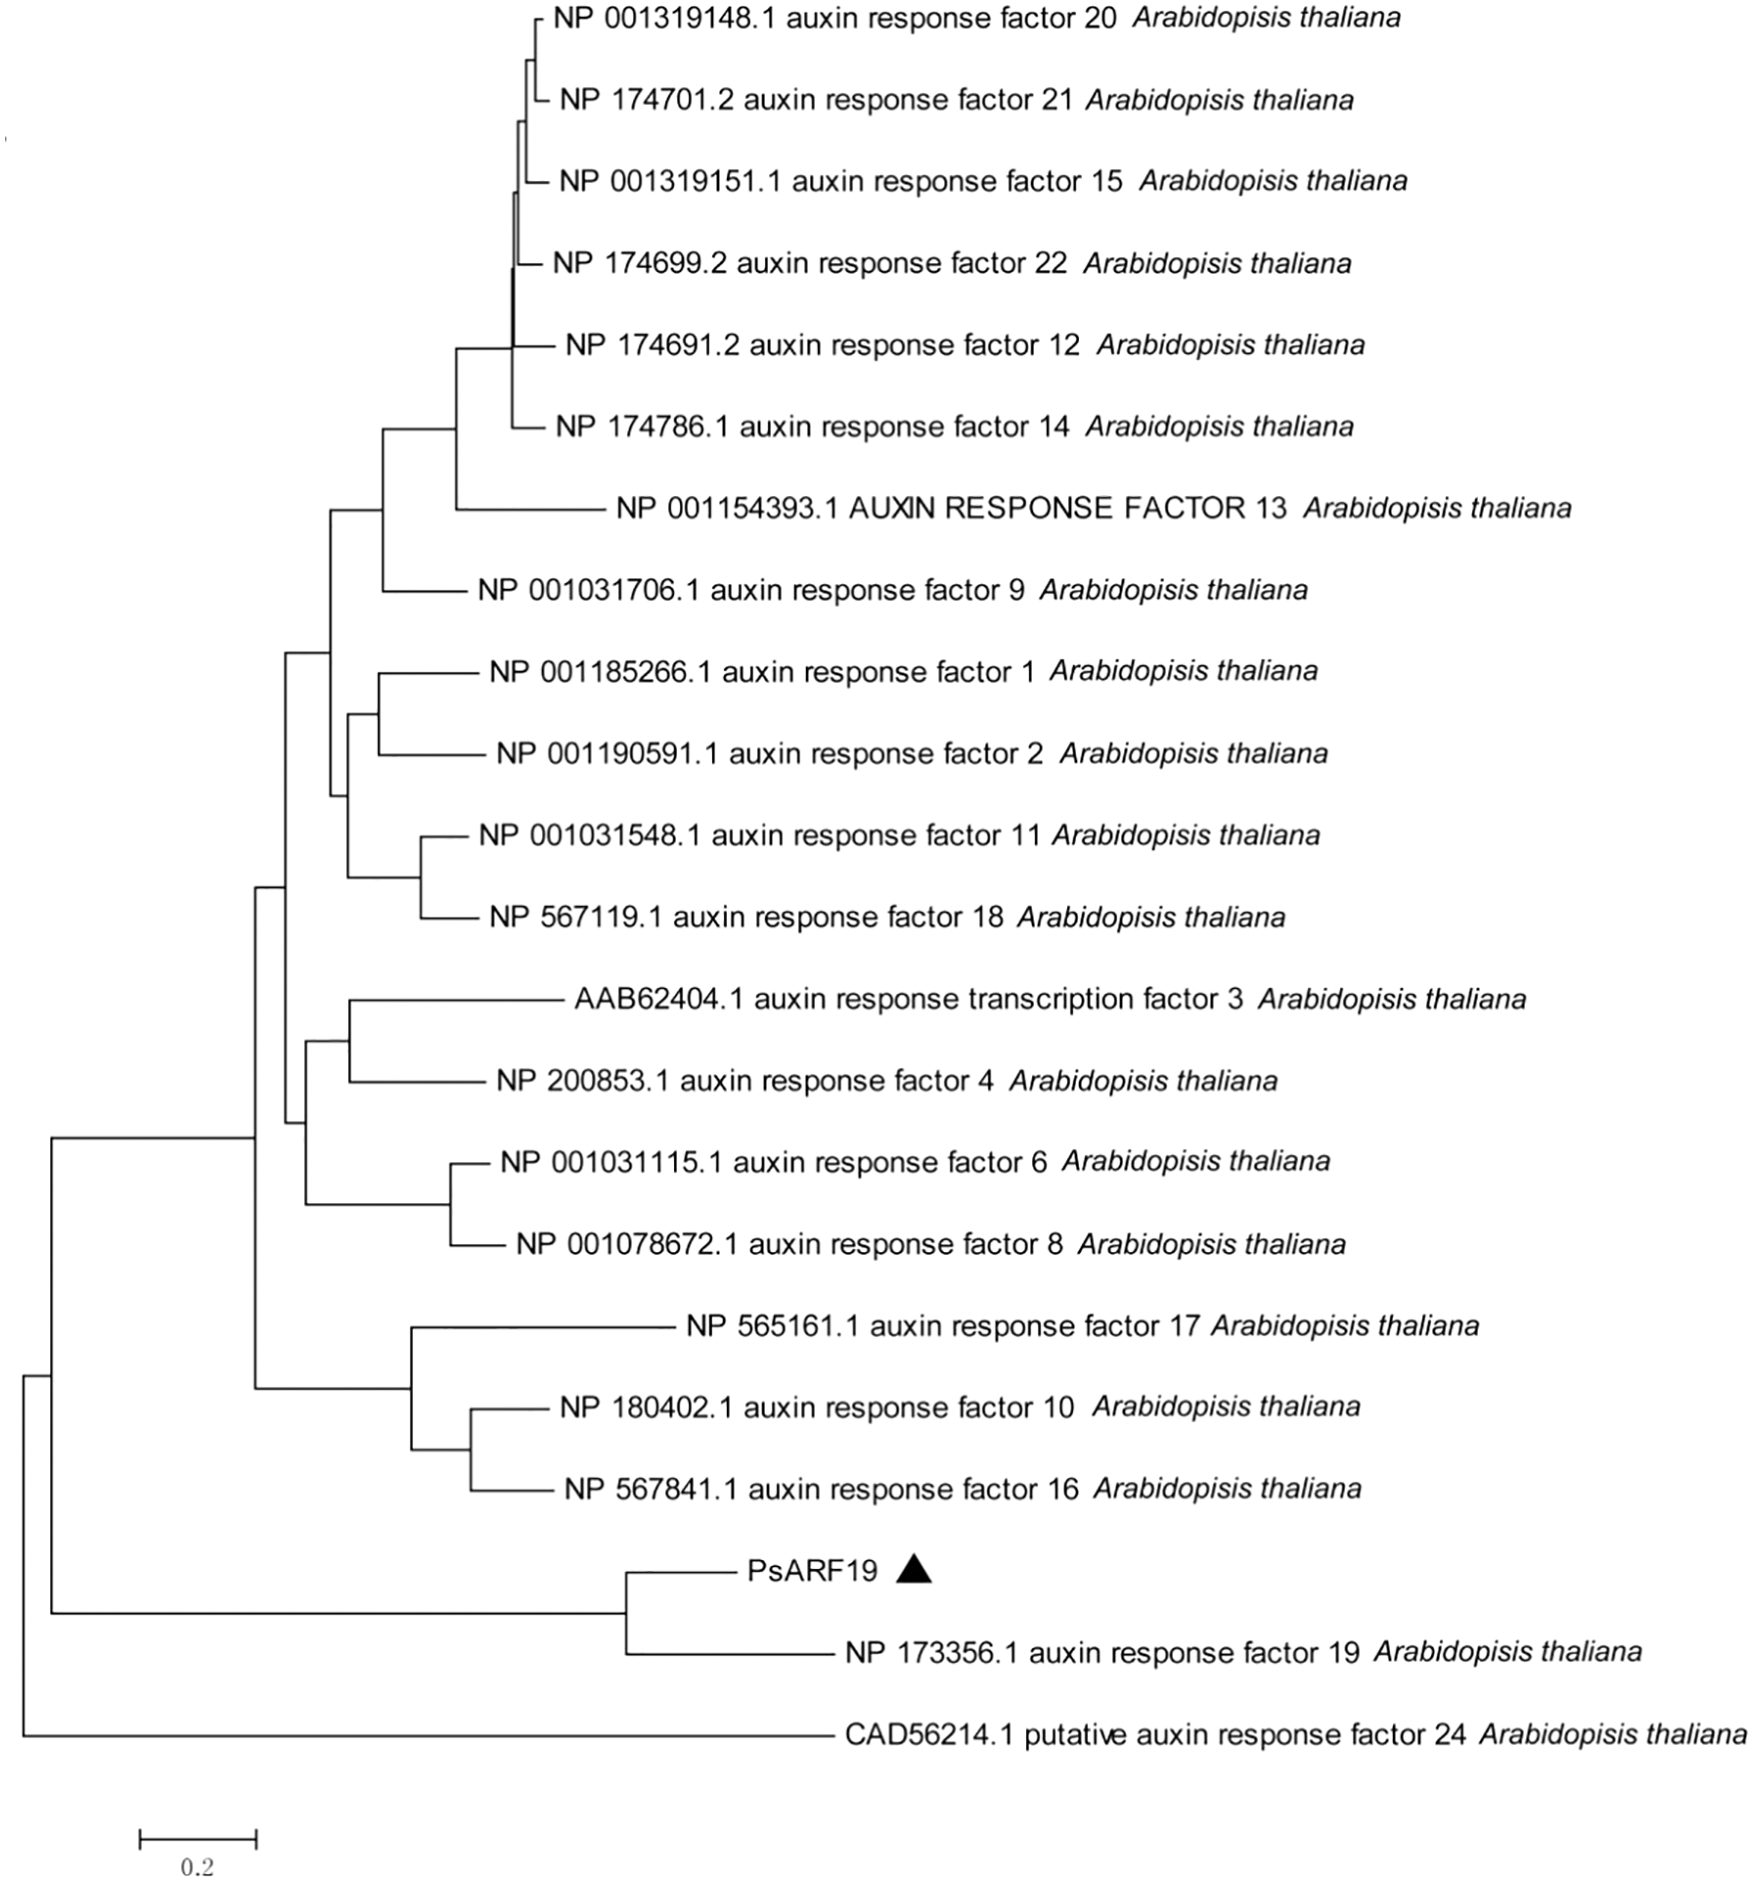
Figure 11: Evolutionary tree analysis (The black triangle marker gene is the gene used in this research, Unigene13430_All: PsIAA27, CL10096.Contig1_All: PsARF19)
3.11 RT-PCR of PsIAA27 and PsARF19 in Different Tree Peony Roots
The expression of PsIAA27 and PsARF19 were detected in the rooting critical period of seedlings, cuttings and grafted scion by RT-PCR (Fig. 12). As shown in Fig. 13, their expression levels were differences at different rooting stages of seedlings, cuttage seedlings and graft seedlings. Among them, the expression level of PsIAA27 showed a increased first and then decreased trend in seedlings and it was highest in R2 stage. However, the expression level of PsIAA27 was gradual upward in cuttings and grafted scion, and both achieved the maximum value in R3 stage. The PsIAA27 expression abundance in cuttings was higher than that of grafted scion in R3 stage, but lower than that of seedlings in R2 stage. The expression level of PsARF19 showed a upward trend during the three periods, and all got the highest value in R3 stage. The PsARF19 expression abundance in seedlings was the highest in R3 stage, but lower than that of cuttings in R2 stage, and no significant difference.
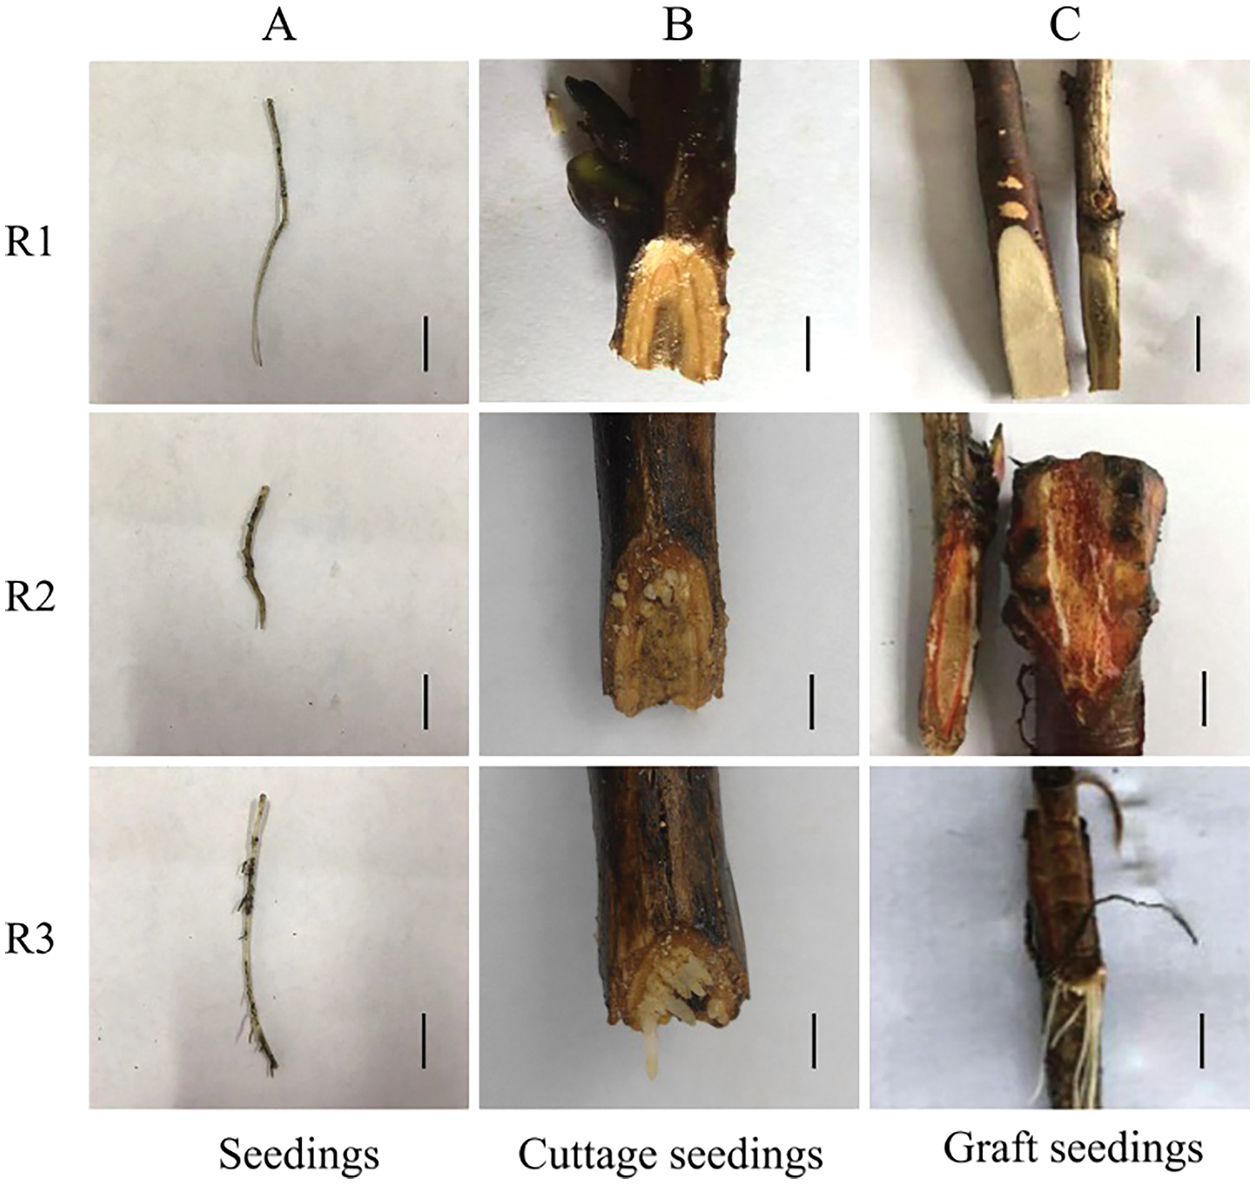
Figure 12: Rooting critical period of tree peony seedlings, cuttings and grafted scion for qRT-PCR (A: Seedlings, B: Cuttage seedlings, C: Graft seedlings. The black scale bar is 1 cm)
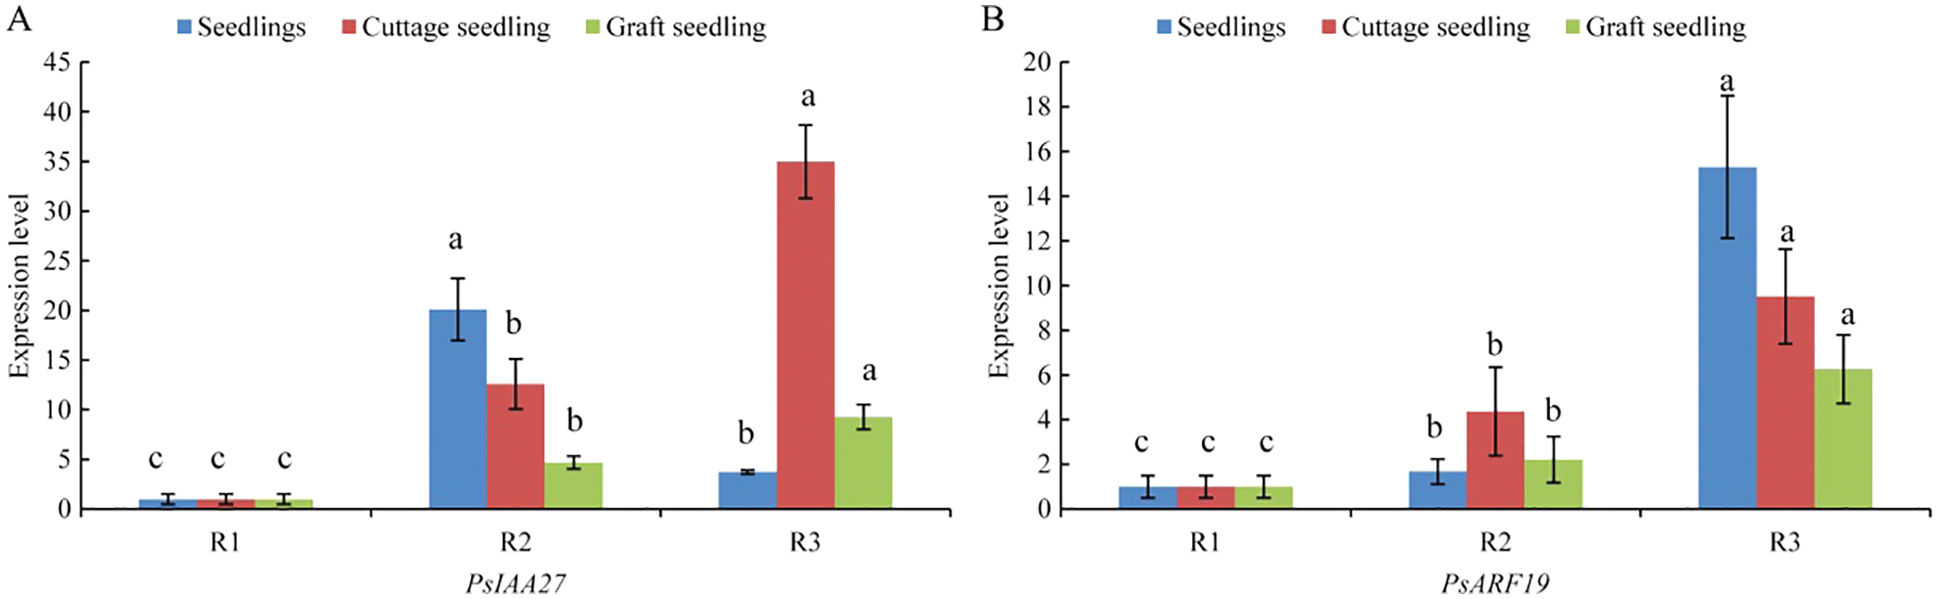
Figure 13: RT-PCR of PsIAA27 and PsARF19 during roooting of tree peony seedlings, cuttings and grafted scion. (A: PsIAA27, B: PsARF19. Diferent letters represent signifcant diference at p ≤ 0.05 using Duncan’s post-hoc test)
3.12 Functional Analysis of PsIAA27 and PsARF19 in Transgenic Arabidopsis
The overexpression vectors pD1301S-PsIAA27 and pD1301S-PsARF19 were constructed and inserted into wild-type Arabidopsis plants. The PsIAA27 and PsARF19 expression levels were significantly higher in the T1 transgenic Arabidopsis plants than in the wild-type control plants (Fig. 14A), indicating that the overexpression vectors were successfully incorporated into the T1 Arabidopsis plants. Continuing to cultivate transgenic Arabidopsis to harvest T2 homozygous transgenic Arabidopsis. Further analyses of the T2 Arabidopsis generation revealed that the plants transformed with the PsIAA27 overexpression vector had significantly longer roots and had less lateral roots than the wild-type control plants (Fig. 14B). Furthermore, the lateral root number and lehgth of the T2 Arabidopsis plants transformed with the PsARF19 overexpression vector was significantly greater than that of the wild-type control plants (Fig. 14B). These observations suggested that PsIAA27 promoted the elongation of roots, but inhibited the development of lateral roots, whereas PsARF19 significantly promoted roots elongation and the development of lateral roots (Fig. 14C).
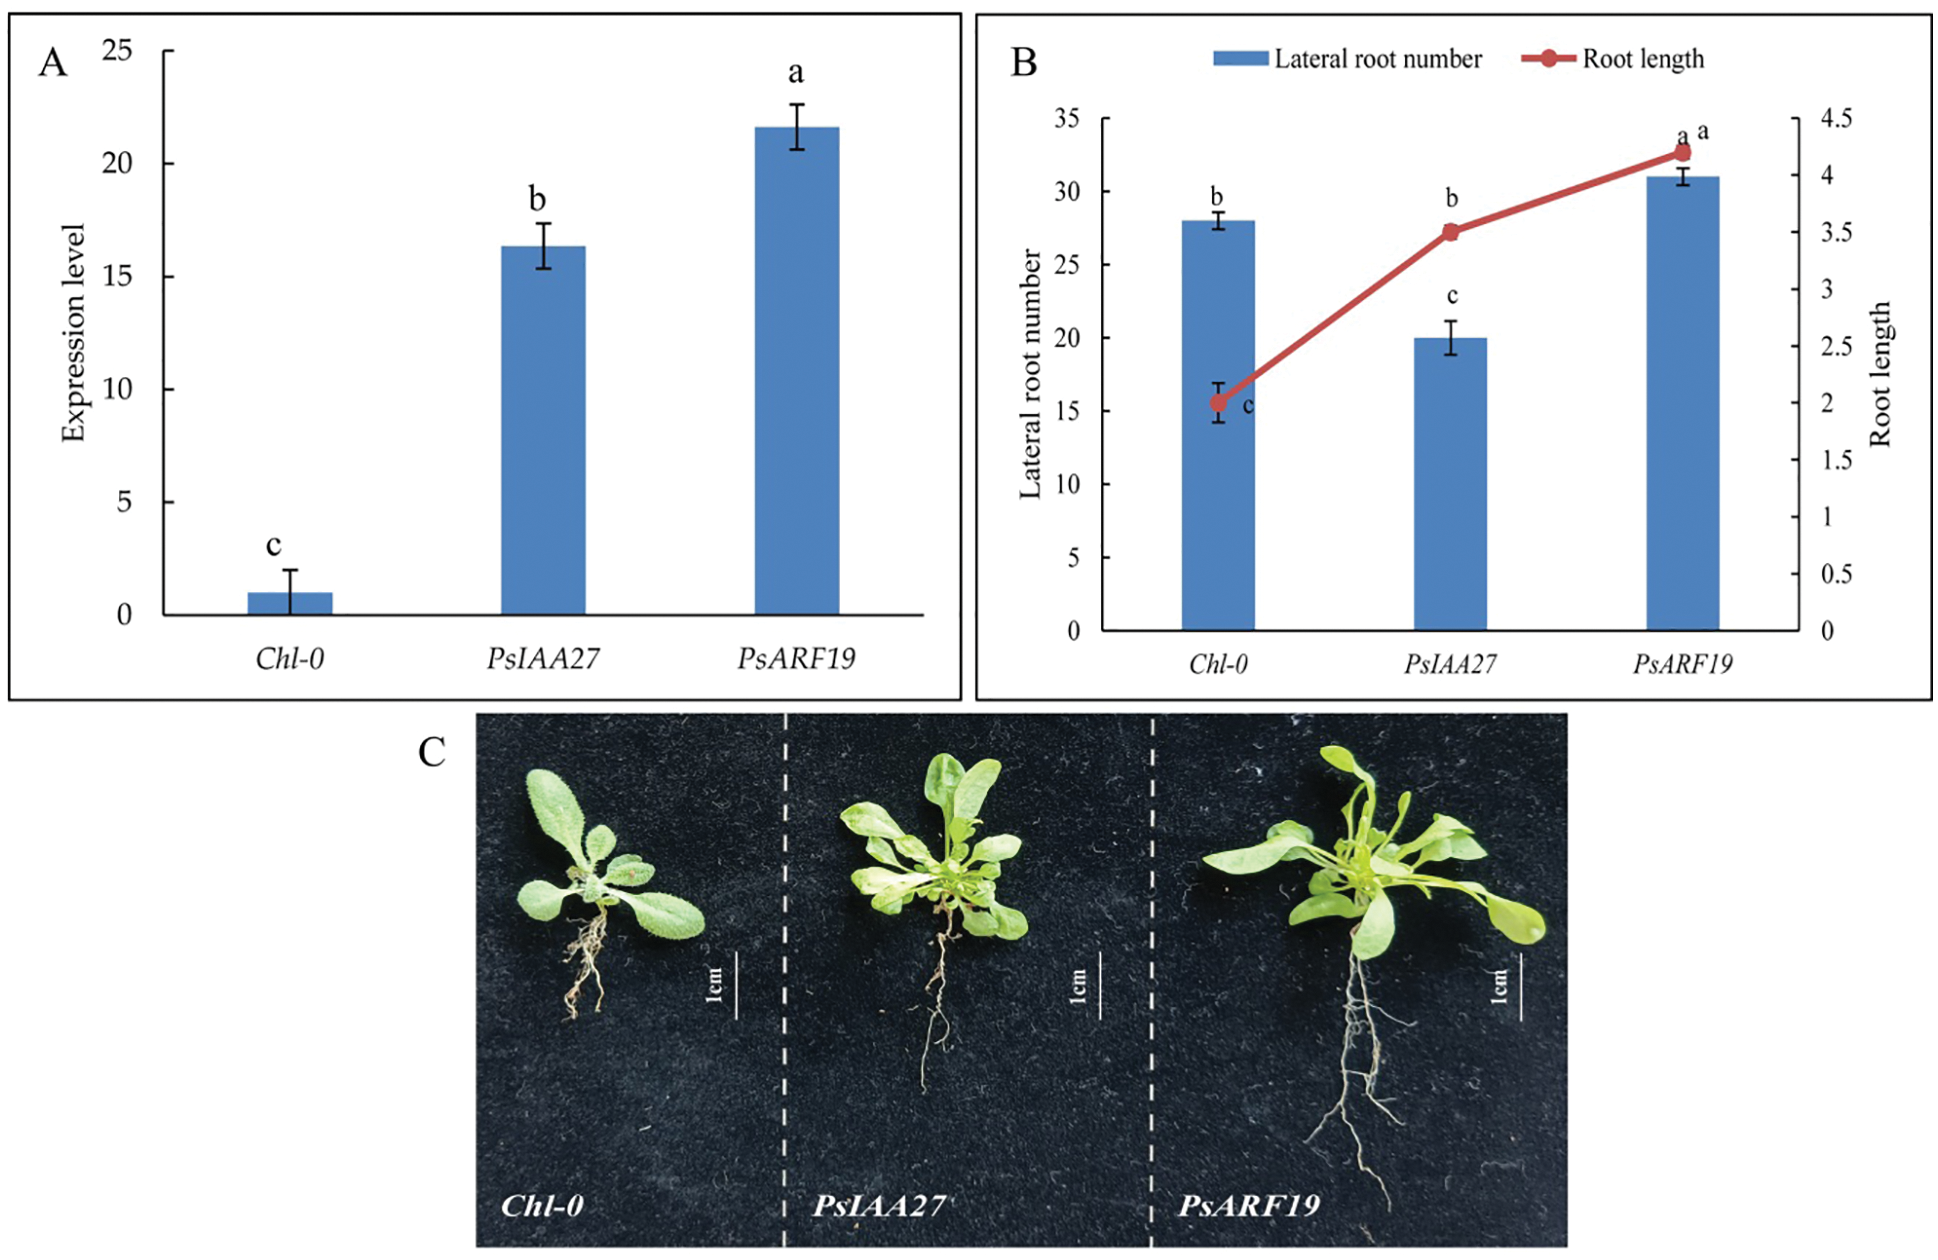
Figure 14: Positive Arabidopsis RT-PCR verification and phenotypic traits. (A: Positive identification, B: Morphological variation, C: Phenotypic traits. Diferent letters represent signifcant diference at p ≤ 0.05 using Duncan’s post-hoc test)
The development of tree peony industrialization urgently needs the establishment of a rapid propagation system by tissue culture. However, in the process of tissue culture of tree peony, there are problems such as difficult to induce explants to form roots, and a large proportion of the roots that do form are poor quality, with a disconnect between the root and the stem. This results in low survival rates of plantlets at the trans-planting stage [5,7,33,34]. Therefore, the transcriptome analysis of the critical period of rooting of seedlings, and combine with the relevant verification of cuttings and grafting, can provide a certain reference for the rooting of tree peony in vitro. In this study, a transcriptome sequence database of tree peony seedlings under sandy loam cultivation at different rooting periods was established. A total of 31.63 Gb raw data were obtained for the sequenced transcriptome (Table 2). Additionally, 207,856 unigenes were assembled, with an average length of 911.98 bp (Table 3). Moreover, 45,216 unigenes were annotated according to at least one database (i.e., NR, NT, Swiss-Prot, KEGG, and GO; Table 3).
The identified DEGs at the different tree peony rooting stages were mainly associated with the auxin pathway, but many genes had down-regulated expression levels in R2 (i.e., induced root primordium; Fig. 4). This may explain why there were relatively few tree peony roots. During the transition from R2 to R3 (i.e., from induced root primordium to lateral root formation), there was no major difference in the number of up-regulated and down-regulated genes in the auxin pathway (Fig. 4). This indicates that after the root primordium forms, auxin likely plays a regulatory role and does not function as an inducer. From R1 to R2 (i.e., ungerminated root primordium to induced root primordium), there were considerably fewer DEGs in the gibberellin and zeatin pathways than in the auxin pathway (Fig. 4). During this period, the DEGs in the abscisic acid pathway were mostly down-regulated, implying that abscisic acid and auxin coordinately influence root development. From R2 to R3, there was an equal number of up-regulated genes and down-regulated genes in the auxin pathway (Fig. 4). Additionally, there were more DEGs in the auxin pathway than in the other three pathways, suggesting that the auxin content increases during the entire rooting process, possibly reflecting a major regulatory role. The DEGs in auxin pathway with the most significant changes in expression were mainly annotated in IAA27 and ARF19 (Fig. 9). Both Unigene13430_All and CL10096.Contig1_All were cloned; on the basis of a bioinformatics analysis, these genes were named PsIAA27 and PsARF19 (Figs. 10 and 11), respectively.
Bassa et al. [35] reported that the expression pattern of SI-IAA27 differed from that of traditional auxin genes. The expression of most auxin genes is regulated by auxin. The expression of SI-IAA27 alters auxin sensitivity. The down-regulated expression or silencing of SI-IAA27 leads to increased auxin sensitivity, thereby improving root development. In contrast, the overexpression of this gene significantly changes the endogenous auxin gradient in roots and inhibits lateral root formation, ultimately resulting in relatively few roots [36]. In this study, the PsIAA27 expression level was higher in R2 than in R1 and R3 (Figs. 8 and 13), which may have affected the concentration of endogenous auxin in the roots and inhibited the formation of lateral roots. This might also help to explain why there were few tree peony lateral roots. We speculated that PsIAA27 influences auxin sensitivity and polar transport. High expression of PsIAA27 could promote main root elongation, but had a certain inhibitory effect on lateral root development.
The protein encoded by the ARF gene can bind to auxin and activate the production of auxin-related factors, which then regulate the expression of specific genes [37,38]. ARF19 is important for root formation, it has shown that ARF19 can coordinate with ARF7 to regulate the expression of CHI and IAA14, thereby regulating lateral root development, and arf7 arf19 can cause severely impaired lateral root formation and abnormal gravitropism in both hypocotyl and root [39–41]. A previous study by Okushima et al. [42] confirmed that ARF19 contributes to the early stage of root formation, possibly by modulating the induction of the root primordium. Other investigations proved that ARF19 regulates the formation of Arabidopsis adventitious roots, indicating that ARF19 has a critical role related to root development [39,43,44]. However, other ARFs can stimulate root development in the absence of ARF19 [41]. In this study, PsARF19 was more highly expressed in R3 than in R2 and R1 (Fig. 13), and gradually increased with the rooting process, which may have influenced the formation of tree peony rooting. This gene is expected to be expressed during the tree peony root induction period.
In summary, our RNA-seq analysis involving one nucleotide database and five functional protein databases resulted in the annotation of 120,188 unigenes. We mainly focused on identifying genes that regulate root formation under sandy loam cultivation. In this study, auxin and the related genes were revealed to be important for the induction and formation of roots in tree peony. The expression of PsIAA27 and PsARF19 significantly affected roots development of tree peony, and had similar effects in seedlings, cuttings and grafted seedlings, but the specific mechanisms were different. The data presented herein indicated that PsARF19 might be a regulatory gene related to the formation of tree peony roots, whereas PsIAA27 might be involved in regulating auxin sensitivity during root development. However, the specific mechanisms underlying the functions of these genes will need to be thoroughly investigated in future studies. The findings of this study provide a theoretical basis for future research on the mechanism mediating peony root formation. They may also be relevant for optimizing tree peony tissue culture, cuttings and grafting. The generated transcriptome data represent an excellent resource for exploring the genes involved in tree peony root development.
Authorship: Study conception and design: Z.W. and S.H.; data collection: Y.S., X.M., L.S.; analysis and interpretation of results: Y.S., D.H., X.L., Y.S.; draft manuscript preparation: Y.S., W.S. All authors have read and agreed to the published version of the manuscript.
Data Availability Statement: Data supporting the reported results will be available and provided upon request.
Funding Statement: This study was financially supported by the National Key Research and Development Program of China (Grant No. 2020YFD1000503), the Natural Science Foundation of China (Grant Nos. 31870698, 32001353), the Key Scientific and Technological Projects of Henan Province (Grant No. 202102110083), and the Science and Technology Program of Shanghai (Grant No. 21DZ1202000).
Conflicts of Interest: The authors declare that they have no conflicts of interest to report regarding the present study.
References
1. Cheng, F. Y. (2007). Advances in the breeding of tree peonies and a cultivar system for the cultivar group. International Journal of Plant Breeding, 1(2), 89–104. DOI 10.3923/ijpbg.2007.89.94. [Google Scholar] [CrossRef]
2. Zhang, Y. X., Si, F. H., Wang, Y. Y., Liu, C. Y., Zhang, T. et al. (2020). Application of 5-azacytidine induces DNA hypomethylation and accelerates dormancy release in buds of tree peony. Plant Physiology and Biochemistry, 147, 91–100. DOI 10.1016/j.plaphy.2019.12.010. [Google Scholar] [CrossRef]
3. Tian, D. K., Tile, K. M., Dane, F., Woods, F. M., Sibley, J. L. (2010). Comparison of shoot induction ability of different explants in herbaceous peony (Paeonia lactiflora pall.). Scientia Horticulturae, 123(3), 385–389. DOI 10.1016/j.scienta.2009.10.007. [Google Scholar] [CrossRef]
4. Gai, S. P., Zhang, Y. X., Liu, C. Y., Zhang, Y., Zheng, G. S. (2013). Transcript profiling of Paoenia ostii during artificial chilling induced dormancy release identifies activation of GA pathway and carbohydrate metabolism. PLoS One, 8(2), e55297. DOI 10.1371/journal.pone.0055297. [Google Scholar] [CrossRef]
5. Wen, S. S., Cheng, F. Y., Zhong, Y., Wang, X., Li, L. Z. et al. (2016). Efficient protocols for the micropropagation of tree peony (Paeonia suffruticosa ‘Jin Pao hong’, P. suffruticosa ‘Wu long peng sheng’, and P. × lemoinei ‘High noon’) and application of arbuscular mycorrhizal fungi to improve plantlet establishment. Scientia Horticulturae, 210, 10–17. DOI 10.1016/j.scienta.2016.01.022. [Google Scholar] [CrossRef]
6. Beruto, M., Curir, P. (2007). In vitro culture of tree peony through axillary budding. In: Jain, S. M., Häggman, H. (Eds.Protocols for micropropagation of woody trees and fruits, pp. 477–497. Dordrecht: Springer. DOI 10.1007/978-1-4020-6352-7_44. [Google Scholar] [CrossRef]
7. Shang, W. Q., Wang, Z., He, S. L., He, D., Liu, Y. P. et al. (2017). Research on the relationship between phenolic acids and rooting of tree peony (Paeonia suffruticosa) plantlets in vitro. Scientia Horticulturae, 224, 53–60. DOI 10.1016/j.scienta.2017.04.038. [Google Scholar] [CrossRef]
8. Lydia, B., Monique, J., Emile, M. (1994). Requirements for in vitro rooting of Paeonia suffruticosa Andr. cv. ‘Mme de vatry’. Scientia Horticulturae, 58(3), 223–233. DOI 10.1016/0304-4238(94)90154-6. [Google Scholar] [CrossRef]
9. Wang, J. X., Yan, X. L., Pan, R. C. (2005). Relationship between adventitious root formation and plant hormones. Plant Physiology Communications, 41(2), 133–142. [Google Scholar]
10. Steffens, B., Rasmussen, A. (2016). The physiology of adventitious roots. Plant Physiology, 170(2), 603–617. DOI 10.1104/15.01360. [Google Scholar] [CrossRef]
11. Lin, C., Sauter, M. (2018). Control of adventitious root architecture in rice by darkness, light, and gravity. Plant Physiology, 176(2), 1352–1364. DOI 10.1104/17.01540. [Google Scholar] [CrossRef]
12. Liu, G. B., Zhao, J. Z., Liao, T., Wang, Y., Guo, L. Q. et al. (2021). Histological dissection of cutting-inducible adventitious rooting in Platycladus orientalis reveals developmental endogenous hormonal homeostasis. Industrial Crops and Products, 170, 113817. DOI 10.1016/j.indcrop.2021.113817. [Google Scholar] [CrossRef]
13. Pacurar, D. I., Perrone, I., Bellini, C. (2014). Auxin is a central player in the hormone cross-talks that control adventitious rooting. Physiologia Plantarum, 151(1), 83–96. DOI 10.1111/ppl.12171. [Google Scholar] [CrossRef]
14. Lakehal, A., Bellini, C. (2019). Control of adventitious root formation: Insights into synergistic and antagonistic hormonal interactions. Physiologia Plantarum, 165(1), 90–100. DOI 10.1111/ppl.12823. [Google Scholar] [CrossRef]
15. Geuns, J. M. C. (1988). Synergism between IAA and cortisol in the adventitious root formation in mung bean cuttings. Journal of Plant Physiology, 132(3), 370–372. DOI 10.1016/S0176-1617(88)80122-6. [Google Scholar] [CrossRef]
16. Abdellah, L., Salma, C., Emilie, C., Rozenn, L. H., Alok, R. et al. (2019). A molecular framework for the control of adventitious rooting by TIR1/AFB2-aux/IAA-dependent auxin signaling in Arabidopsis. Molecular Plant, 12(11), 1499–1514. DOI 10.1016/j.molp.2019.09.001. [Google Scholar] [CrossRef]
17. Li, Y. H., Mo, Y. W., Wang, S. B., Zhang, Z. (2020). Auxin efflux carriers, MiPINs, are involved in adventitious root formation of mango cotyledon segments. Plant Physiology and Biochemistry, 150, 15–26. DOI 10.1016/j.plaphy.2020.02.028. [Google Scholar] [CrossRef]
18. Liu, N., Cheng, F. Y., Guo, X., Zhong, Y. (2021). Development and application of microsatellite markers within transcription factors in flare tree peony (Paeonia rockii) based on next-generation and single-molecule long-read RNA-seq. Journal of Integrative Agriculture, 20(7), 1832–1848. DOI 10.1016/S2095-3119(20)63402-5. [Google Scholar] [CrossRef]
19. Fukaki, H., Tameda, S., Masuda, H., Tasaka, M. (2002). Lateral root formation is blocked by a gain-of-function mutation in the SOLITARY-ROOT/IAA14 gene of Arabidopsis. Plant Journal, 29(2), 153–168. DOI 10.1046/j.0960-7412.2001.01201.x. [Google Scholar] [CrossRef]
20. Lavenus, J., Goh, T., Roberts, I., Guyomarc’h, S., Lucas, M. et al. (2013). Lateral root development in Arabidopsis: Fifty shades of auxin. Trends in Plant Science, 18(8), 455–463. DOI 10.1016/j.tplants.2013.04.006. [Google Scholar] [CrossRef]
21. Guo, J., Li, C. H., Zhang, X. Q., Li, Y. X., Zhang, D. F. et al. (2020). Transcriptome and GWAS analyses reveal candidate gene for seminal root length of maize seedlings under drought stress. Plant Science, 292, 110380. DOI 10.1016/j.plantsci.2019.110380. [Google Scholar] [CrossRef]
22. Zhang, H., Wang, M. L., Dang, P., Jiang, T., Zhao, S. Z. et al. (2021). Identification of potential QTLs and genes associated with seed composition traits in peanut (Arachis hypogaea L.) using GWAS and RNA-seq analysis. Gene, 769, 145215. DOI 10.1016/j.gene.2020.145215. [Google Scholar] [CrossRef]
23. Zhang, X. P., Zhao, L. Y., Xu, Z. D., Yu, X. Y. (2018). Transcriptome sequencing of Paeonia suffruticosa ‘Shima nishiki’ to identify differentially expressed genes mediating double-color formation. Plant Physiology and Biochemistry, 123, 114–124. DOI 10.1016/j.plaphy.2017.12.009. [Google Scholar] [CrossRef]
24. Dharshini, S., Hoang, N. V., Mahadevaiah, C., Padmanabhan, T. S. S., Alagarasan, G. et al. (2020). Root transcriptome analysis of Saccharum spontaneum uncovers key genes and pathways in response to low-temperature stress. Environmental and Experimental Botany, 171, 103935. DOI 10.1016/j.envexpbot.2019.103935. [Google Scholar] [CrossRef]
25. Dong, W., Li, M. M., Li, Z. A., Li, S. L., Zhu, Y. et al. (2020). Transcriptome analysis of the molecular mechanism of Chrysanthemum flower color change under short-day photoperiods. Plant Physiology and Biochemistry, 146, 315–328. DOI 10.1016/j.plaphy.2019.11.027. [Google Scholar] [CrossRef]
26. Gao, J., Xue, J. Q., Xue, Y. Q., Liu, R., Wang, S. L. et al. (2020). Transcriptome sequencing and identification of key callus browning-related genes from petiole callus of tree peony (Paeonia suffruticosa cv. Kao) cultured on media with three browning inhibitors. Plant Physiology and Biochemistry, 149, 36–49. DOI 10.1016/j.plaphy.2020.01.029. [Google Scholar] [CrossRef]
27. Zhang, Y., Li, C. Y., Wang, S., Yuan, M., Li, B. J. et al. (2021). Transcriptome and volatile compounds profiling analyses provide insights into the molecular mechanism underlying the floral fragrance of tree peony. Industrial Crops and Products, 162, 113286. DOI 10.1016/j.indcrop.2021.113286. [Google Scholar] [CrossRef]
28. Meng, X. Y., Wang, Z., He, S. L., Shi, L. Y., Song, Y. L. et al. (2019). Endogenous hormone levels and activities of IAA-modifying enzymes during adventitious rooting of tree peony cuttings and grafted scions. Horticulture Environment and Biotechnology, 60(2), 187–197. DOI 10.1007/s13580-018-00121-5. [Google Scholar] [CrossRef]
29. Honaas, L., Kahn, E. (2017). A practical examination of RNA isolation methods for European pear (Pyrus communis). BMC Research Notes, 10(1), 237. DOI 10.1186/s13104-017-2564-2. [Google Scholar] [CrossRef]
30. Audic, S., Claverie, J. M. (1997). The significance of digital gene expression profiles. Genome Research, 7(10), 986–995. DOI 10.1101/gr.7.10.986. [Google Scholar] [CrossRef]
31. Leng, N., Dawson, J. A., Thomson, J. A., Ruotti, V., Rissman, A. I. et al. (2013). EBSeq: An empirical Bayes hierarchical model for inference in RNA-seq experiments. Bioinformatics, 29(8), 1035–1043. DOI 10.1093/bioinformatics/btt337. [Google Scholar] [CrossRef]
32. Clough, S. J., Bent, A. F. (1998). Floral dip: A simplified method for Agrobacterium-mediated transformation of Arabidopsis thaliana. Plant Journal, 16(6), 735–743. DOI 10.1046/j.1365-313x.1998.00343.x. [Google Scholar] [CrossRef]
33. Zhu, X. T., Li, X. Q., Ding, W. J., Jin, S. H., Wang, Y. (2018). Callus induction and plant regeneration from leaves of peony. Horticulture Environment and Biotechnology, 59(4), 575–582. DOI 10.1007/s13580-018-0065-4. [Google Scholar] [CrossRef]
34. Zhang, R. L., Wang, X. B., Shao, L. M., Li, D. Q., Xia, Y. P. et al. (2021). Tissue culture and genetic transformation system con-struction of Paeonia lactiflora and Paeonia suffruticosa. Plant Physiology Communications, 57(2), 235–247. DOI 10.13592/j.cnki.ppj.2020.0467. [Google Scholar] [CrossRef]
35. Bassa, C., Mila, I., Bouzayen, M., Audran, D. C. (2012). Phenotypes associated with down-regulation of Sl-IAA27 support functional diversity among Aux/IAA family members in tomato. Plant and Cell Physiology, 53(9), 1583–1595. DOI 10.1093/pcp/pcs101. [Google Scholar] [CrossRef]
36. Shahzad, Z., Eaglesfield, R., Carr, C., Amtmann, A. (2020). Cryptic variation in RNA-directed DNA-methylation controls lateral root development when auxin signalling is perturbed. Nature Communications, 11(1), 218. DOI 10.1038/s41467-019-13927-3. [Google Scholar] [CrossRef]
37. Ulmasov, T., Hagen, G., Guilfoyle, T. J. (1997). ARF1, a transcription factor that binds to auxin response elements. Science, 276(5320), 1865–1868. DOI 10.1126/science.276.5320.1865. [Google Scholar] [CrossRef]
38. Ulmasov, T., Hagen, G., Guilfoyle, T. J. (1999). Activation and repression of transcription by auxin-response factors. Proceedings of the National Academy of Sciences, 96(10), 5844–5849. DOI 10.1073/pnas.96.10.5844. [Google Scholar] [CrossRef]
39. Okushima, Y. (2005). Functional genomic analysis of the AUXIN RESPONSE FACTOR gene family members in Arabidopsis thaliana: Unique and overlapping functions of ARF7 and ARF19. Plant Cell, 17(2), 444–463. DOI 10.1105/tpc.104.028316. [Google Scholar] [CrossRef]
40. Kang, N. Y., Lee, H. W., Kim, J. (2013). The AP2/EREBP gene PUCHI co-acts with LBD16/ASL18 and LBD18/ASL20 downstream of ARF7 and ARF19 to regulate lateral root development in Arabidopsis. Plant and Cell Physiology, 54(8), 1326–1334. DOI 10.1093/pcp/pct081. [Google Scholar] [CrossRef]
41. Ive, D. S. (2010). Multimodular auxin response controls lateral root development in Arabidopsis. Plant Signaling and Behavior, 5(5), 580–582. DOI 10.4161/psb.11495. [Google Scholar] [CrossRef]
42. Okushima, Y., Fukaki, H., Onoda, M., Theologis, A., Tasaka, M. (2007). ARF7 and ARF19 regulate lateral root formation via direct activation of LBD/ASL genes in Arabidopsis. Plant Cell, 19(1), 118–130. DOI 10.1105/tpc.106.047761. [Google Scholar] [CrossRef]
43. Weijers, D., Enkova, E. B., Katja, E. J., Schlereth, A., Hamann, T. et al. (2005). Developmental specificity of auxin response by pairs of ARF and Aux/IAA transcriptional regulators. EMBO Journal, 24(10), 1874–1885. DOI 10.1038/sj.emboj.7600659. [Google Scholar] [CrossRef]
44. Lee, H. W., Cho, C., Pandey, S. K., Park, Y., Kim, M. J. et al. (2019). LBD16 and LBD18 acting downstream of ARF7 and ARF19 are involved in adventitious root formation in Arabidopsis. BMC Plant Biology, 19, 46. DOI 10.1186/s12870-019-1659-4. [Google Scholar] [CrossRef]
Appendix
Supplementary Table 1: Sequence information
Cite This Article
 Copyright © 2022 The Author(s). Published by Tech Science Press.
This work is licensed under a Creative Commons Attribution 4.0 International License , which permits unrestricted use, distribution, and reproduction in any medium, provided the original work is properly cited.
 Downloads
 Citation Tools