
 Submit a Paper
 Propose a Special lssue
 Open Access
ARTICLE
Comparative Transcriptome Analysis of Salt-Stress-Responsive Genes in Rice Roots
1 College of Agronomy, Henan Agricultural University, Zhengzhou, 450046, China
2 Henan Production Technology Promotion Center of Chinese Herbal Medicine, Zhenzhou, 450000, China
3 Xinyang Agriculture and Forestry University, Xinyang, 464000, China
* Corresponding Authors: Juan Liu. Email: ; Pengfei Dong. Email:
(This article belongs to the Special Issue: Integrating Agronomy and Plant Physiology for Improving Crop Production)
Phyton-International Journal of Experimental Botany 2023, 92(1), 237-250. https://doi.org/10.32604/phyton.2022.023081
Received 12 April 2022; Accepted 20 May 2022; Issue published 06 September 2022
 View Full Text
 Download PDF
Abstract
Soil salinity greatly impairs plant growth and crop productivity. Rice (Oryza sativa L.) is a salt-sensitive crop. To better understand the molecular mechanisms of salt tolerance in roots, the BGISEQ-500 sequencing platform was employed to elucidate transcriptome changes in rice roots after 0, 3, 24, and 72 h of salt stress. The results showed that root K+ content decreased and Na+ content increased rapidly after the initial stage of salt stress, but that fresh and dry weight in root did not significantly reduce. Compared to the control (no salt stress), 1,292, 453, and 486 differentially expressed genes (DEGs) were upregulated, respectively, and 939, 894, and 646 DEGs were downregulated, respectively, after 3, 24, and 72 h of salt treatment. The number of DEGs was higher during the early stage of salt stress (3 h) than in later stages (24 and 72 h). A number of DEGs involved in the response and adaptation to salt stress were related to protein kinase and calcium-binding, plant hormone signaling and metabolism, transcriptional regulation, metabolic pathways, antioxidant activity, and ion transport. Many of these DEGs were activated during the early stage of salt stress (3 h). The present study reports candidate salt-stressresponsive genes with the potential to genetically improve salt tolerance in rice elsewhere.Keywords
Supplementary Material
Supplementary Material FileClimate change and groundwater irrigation have increased the area of saline-alkali land worldwide. More than 800 million hectares of land worldwide, including 50% of all cultivated land, is suffering from salinity problems [1]. Salinity seriously threatens global crop production. It is crucial to solve the problem of soil salinization and improve crop tolerance to salinity, given the increasing worldwide population and incommensurate increase in arable area.
Rice (Oryza sativa L.) is one of the most important salt-sensitive cereal crops [2]. Salinity imposes osmotic and ionic stress on plants, as well as oxidative stress. It can also cause nutritional deficits [1]. Plants have evolved diverse strategies to reduce the damage caused by salinity stress: osmotic adjustment, Na+/K+ homeostasis, and tolerance to oxidative stress [3–6]. The salinity tolerance mechanisms in plants are very complex and involve many molecular processes [7]. Some studies have revealed that multiple signal transduction pathways are activated in response to salt stress [8–10].
RNA-sequencing (RNA-seq) analyses have been used to discover candidate genes for various types of abiotic stress tolerance in rice [11,12]. Several genes associated with salt tolerance have been identified in transcriptome studies [13–15]. Studies on rice have indicated that numerous transcription factors (TFs) are involved in the salt stress response, such as OsMYB91 [16], OsWRKY42 [17], OsNAC5 [18], and OsbZIP71 [19]. Some genes related to salt tolerance, such as OsHKT1;5 [20], OsSOS1 [21], OsHAK5 [22], OsSMP1 [23], OsZFP [24], and OsPRR73 [25] have been documented in rice. However, the molecular basis of salt stress tolerance in rice remains unknown. Additionally, comparative transcriptional changes in the response to salt stress between early and late periods have seldom been reported.
In this study, rice plants were subjected to 150 mM NaCl treatment for 0, 3, 24, and 72 h. The phenotypic and physiological responses to the salt stress were studied, and RNA-seq data were generated. Differentially expressed genes (DEGs) were detected by comparing the expression levels of genes between the salt treatments and control. The objectives of this study were to identify candidate salt-stress-responsive genes in rice, which could be used for genetic modification to improve salinity tolerance.
2.1 Plant Materials and Growth Conditions
Rice (O. sativa L. cv. Nipponbare) was used in the present study. After germination, the seedlings were cultured in Yoshida nutrient solution at 28°C/25°C (day/night) under a 14 h light/10 h dark photoperiod [26]. The nutrient solution was refreshed every 5 days. The 14-day-old seedlings were exposed to the nutrient solution with 150 mM NaCl for the salinity stress treatment. There were 36 seedlings in one treatment set. Shoots and roots were harvested 0, 3, 24, and 72 h after the salt treatment and used to determine plant biomass and ion contents. And 0 h after the salt treatment was set as the control (untreated plants).
2.2 Measurement of Plant Biomass and Relative Water Content
Ten uniform seedlings from each treatment were collected and cut into shoot and root parts. The fresh weight (FW) of the shoots and roots was determined with an electronic balance. Then, all shoot and root parts were de-enzymed for 15 min at 105°C and dried to constant weight at 70°C. The samples were allowed to reach room temperature and then weighed to determine the dry weight (DW).
2.3 Measurement of Root and Shoot Ion Contents
Ten shoots and roots were washed in deionized water, dried, and ground into fine powder. The samples were digested in 5 mL of 98% H2SO4 and 3 mL of 30% H2O2 as described by the previous report [27]. Na+ and K+ contents were measured by flame photometry (PFP7; Jenway, Stone, UK).
2.4 RNA-seq Library Construction and Sequencing
Roots were harvested 0, 3, 24, and 72 h after the 150 mM NaCl treatment. All fresh samples were frozen in liquid nitrogen and stored at −80°C; subsequently, RNA was extracted and the cDNA library constructed. Each group was represented by two independent biological replicates, and each sample contained roots from at least six seedlings. Total RNA was extracted with TRIzol reagent. The cDNA libraries were constructed and sequenced using the BGI-500 sequencing platform (BGI, Shenzhen, China), and 2 × 100 bp paired-end reads were generated.
2.5 Analysis of the Transcriptomic Data
The genes expression levels were quantified with RSEM software [28]. The NOISeq method was used to screen the DEGs [29]. Genes with P ≤ 0.001, an absolute |log2 ratio| ≥ 1, and a posterior probability of differential expression ≥0.80 were further evaluated.
A Gene Ontology (GO) enrichment analysis was performed using AgriGO (http://systemsbiology.cpolar.cn/agriGOv2/). [30]. P-value ≤ 0.05 was the threshold. This analysis identified the main biological functions of the DEGs. The Kyoto Encyclopedia of Genes and Genomes (KEGG) database was used to perform the pathway enrichment analysis of the DEGs, to shed further light on the biological functions of the genes [31].
2.6 Real-Time Quantitative Polymerase Chain Reaction (qRT-PCR) Analysis
After reverse transcription with the HiFi-MMLV cDNA Kit (Cwbiotech, Beijing, China), a 6 μL aliquot of 1:20 diluted cDNA was used as the template in a 20 μL PCR reaction. The qRT-PCR analysis was performed using the ultraSYBR Mixture (Cwbiotech) after pre-incubation at 95°C for 5 min, followed by 40 cycles of denaturation at 95°C for 15 s, annealing at 60°C for 15 s, and extension at 72°C for 32 s in an ABI PRISM® 7500 Sequence Detection System (Applied Biosystems, Foster City, CA, USA). For each sample, the mean value of three qRT-PCR technical replicates was used to calculate transcript abundance, and the mean biological replicate values were plotted against the standard error. The primer sequences of the β-actin gene and other genes used for qRT-PCR are listed in Supplementary Table S1.
3.1 Effect of Salt Treatment Time on Plant Biomass and Water Content
To evaluate the effect of salt stress on seedling growth, we examined root and shoot biomass after 0, 3, 24, and 72 h of the 150 mM NaCl treatment. As shown in Fig. 1A, shoot FW was significantly inhibited compared to the control. Shoot FW decreased by 8.33% and 22.74% after 3 and 24 h of salt stress, respectively (P < 0.05). Root FW decreased significantly after only 24 h of salt treatment. No significant inhibition of root DW was detected after 3, 24 or 72 h of salt treatment compared to the control (Fig. 1B). Shoot DW decreased significantly (90.4% of the control) only 3 h after salt treatment. A significant increase in shoot DW was evident after 24 and 72 h of salt treatment (Fig. 1B). As shown in Fig. 1C, the relative water content decreased significantly, by 1.45%, 3.85%, and 3.14% after 3, 24, and 72 h of salt stress, respectively, compared to the control.

Figure 1: The effect of salinity on fresh weight (A), dry weight (B) in rice roots and shoots, and relative water content (C) in rice plants after treatment with 150 mM NaCl for 0, 3, 24 and 72 h (n = 10). Vertical bars indicate standard error (SE); significant differences are denoted with different letters based on Duncan’s tests (P < 0.05). Note: the statistical analysis for corresponding root and shoot was independent
3.2 Effect of Salt Treatment Time on K+ and Na+ Contents
As shown in Fig. 2A, the K+ content of shoots and roots decreased significantly after 24 and 72 h of the 150 mM NaCl treatment (P < 0.05). Shoots maintained higher K+ content than roots. The Na+ contents of shoots and roots increased significantly after 24 and 72 h of the 150 mM NaCl treatment (Fig. 2B). The Na+ contents of roots after 3, 24, and 72 h of the 150 mM NaCl treatment were 2.04-, 4.14- and 5.16-fold higher than that of the control, respectively. The K+/Na+ ratio in roots and shoots decreased significantly after 3, 24, and 72 h of the 150 mM NaCl treatment (Fig. 2C).
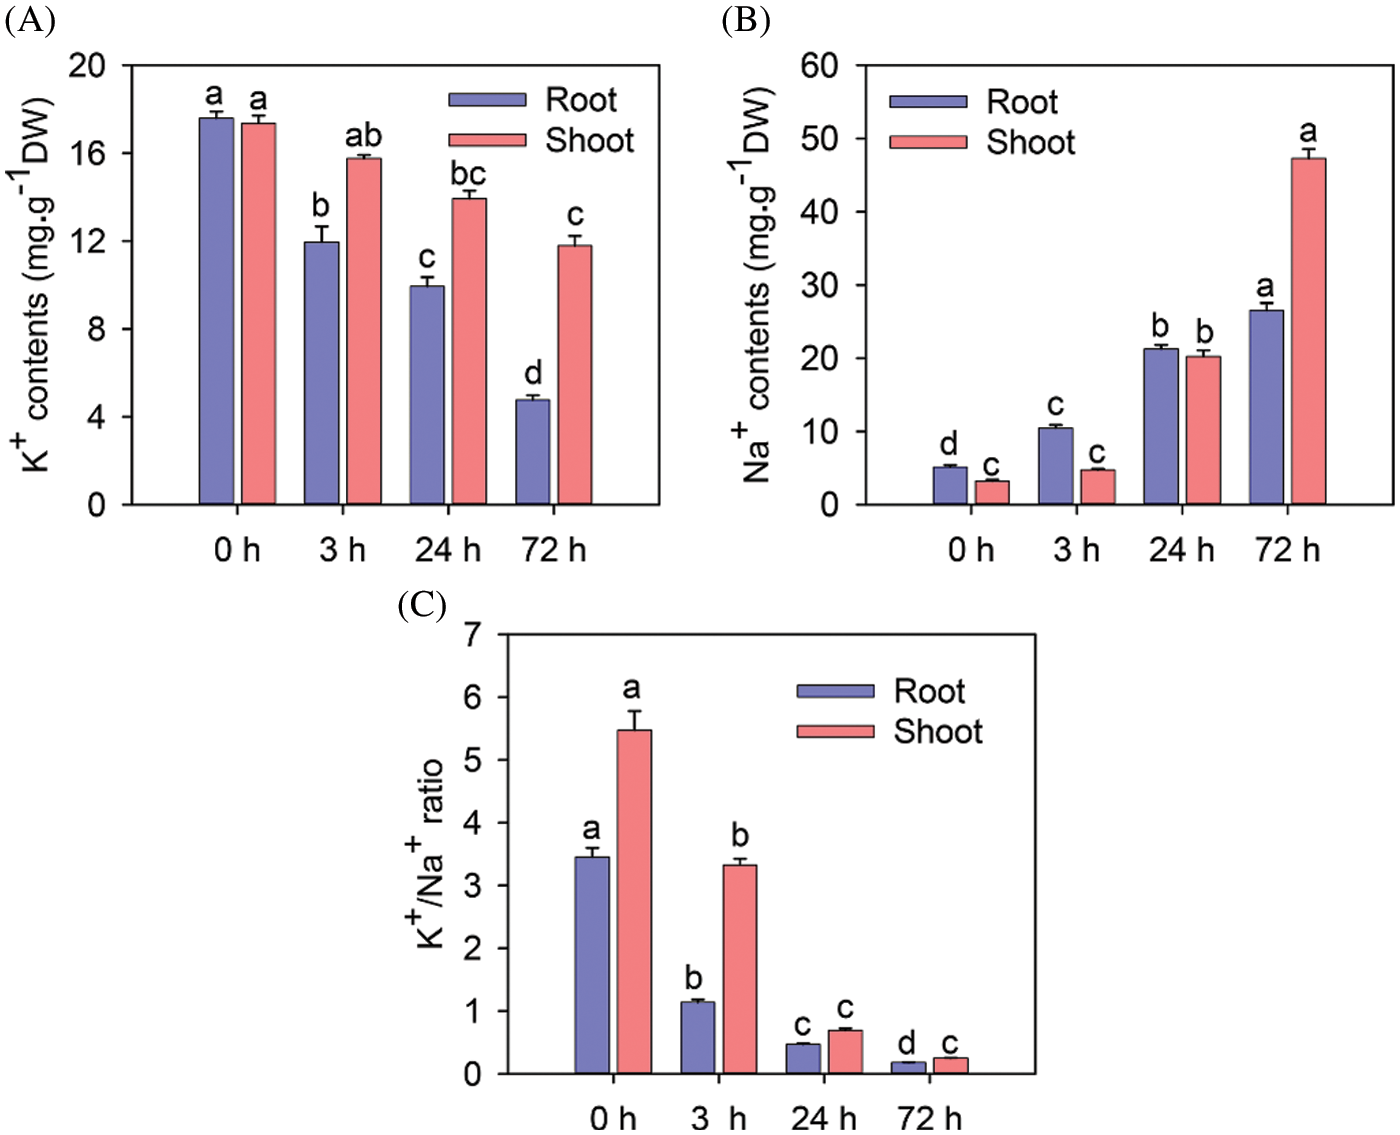
Figure 2: The effect of salinity on ions content and K+/Na+ ratio in rice roots and shoots after treatment with NaCl. K+ content (A), Na+ content (B), and K+/Na+ ratio (C) in rice roots and shoots after treatment with 150 mM NaCl for 0, 3, 24 and 72 h (n = 6). Vertical bars indicate standard error (SE); signifi-cant differences are denoted with different letters based on Duncan’s tests (P < 0.05). Note: The statistical analysis for corresponding root and shoot was independent
Sequencing libraries were prepared from rice roots 0, 3, 24, and 72 h after the 150 mM NaCl treatment to investigate the time-dependent response to salt stress. Two independent biological replicates for each treatment group were used in this analysis. In total, 24,072,269 clean reads were obtained from each sample after filtering the low-quality reads (Table 1). The average genome mapping ratio was 93.63%, and the mapping rates for each sample are listed in Table 1.

A total of 4,710 DEGs were identified, with an estimated absolute log2 (fold change) ≥ 1 and a posterior probability of differential expression ≥ 0.8. The distribution of DEGs among the different groups is shown in Fig. 3A and Supplemental Table S2. Compared to the control, 1,292, 453, and 486 DEGs were upregulated, respectively, and 939, 894, and 646 DEGs were downregulated, respectively, after 3, 24, and 72 h of salt treatment. More upregulated than downregulated DEGs were detected after the early stage of salt stress (3 h), and the number of downregulated DEGs increased in later stages of salt stress (24 and 72 h; Fig. 3A and Supplemental Table S2). In addition, there were 89 upregulated and 263 downregulated common DEGs in the 0 vs. 3, 0 vs. 24 h, and 0 vs. 72 h comparisons (Fig. 3B). To further explore the expression profiles of the DEGs, a heat map of transcription expression levels was generated for each treatment (Fig. 3C).

Figure 3: (A) Number of differentially expressed genes under 150 mM NaCl for 3, 24 and 72 h. (B) Venn diagrams showing the number of differentially expressed genes in different comparisons groups. (C) Union heatmap of differentially expressed genes for each comparisons group
Statistical analysis of the biological replicate transcriptome data revealed the correlation coefficients of 0.78–0.99 (Supplemental Table S3), indicating that the data were generally reliable. Then, qRT-PCR of 10 randomly chosen DEGs was performed to further validate the quality of the RNA-seq data. As shown in Supplemental Table S4, good concordance was observed, and the relative expression levels of these genes were highly consistent between the qRT-PCR and RNA-seq analyses.
3.4 Functional Annotation and GO Enrichment Analysis
To further elucidate the functions of the DEGs, GO enrichment analysis was conducted and a total of 1535,907,735 DEGs were annotated into three categories: biological processes (BP), molecular functions (MF), and cellular components (CC), respectively after 3, 24 and 72 h of salt treatment. (Supplemental Table S5). The significantly enriched BP and MF included GO terms, such as photosynthesis, generation of precursor metabolites and energy, response to oxidative stress, calcium ion binding, antioxidant activity, and intracellular membrane-bounded organelle at the early stage of salt stress (3 h) and the later stage of salt stress (24 and 72 h) (Supplemental Table S5), whereas, several common GO terms showed significant differences in enrichment between the early and later stage of salt stress (Fig. 4).

Figure 4: GO enrichment analysis among different comparison groups. Heatmap of some common regulated GO terms for biological process (A), molecular function (B), and cellular component (C). The horizontal axis shows –Log10 of the P-value
In addition to the GO analysis, KEGG analysis was used to identify potential biological pathways. The majority of the DEGs under the three salt stress stages mapped to “metabolic pathways” or “biosynthesis of secondary metabolites”. Of the 2,231 DEGs, 1,425 were assigned a KEGG ID and categorized into 25 pathways during the early stage of salt stress (3 h) (Supplemental Table S6). Of these, 10 pathways were significantly (P ≤ 0.01) overrepresented, and “plant hormone signal transduction (ko04075)” and “glutathione metabolism (ko00480)” were enriched. Under long-term salt stress (24 and 72 h), 899 and 742 genes were assigned a KEGG ID and categorized into 26 and 24 pathways, respectively (Supplemental Table S6). Of these, 12 pathways were significantly (P ≤ 0.01) overrepresented, and “metabolic pathways (ko01100)” and “biosynthesis of secondary metabolites (ko01110)” were enriched after 24 and 72 h of salt stress.
3.5 Transcription Analysis of the DEGs
The GO analysis showed that regulation of transcription was significantly enriched. Transcription factors (TFs) are believed to be primarily involved in the initiation of RNA transcription, and are important factors regulating gene expression. Many TFs in rice roots responded to the NaCl treatment (Fig. 5 and Supplemental Table S7). In this study, we identified 84, 30, and 31 TFs, respectively, in the 3, 24, and 72 h salt treatment groups (Fig. 5). The number of TFs under the 3 h salt treatment was higher than that under the 24 and 72 h salt treatments. Many TFs in the AP2/EREBP family, and to a lesser extent in the MYB, WRKY, bHLH, C2H2, LOB, and Tify families, were differentially regulated during salt stress (Fig. 5 and Supplemental Table S7).

Figure 5: Graphical representation of salt-responsive transcription factors based on their assigned protein families under 150 mM NaCl for 3, 24 and 72 h
3.6 Candidate DEGs Involved in the Salt Stress Response
DEGs were involved in protein kinase and calcium-binding, plant hormone signal transduction and metabolism, amino acid metabolism, carbohydrate metabolism, ion transport, and the response to oxidative stress. We identified some significant DEGs as candidate salt-responsive genes.
Many DEGs involved in salt-related signaling pathways were identified. A total of 18 genes were identified, encoding receptor-like protein kinases and calcium-related protein kinases. Most were significantly upregulated after 3 h of salt treatment but were not significantly changed after 24 and 72 h of salt treatment (Fig. 6 and Supplemental Table S8). Os08g0374600, Os04g0476600, and Os09g0418000 were significantly induced after 3 h of salt treatment, but there were no significant changes in the expression levels after 24 and 72 h of salt treatment.

Figure 6: Analyses of the differentially expressed genes involved in the regulation of protein kinase and calcium binding (A), plant hormone signal transduction and metabolism (B), response to oxida-tive stress (C), ions channels and transporters (D) under 150 mM NaCl for 3, 24 and 72 h
After the salt treatment, we identified many DEGs involved in plant hormone signal transduction and metabolism, including genes related to abscisic acid (ABA), ethylene, indole-3-acetic acid, jasmonic acid (JA), gibberellins (GA) and cytokinin (Fig. 6 and Supplemental Table S8). OsNCED4 (Os07g0154100), a key gene regulating ABA biosynthesis, was significantly upregulated after 3 h of salt treatment, but its expression level showed no significant change after 24 and 72 h of salt treatment. Two ABA-activated protein kinase genes (Os03g0610900 and Os12g0586100), and ABA-induced plasma membrane protein gene (Os05g0381400) and ABA-regulated TFs (Os08g0472000-OsbZIP66 and Os02g0766700-OsbZIP23) were significantly induced after 3 h of salt treatment. Interestingly, Os09g0451400 (ethylene biosynthesis), Os02g0218700 and Os03g0767000 (JA biosynthesis), Os01g0757200 (GA metabolism), and Os01g0940000 (cytokinin oxidase/dehydrogenase) were significantly induced after 3 h of salt treatment, but there were no significant changes in the expression levels after 24 and 72 h of salt treatment.
Numerous DEGs involved in oxidation-reduction and the response to oxidative stress during salt stress were detected. Some antioxidant enzyme genes involved in reactive oxygen species (ROS) scavenging were highly activated after 3 h of salt treatment, but not after the long-term salt treatment. Eight members of the POX family, and eight cytochrome p450 genes, were significantly upregulated after 3 h of salt treatment (Fig. 6 and Supplemental Table S8).
Many transcripts were identified that encode a range of ion channels and transporters, including cation/H+ exchangers, potassium channels and transporters, and metal ion, nitrate, ammonium, phosphate (Pi), and sulfate transporters (Fig. 6 and Supplemental Table S8). Some DEGs associated with solute transporters were also identified, and were either up or downregulated after salt stress. These transporters included sugar, amino acid, and peptide transporters (Supplemental Table S8).
Salinity is one of the main factors inhibiting crop growth and production. In the present study, we evaluated the effects of different periods of salt stress on rice seedlings. The root FW and DW did not decrease significantly after the initial stage of salt stress. In roots, K+ content decreased rapidly, whereas Na+ content increased rapidly (Figs. 2A and 2B). Accordingly, the molecular mechanisms underlying the initial response to salt stress and salt tolerance in seedling roots were explored.
Next, we employed RNA-seq to obtain 24,072,269 clean reads with an average genome mapping ratio of 93.63% (Table 1). We compared the number of DEGs between the 3, 24, and 72 h salt treatments and a control treatment. The number of upregulated DEGs reached a maximum at 3 h, and was lower at 24 and 72 h (Fig. 3 and Supplemental Table S2). The number of downregulated DEGs was relatively consistent among the three periods of salt stress. As summarized in Fig. 4 and Supplemental Table S5, four main stages were distinguished: initiation of the sensory system, transcriptional reprogramming, change in the antioxidant system, and regulation of ion homeostasis.
Stress signaling pathways play an important role in salt tolerance [32,33]. Studies have revealed several signal transduction pathways involved in the salt stress response, including the salt overly sensitive pathway [34], the ABA signaling pathway [35], the ethylene signaling pathway [36], the calcium signaling pathway [37], and the receptor-like kinase pathway [38]. Our study suggests that plant hormone signal transduction (ko04075) was specifically enriched during the early stage of salt stress (3 h) (Supplementary Table S5). The ABA signaling and metabolic pathways are involved in the salt stress response and tolerance. The ABA biosynthetic gene OsNCED4 (Os07g0154100), and the ABA-regulated TFs (Os08g0472000-OsbZIP66 and Os02g0766700-OsbZIP23), were significantly upregulated. Additionally, several signaling proteins, such as LRR receptor-like serine/threonine-protein kinase, were upregulated under salt stress. Two ABA-activated protein kinase genes (Os03g0610900 and Os12g0586100) and the ABA-induced plasma membrane protein gene (Os05g0381400) were significantly induced. Results showed that the initial stage of salt stress significantly decrease the shoot FW and DW, rather than root FW and DW (Figs. 1A and 1B). Taken together, these DEGs related to ABA can play an important role in plant hormone signal transduction for growth and development, and involve in the salt stress response.
The expression of several TFs has been reported in plants under salt stress. Cai et al. [39] showed that ZmWRKY17 may act as a negative regulator of the salt stress response through ABA signaling. The MYB TF AtDIV2 negatively regulates salt stress and is required for ABA signaling in Arabidopsis [40]. In the present study, the gene encoding OsMYBc (Os09g0299200) was significantly upregulated after the 72-h salt treatment (Fig. 5 and Supplemental Table S7). OsMYBc interacts with the AAANATNC (C/T promoter motif) of OsHKT1;1 to regulate OsHKT1;1 expression, and then affects salt tolerance in rice [41].
Maintaining ion homeostasis is crucial for plant survival under salt stress [7]. Cation transporters are involved in the regulation of ion homeostasis [42,43]. Vacuolar Na+/H+ antiporter genes have been identified in many plants and mediate Na+ accumulation in vacuoles during salt stress [44–46]. This study found that the Os06g0318500 gene, which is similar to the Na+/H+ exchanger gene, was significantly induced at the early stage of salt stress (3 h) (Fig. 6 and Supplemental Table S8). Wei et al. [25] identified OsHKT2;1, encoding a plasma membrane-localized Na+ transporter that mediates salt tolerance by regulating Na+ homeostasis and ROS levels. RNA-seq also showed that OsHKT2;1 (Os06g0701700) was significantly upregulated in the early stage of salt stress (3 h). Studies have revealed that K+ uptake and efflux in plant roots under salt stress are mediated by multiple K+-related channels and transporters, such as the inward-rectifying K+ channel OsAKT1 [47], the high-affinity K+ transporter OsHAK1 [48], and depolarization-activated outward rectifying K+ channels (GORK) [49] and nonselective cation channels [50]. In the present study, OsAKT1 (Os01g0648000) was significantly downregulated after short- and long-term salt stress (Fig. 6 and Supplemental Table S8). However, Os01g0175100, encoding the voltage-gated K+ channel family protein, was significantly induced in the early stage of salt stress. As K+-permeable channels are also activated by an over-accumulation of ROS induced by salt stress [6,51], improving ROS scavenging activity enables K+ retention [52]. Our results showed that many antioxidant enzyme genes involved in ROS scavenging were highly activated, particularly after 3 h of salt treatment (Fig. 6 and Supplemental Table S8). Os12g0150200 (CYP94C2b) and Os11g0112400 were significantly upregulated after 3 h of salt treatment. We also observed that Os05g0382200, encoding the cation/proton exchanger (CAX), was significantly upregulated after long-term salt stress (24 and 72 h). CAX has been identified in some plants, such as Arabidopsis [53] and mung bean [54], where it regulates ion homeostasis to improve salt tolerance [55]. These ion transporter genes and antioxidant enzyme genes may contribute to Na+ and K+ homeostasis under salt stress.
Using the BGISEQ-500 sequencing platform, this study has provided an overview of the transcriptional changes occurring in rice roots during various stages of salt stress. In total, 2,231, 1,347, and 1,132 DEGs were identified compared to the control, respectively, after 3, 24, and 72 h of salt treatment. The number of DEGs was higher in the early stage of salt stress (3 h) than in the later stages (24 and 72 h). There were 89 common upregulated, and 263 common downregulated DEGs at the three time points. These DEGs were mainly related to protein kinases and calcium-binding, plant hormone signaling and metabolism, transcriptional regulation, metabolic pathways, antioxidant activities, and ion transport. Our results revealed that some potential salt-stress-responsive genes mediated the salt tolerance of rice roots at the three treatment time points, particularly during the early stage of salt treatment. The present study reports candidate salt-stress-responsive genes with the potential to genetically improve adaptation to salinity stress in rice. Further study of the regulatory mechanisms is needed.
Authorship: Study conception and design: X. Ji, J. Liu; data collection: Y. Huang, Y. Wei, S. Li; analysis and interpretation of results: R. Song, Q. Liu; draft manuscript preparation: J. Liu, P. Dong. All authors reviewed the results and approved the final version of the manuscript.
Acknowledgement: We would like to thank Textcheck (http://www.textcheck.com/text/page/index) for English language editing. We appreciate Prof. Hasanuzzaman for suggestions on revising the manuscript.
Funding Statement: This work was funded by the National Natural Science Foundation of China (Grant No. 32101678), Henan Key Scientific Research Project (Grant Nos. 22A210009, 22B210010), Xinyang Agriculture and Forestry University Youth Fund Project (Grant No. QN2021021) and Xinyang Agriculture and Forestry University High-Level Research Incubator Construction Project (Grant No. FCL202011).
Conflicts of Interest: The authors declare that they have no conflicts of interest to report regarding the present study.
References
1. Munns, R., Tester, M. (2008). Mechanisms of salinity tolerance. Annual Review of Plant Biology, 59(1), 651–681. DOI 10.1146/annurev.arplant.59.032607.092911. [Google Scholar] [CrossRef]
2. Hoang, T. M. L., Tran, T. N., Nguyen, T. K. T., Williams, B., Wurm, P. et al. (2016). Improvement of salinity stress tolerance in rice, challenges and opportunities. Agronomy, 6(4), 54. DOI 10.3390/agronomy6040054. [Google Scholar] [CrossRef]
3. Ashraf, M., Athar, H. R., Harris, P. J. C., Kwon, T. R. (2008). Some prospective strategies for improving crop salt tolerance. Advances in Agronomy, 97, 45–110. DOI 10.1016/S0065-2113(07)00002-8. [Google Scholar] [CrossRef]
4. Adem, G. D., Roy, S. J., Zhou, M., Bowman, J. P., Shabala, S. (2014). Evaluating contribution of ionic, osmotic and oxidative stress components towards salinity tolerance in barley. BMC Plant Biology, 14, 113. DOI 10.1186/1471-2229-14-113. [Google Scholar] [CrossRef]
5. Bose, J., Shabala, L., Pottosin, I., Zeng, F., Velarde-Buendía, A. M. et al. (2014). Kinetics of xylem loading, membrane potential maintenance, and sensitivity of K+-permeable channels to reactive oxygen species, physiological traits that differentiate salinity tolerance between pea and barley. Plant Cell & Environment, 37(3), 589–600. DOI 10.1111/pce.12180. [Google Scholar] [CrossRef]
6. Chakraborty, K., Bose, J., Shabala, L., Shabala, S. (2016). Difference in root K+ retention ability and reduced sensitivity of K+-permeable channels to reactive oxygen species confer differential salt tolerance in three brassica species. Journal of Experimental Botany, 67(15), 4611–4625. DOI 10.1093/jxb/erw236. [Google Scholar] [CrossRef]
7. Liu, J., Shabala, S., Shabala, L., Zhou, M. X., Meinke, H. et al. (2019). Tissue-specific regulation of Na+ and K+ transporters explains genotypic differences in salinity stress tolerance in rice. Frontier in Plant Science, 10, 1361. DOI 10.3389/fpls.2019.01361. [Google Scholar] [CrossRef]
8. Manishankar, P., Wang, N., Köster, P., Alatar, A. A., Kudla, J. (2018). Calcium signaling during salt stress and in the regulation of ion homeostasis. Journal of Experimental Botany, 69(17), 4215–4226. DOI 10.1093/jxb/ery201. [Google Scholar] [CrossRef]
9. Mirdar Mansuri, R., Shobbar, Z. S., Babaeian Jelodar, N., Ghaffari, M. R., Nematzadeh, G. A. et al. (2019). Dissecting molecular mechanisms underlying salt tolerance in rice, a comparative transcriptional profiling of the contrasting genotypes. Rice, 12, 13. DOI 10.1186/s12284-019-0273-2. [Google Scholar] [CrossRef]
10. Yang, Y., Guo, Y. (2018). Elucidating the molecular mechanisms mediating plant salt-stress responses. New Phytologist, 217(2), 523–539. DOI 10.1111/nph.14920. [Google Scholar] [CrossRef]
11. Mizuno, H., Kawahara, Y., Sakai, H., Kanamori, H., Wakimoto, H. et al. (2010). Massive parallel sequencing of mRNA in identification of unannotated salinity stress-inducible transcripts in rice (Oryza sativa L.). BMC Genomics, 11, 683. DOI 10.1186/1471-2164-11-683. [Google Scholar] [CrossRef]
12. Oono, Y., Kawahara, Y., Kanamori, H., Mizuno, H., Yamagata, H. et al. (2011). mRNA-seq reveals a comprehensive transcriptome profile of rice under phosphate stress. Rice, 4, 50–65. DOI 10.1007/s12284-011-9064-0. [Google Scholar] [CrossRef]
13. Chao, D. Y., Luo, Y. H., Shi, M., Luo, D., Lin, H. X. (2005). Salt-responsive genes in rice revealed by cDNA microarray analysis. Cell Research, 15, 796–810. DOI 10.1038/sj.cr.7290349. [Google Scholar] [CrossRef]
14. Cotsaftis, O., Plett, D., Johnson, A. A., Walia, H., Wilson, C. et al. (2011). Root-specific transcript profiling of contrasting rice genotypes in response to salinity stress. Molecular Plant, 4(1), 25–41. DOI 10.1093/mp/ssq056. [Google Scholar] [CrossRef]
15. Kawasaki, S., Borchert, C., Deyholos, M., Wang, H., Brazille, S. et al. (2001). Gene expression profiles during the initial phase of salt stress in rice. The Plant Cell, 13(4), 889–905. DOI 10.1105/tpc.13.4.889. [Google Scholar] [CrossRef]
16. Zhu, N., Cheng, S., Liu, X., Du, H., Dai, M. et al. (2015). The R2R3-type MYB gene OsMYB91 has a function in coordinating plant growth and salt stress tolerance in rice. Plant Science, 236, 146–156. DOI 10.1016/j.plantsci.2015.03.023. [Google Scholar] [CrossRef]
17. Han, M., Kim, C. Y., Lee, J., Lee, S. K., Jeon, J. S. (2014). OsWRKY42 represses OsMT1d and induces reactive oxygen species and leaf senescence in rice. Molecules and Cells, 37(7), 532–539. DOI 10.14348/molcells.2014.0128. [Google Scholar] [CrossRef]
18. Song, S. Y., Chen, Y., Chen, J., Dai, X. Y., Zhang, W. H. (2011). Physiological mechanisms underlying OsNAC5-dependent tolerance of rice plants to abiotic stress. Planta, 234(2), 331–345. DOI 10.1007/s00425-011-1403-2. [Google Scholar] [CrossRef]
19. Liu, C., Mao, B., Ou, S., Wang, W., Liu, L. et al. (2014). OsbZIP71, a bZIP transcription factor, confers salinity and drought tolerance in rice. Plant Molecular Biology, 84, 19–36. DOI 10.1007/s11103-013-0115-3. [Google Scholar] [CrossRef]
20. Kobayashi, N. I., Yamaji, N., Yamamoto, H., Okubo, K., Uenov, H. et al. (2017). OsHKT1;5 mediates Na+ exclusion in the vasculature to protect leaf blades and reproductive tissues from salt toxicity in rice. Plant Journal, 91(4), 657–670. DOI 10.1111/tpj.13595. [Google Scholar] [CrossRef]
21. EI Mahi, H., Perez-Hormaeche, J., de Luca, A., Villalta, I., Espartero, J. et al. (2019). A critical role of sodium flux via the plasma membrane Na+/H+ exchanger SOS1 in the salt tolerance of rice. Plant Physiology, 180(2), 1046–1065. DOI 10.1104/pp.19.00324. [Google Scholar] [CrossRef]
22. Yang, T., Zhang, S., Hu, Y., Wu, F., Hu, Q. et al. (2014). The role of a potassium transporter OsHAK5 in potassium acquisition and transport from roots to shoots in rice at low potassium supply levels. Plant Physiology, 166(2), 945–959. DOI 10.1104/pp.114.246520. [Google Scholar] [CrossRef]
23. Zheng, S. W., Liu, S. B., Feng, J. H., Wang, W., Wang, Y. W. et al. (2021). Overexpression of a stress response membrane protein gene OsSMP1 enhances rice tolerance to salt, cold and heavy metal stress. Environmental and Experimental Botany, 182, 104327. DOI 10.1016/j.envexpbot.2020.104327. [Google Scholar] [CrossRef]
24. Wang, Y. W., Liao, Y. R., Quan, C. Q., Li, Y. Q., Yang, S. J. et al. (2022). C2H2-type zinc finger OsZFP15 accelerates seed germination and confers salinity and drought tolerance of rice seedling through ABA catabolism. Environmental and Experimental Botany, 199, 104873. DOI 10.1016/j.envexpbot.2022.104873. [Google Scholar] [CrossRef]
25. Wei, H., Wang, X., He, Y., Xu, H., Wang, L. (2021). Clock component OsPRR73 positively regulates rice salt tolerance by modulating OsHKT2;1-mediated sodium homeostasis. EMBO Journal, 40(3), e105086. DOI 10.15252/embj.2020105086. [Google Scholar] [CrossRef]
26. Yoshida, S., Forno, D. A., Cook, J. H., Gomez, K. A. (1976). Routine procedure for growing rice plants in culture solution. In laboratory manual for physiological studies of rice, pp. 61–66. IRRI, Los Banos: The Philippines. [Google Scholar]
27. Skoog, D. A., West, D. M., Holler, F. J., Crouch, S. R. (2000). Analytical chemistry: An introduction. 7th ed. Philadelphia, PA, USA: College Publishing. [Google Scholar]
28. Li, B., Dewey, C. N. (2011). RSEM, accurate transcript quantification from RNA-seq data with or without a reference genome. BMC Bioinformatics, 12, 323. DOI 10.1186/1471-2105-12-323. [Google Scholar] [CrossRef]
29. Tarazona, S., García-Alcalde, F., Dopazo, J., Ferrer, A., Conesa, A. (2011). Differential expression in RNA-seq, a matter of depth. Genome Research, 21(12), 2213–2223. DOI 10.1101/gr.124321.111. [Google Scholar] [CrossRef]
30. Du, Z., Zhou, X., Ling, Y., Zhang, Z., Su, Z. (2010). agriGO, a GO analysis toolkit for the agricultural community. Nucleic Acids Research, 38, W64–W70. DOI 10.1093/nar/gkq310. [Google Scholar] [CrossRef]
31. Kanehisa, M., Araki, M., Goto, S., Hattori, M., Hirakawa, M. et al. (2007). KEGG for linking genomes to life and the environment. Nucleic Acids Research, 36, D480–D484. [Google Scholar]
32. Golldack, D., Li, C., Mohan, H., Probst, N. (2014). Tolerance to drought and salt stress in plants: Unraveling the signaling networks. Frontier in Plant Science, 5, 151. [Google Scholar]
33. Zhu, J. K. (2002). Salt and drought stress signal transduction in plants. Annual Review of Plant Biology, 53, 247–273. [Google Scholar]
34. Martínez-Atienza, J., Jiang, X., Garciadeblas, B., Mendoza, I., Zhu, J. K. et al. (2007). Conservation of the salt overly sensitive pathway in rice. Plant Physiology, 143(2), 1001–1012. [Google Scholar]
35. Raghavendra, A. S., Gonugunta, V. K., Christmann, A., Grill, E. (2010). ABA perception and signalling. Trends in Plant Science, 15(7), 395–401. [Google Scholar]
36. Cao, Y. R., Chen, S. Y., Zhang, J. S. (2008). Ethylene signaling regulates salt stress response: An overview. Plant Signaling & Behavvior, 3(10), 761–763. [Google Scholar]
37. Knight, H., Trewavas, A. J., Knight, M. R. (1997). Calcium signalling in Arabidopsis thaliana responding to drought and salinity. Plant Journal, 12(5), 1067–1078. [Google Scholar]
38. Ouyang, S. Q., Liu, Y. F., Liu, P., Lei, G., He, S. J. et al. (2010). Receptor-like kinase OsSIK1 improves drought and salt stress tolerance in rice (Oryza sativa) plants. Plant Journal, 62(2), 316–329. [Google Scholar]
39. Cai, R., Dai, W., Zhang, C., Wang, Y., Wu, M. et al. (2017). The maize WRKY transcription factor ZmWRKY17 negatively regulates salt stress tolerance in transgenic Arabidopsis plants. Planta, 246, 1215–1231. [Google Scholar]
40. Fang, Q., Wang, Q., Mao, H., Xu, J., Wang, Y. et al. (2018). AtDIV2, an R-R-type MYB transcription factor of arabidopsis, negatively regulates salt stress by modulating ABA signaling. Plant Cell Reports, 37(11), 1499–1511. [Google Scholar]
41. Wang, R., Jing, W., Xiao, L., Jin, Y., Shen, L. et al. (2015). The rice high-affinity potassium transporter1;1 is involved in salt tolerance and regulated by an MYB-type transcription factor. Plant Physiology, 168(3), 1076–1090. DOI 10.1104/pp.15.00298. [Google Scholar] [CrossRef]
42. Deinlein, U., Stephan, A. B., Horie, T., Luo, W., Schroeder, J. I. (2014). Plant salt-tolerance mechanisms. Trends in Plant Science, 19(6), 371–379. DOI 10.1016/j.tplants.2014.02.001. [Google Scholar] [CrossRef]
43. Shabala, S., Mackay, A. (2011). Ion transport in halophytes. Advances in Botanical Research, 57, 151–199. DOI 10.1016/B978-0-12-387692-8.00005-9. [Google Scholar] [CrossRef]
44. Apse, M. P., Aharon, G. S., Snedden, W. A., Blumwald, E. (1999). Salt tolerance conferred by overexpression of a vacuolar Na+/H+ antiport in Arabidopsis. Science, 285(5431), 1256–1258. DOI 10.1126/science.285.5431.1256. [Google Scholar] [CrossRef]
45. Fukuda, A., Nakamura, A., Tagiri, A., Tanaka, H., Miyao, A. et al. (2004). Function, intracellular localization and the importance in salt tolerance of a vacuolar Na+/H+ antiporter from rice. Plant and Cell Physiology, 45(2), 146–159. DOI 10.1093/pcp/pch014. [Google Scholar] [CrossRef]
46. Fukuda, A., Nakamura, A., Hara, N., Toki, S., Tanaka, Y. (2011). Molecular and functional analyses of rice NHX-type Na+/H+ antiporter genes. Planta, 233(1), 175–188. DOI 10.1007/s00425-010-1289-4. [Google Scholar] [CrossRef]
47. Li, J., Long, Y., Qi, G. N., Li, J., Xu, Z. J. et al. (2014). The Os-AKT1 channel is critical for K+ uptake in rice roots and is modulated by the rice CBL1-CIPK23 complex. The Plant Cell, 26(8), 3387–3402. DOI 10.1105/tpc.114.123455. [Google Scholar] [CrossRef]
48. Chen, G., Hu, Q. D., Luo, L., Yang, T. Y., Zhang, S. et al. (2015). Rice potassium transporter OsHAK1 is essential for maintaining potassium-mediated growth and functions in salt tolerance over low and high potassium concentration ranges. Plant Cell & Environment, 38(12), 2747–2765. DOI 10.1111/pce.12585. [Google Scholar] [CrossRef]
49. Shabala, S., Bose, J., Fuglsang, A. T., Pottosin, I. (2016). On a quest for stress tolerance genes, membrane transporters in sensing and adapting to hostile soils. Journal of Experimental Botany, 67(4), 1015–1031. DOI 10.1093/jxb/erv465. [Google Scholar] [CrossRef]
50. Demidchik, V., Straltsova, D., Medvedev, S. S., Pozhvanov, G. A., Yurin, V. (2014). Stress-induced electrolyte leakage, the role of K+-permeable channels and involvement in programmed cell death and metabolic adjustment. Journal of Experimental Botany, 65(5), 1259–1270. DOI 10.1093/jxb/eru004. [Google Scholar] [CrossRef]
51. Miller, G., Suzuki, N., Cifci-Yilmaz, S., Mittler, R. (2010). Reactive oxygen species homeostasis and signalling during drought and salinity stresses. Plant Cell & Environment, 33(4), 453–467. DOI 10.1111/j.1365-3040.2009.02041.x. [Google Scholar] [CrossRef]
52. Liu, J., Shabala, S., Zhang, J., Ma, G., Chen, D. et al. (2020). Melatonin improves rice salinity stress tolerance by NADPH oxidase-dependent control of the plasma membrane K+ transporters and K+ homeostasis. Plant Cell & Environment, 43(11), 2591–2605. DOI 10.1111/pce.13759. [Google Scholar] [CrossRef]
53. Hirschi, K. D., Zhen, R. G., Cunningham, K. W., Rea, P. A., Fink, G. R. (1996). CAX1, an H+/Ca2+ antiporter from Arabidopsis. PNAS, 93(16), 8782–8786. DOI 10.1073/pnas.93.16.8782. [Google Scholar] [CrossRef]
54. Ueoka-Nakanishi, H., Maeshima, M. (2000). Quantification of Ca2+/H+ antiporter VCAX1p in vacuolar membranes and its absence in roots of mung bean. Plant and Cell Physiology, 41(9), 1067–1071. DOI 10.1093/pcp/pcd023. [Google Scholar] [CrossRef]
55. Luo, G. Z., Wang, H. W., Huang, J., Tian, A. G., Wang, Y. J. et al. (2005). A putative plasma membrane cation/proton antiporter from soybean confers salt tolerance in Arabidopsis. Plant Molecular Biology, 59(5), 809–820. DOI 10.1007/s11103-005-1386-0. [Google Scholar] [CrossRef]
Appendix
Supplemental Table S1: List of specific primers used for qRT-PCR analysis
Supplemental Table S2: Differentially expressed genes detected in rice roots under 150 mM NaCl for 3, 24 and 72 h
Supplemental Table S3: The correlation coefficient values acrossing samples
Supplemental Table S4: Quantitative RT-PCR (qRT-PCR) verification of DEGs from RNA-seq data. Ten random genes were selected from different salt treatment
Supplemental Table S5: GO enrichment analysis of differentially expressed genes in the different comparison groups with 150 mM NaCl for 3, 24 and 72 h
Supplemental Table S6: KEGG pathway enrichment analysis of salt-responsive DEGs in the different comparison groups
Supplemental Table S7: List of salt-responsive TFs in the different comparison groups
Supplemental Table S8: Selected salt-responsive DEGs associated with protein kinase and calcium binding, plant hormone signal transduction and metabolism, response to oxidative stress, ions channels and transporters under 150 mM NaCl for 3, 24 and 72 h
Cite This Article
 Copyright © 2023 The Author(s). Published by Tech Science Press.
This work is licensed under a Creative Commons Attribution 4.0 International License , which permits unrestricted use, distribution, and reproduction in any medium, provided the original work is properly cited.
 Downloads
 Citation Tools