
 Submit a Paper
 Propose a Special lssue
 Open Access
ARTICLE

Improving Quantitative and Qualitative Characteristics of Wheat (Triticum aestivum L.) through Nitrogen Application under Semiarid Conditions
1 Agronomic Research Institute, Ayub Agricultural Research Institute, Faisalabad, 38850, Pakistan
2Depertment of Agronomy, University of Agriculture, Faisalabad, 38040, Pakistan
3 Department of Agronomy, Northwest A&F University, Yangling, 712100, China
4 Department of Plant Sciences, Quaid-i-Azam University, Islamabad, 45320, Pakistan
5 Fodder Research Institute Sargodha, Sargodha, 40100, Pakistan
6 Department of Agricultural Engineering, Barani Agricultural Research Institute, Chakwal, 48800, Pakistan
7 Department of Zoology, College of Science, King Saud University, Riyadh, 11451, Saudi Arabia
8 Department of Biotechnology, Yeungnam University, Gyeongbuk, 38641, Korea
9 Plant Production Department, Faculty of Agriculture Saba Basha, Alexandria University, Alexandria, 21531, Egypt
10 Department of Forestry, Range and Wildlife Management, The Islamia University of Bahawalpur, Bahawalpur, 63100, Pakistan
* Corresponding Authors: Muhammad Saqib. Email: ; Sadam Hussain. Email:
Phyton-International Journal of Experimental Botany 2023, 92(4), 1001-1017. https://doi.org/10.32604/phyton.2023.025781
Received 30 July 2022; Accepted 12 September 2022; Issue published 06 January 2023
 View Full Text
 Download PDF
Abstract
Nitrogen (N), the building block of plant proteins and enzymes, is an essential macronutrient for plant functions. A field experiment was conducted to investigate the impact of different N application rates (28, 57, 85, 114, 142, 171, and 200 kg ha−1) on the performance of spring wheat (cv. Ujala-2016) during the 2017–2018 and 2018–2019 growing seasons. A control without N application was kept for comparison. Two years mean data showed optimum seed yield (5,461.3 kg ha−1) for N-application at 142 kg ha−1 whereas application of lower and higher rates of N did not result in significant and economically higher seed yield. A higher seed yield was obtained in the 2017–2018 (5,595 kg ha−1) than in the 2018–2019 (5,328 kg ha−1) growing seasons under an N application of 142 kg ha−1. It was attributed to the greater number of growing degree days in the first (1,942.35°C days) than in the second year (1,813.75°C). Higher rates of N (171 and 200 kg ha−1) than 142 kg ha−1 produced more number of tillers (i.e., 948,300 and 666,650 ha−1, respectively). However, this increase did not contribute in achieving higher yields. Application of 142, 171, and 200 kg ha−1 resulted in 14.15%, 15.0% and 15.35% grain protein concentrations in comparison to 13.15% with the application of 114 kg ha−1. It is concluded that the application of N at 142 kg ha−1 could be beneficial for attaining higher grain yields and protein concentrations of wheat cultivar Ujala-2016.
Keywords
Nitrogen is an essential nutrient that is used by plants for improving growth, yield, and quality [1,2]. Plants can absorb and use it in the form of ammonium (NH4+) or nitrate (NO3) [3]. It is well established that glycine, glutamine, deoxyribonucleic acid (DNA), ribonucleic acid (RNA), nucleotide, amine, amide, chlorophyll molecule, several enzymes, and coenzymes contain N [4–6]. Among essential plant nutrients, N is recommended to be applied in the maximum amount throughout the world because of its high losses through volatilization, immobilization, de-nitrification, and leaching into the soil; thus, its efficiency remains less than 70% to the applied amount [7]. Wheat crop is sensitive to N deficiency, however, on the other hand, excess of N promotes lush and prolonged vegetative growth which may accentuate lodging, frost injury, and disease incidence [8]. For wheat, N requirement is highest from the jointing to heading stage and it declines thereafter as the crop approaches maturity [9–11]. Poor wheat yield is attributed to many factors such as improper plant population [12,13], inadequate water supply [14,15], application of old production methods [16], and injudicious application of nutrients [17]. Wheat yields are to be increased many folds in order to feed the ever-increasing human population [18]. The pivotal role of N in plant metabolic processes including photosynthesis and respiration and its impact on wheat yield contributing parameters such as plant height, number of tillers, spikelets per spike, number of seeds per spike, spike length and seed weight has been reported in previous studies [19–21]. A number of scientists have also worked on the impact of N on wheat. For example, Hameed et al. [22] studied different N rates in wheat and recorded seed yield (8,584 kg ha−1) and the number of spikes (750 m−2) for N application at 140 kg ha−1. Similarly, Amjed et al. [23] recorded significantly higher seed yield in wheat under N application at 130 kg ha−1 which was due to more tillers m−2, spike length (11.30 cm), number of grains per spike (40.95) and 1,000 grain weight (41.91 g) as compared to N rates of 80 and 180 kg ha−1. Furthermore, Ali et al. [24] reported significantly more tillers, spike length (17.86 cm) grains/spike (53.37 cm), 1,000 seed weight (49.65 g) and thus greater seed yield (5.44 t ha−1) under N application rate of 150 kg ha−1 under semi-arid conditions compared to the N rate of 50 and 100 kg ha−1. Similarly, Modheja et al. [25] reported a reduction of 41% and 21% in wheat seed yield under N application rates of 50 and 100 kg ha−1 compared to that of N rate of 150 kg ha−1 because of reduction in the number of productive tillers, spikelet’s spike−1, number of grains m−2 and 1,000 grain weight. In another study, Asif et al. [26] recorded a linear increase in leaf area index (LAI), crop growth rate (CGR), leaf area duration (LAD), number of fertile tillers m−2, number of grain spike−1, and seed yield while growing wheat variety SH-2002 with the application of N from zero to 150 kg ha−1. Abid et al. [27] demonstrated that application of sufficient N to wheat increased photosynthetic rates and unit leaf area because of increased chlorophyll contents which alleviated drought stress and increased wheat grain yields.
In addition to the yield, ensuring an acceptable level of food quality is necessary to provide adequate protection for consumers. Various studies have documented the influence of N levels on the quality traits of various field-grown crops including wheat. For example, Mosanaei et al. [28] recorded 2.57%, 12.68%, and 1.63% increases in mean seed yield, protein, and N contents and 7.12% recession in starch contents by the application of 30% more N than the recommended dose (125 kg ha−1). Similarly, Faryal et al. [2] reported a significant increase in test grain weight, grain yield, grain crude protein contents, gluten contents, zeleny index (ZI) and falling number; but a significant decrease in grain starch under N application of 210 kg ha−1.
No doubt, impact of N in bread wheat has been studied to a large extent in Pakistan, but the varietal revolution necessitates to investigate its specific impacts on new varieties of wheat. Ujala-2016, a new wheat variety which a high yield potential than other varieties, is reported to be highly tolerant against abiotic stresses [29]. Keeping in view the significance of N in wheat, the current investigations were undertaken to explore its impact on wheat variety Ujala-2016.
2.1 Soil, Climate, and Treatments
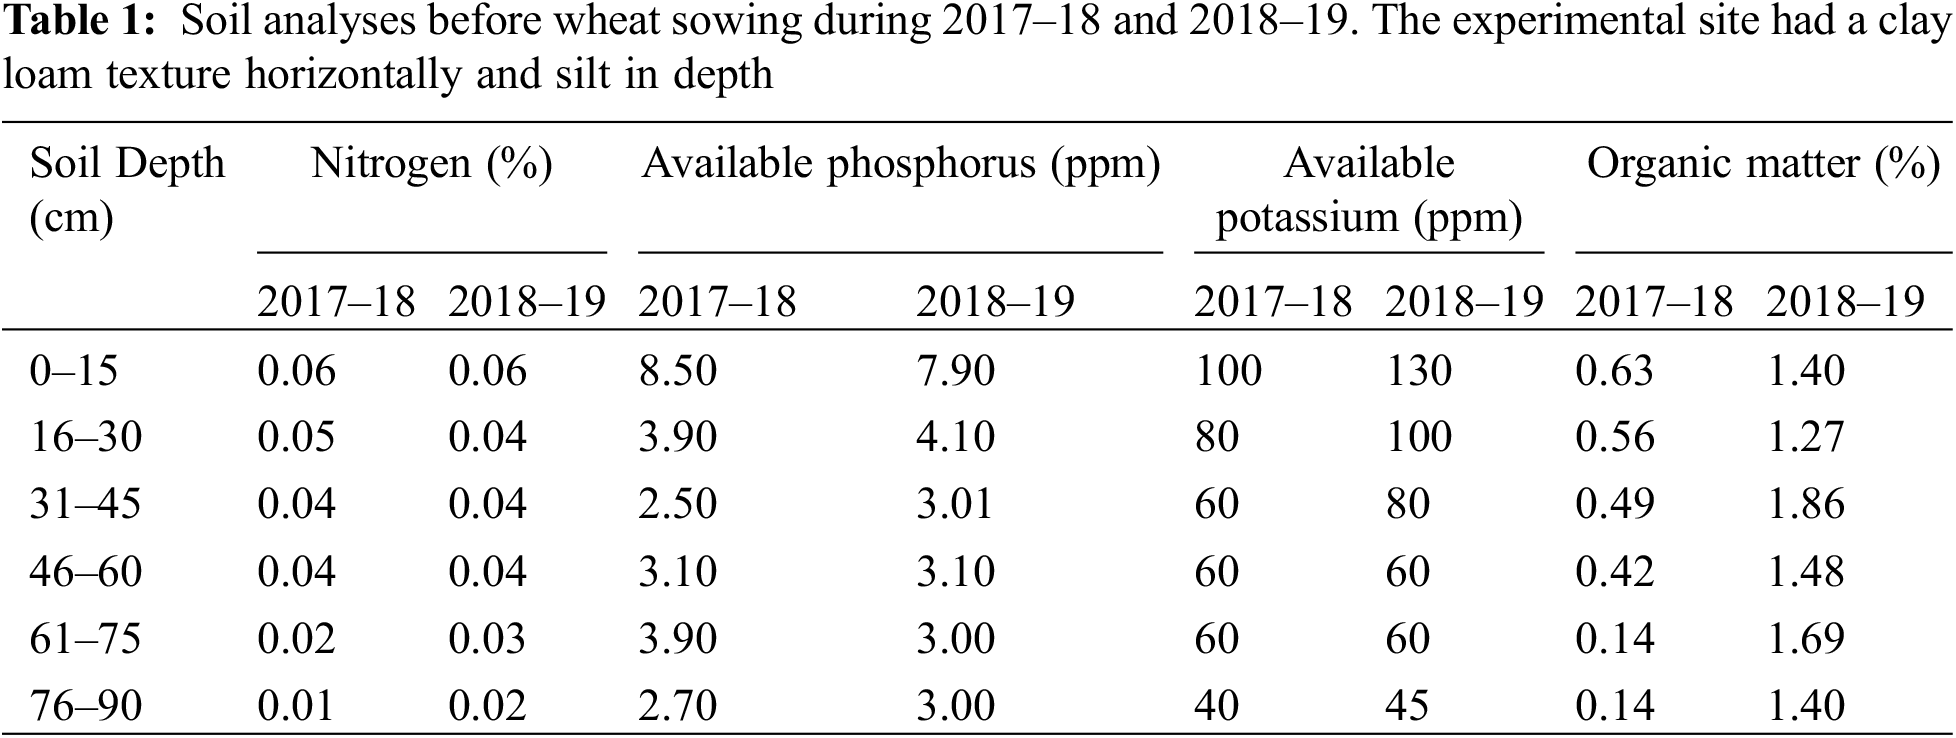
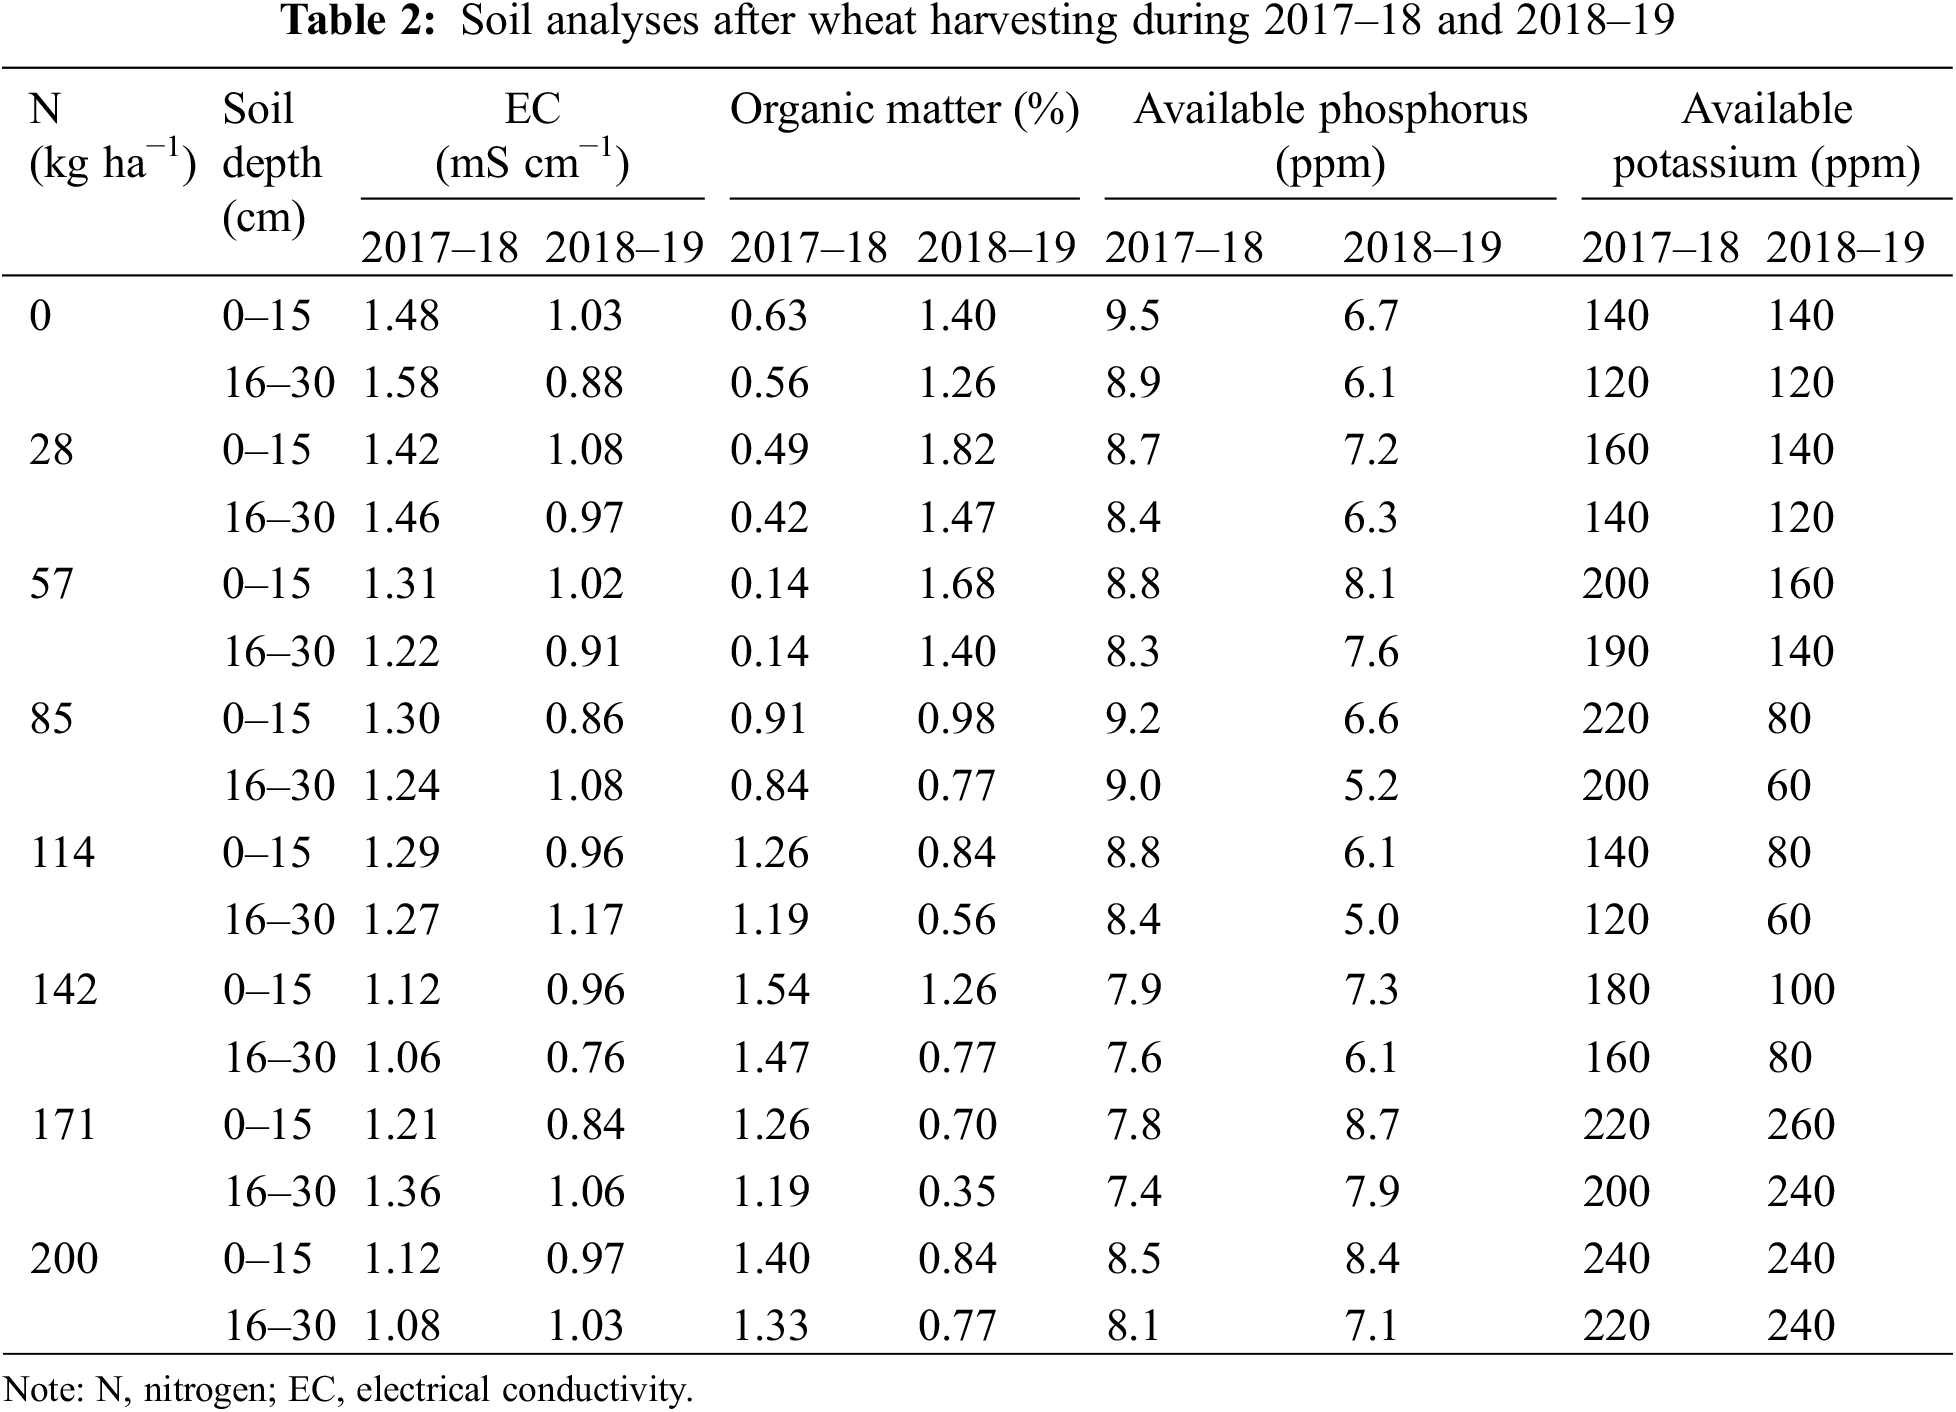
Two years fixed-site field studies were conducted at the Research Area, Agronomic Research Institute, Faisalabad, Pakistan (31.25°N latitude and 73.09°E longitudes with an elevation of 184.0 m) during 2017–18 and 2018–19. The experiment was laid out in a randomized complete block design with three replications. It consisted of eight N application rates: control (N1), 28 kg ha−1 (N2), 57 kg ha−1 (N3), 85 kg ha−1 (N4), 114 kg ha−1 (recommended, N5), 142 kg ha−1 (N6), 171 kg ha−1 (N7) and 200 kg ha−1 (N8). Wheat variety Ujala-2016 was sown on 10th of November during both years in a well-prepared seedbed using seed rate of 100 kg ha−1 in 22.5 cm apart rows in plots measuring 6.75 m × 10.0 m. Whole phosphorus (84 kg ha−1) and potash (62 kg ha−1) and 1/3rd of N were applied at final seedbed preparation. Remaining 2/3rd N as per the treatments was applied at tillering and stem elongation stages. The soil was analyzed before sowing and after crop harvesting (Tables 1 and 2).
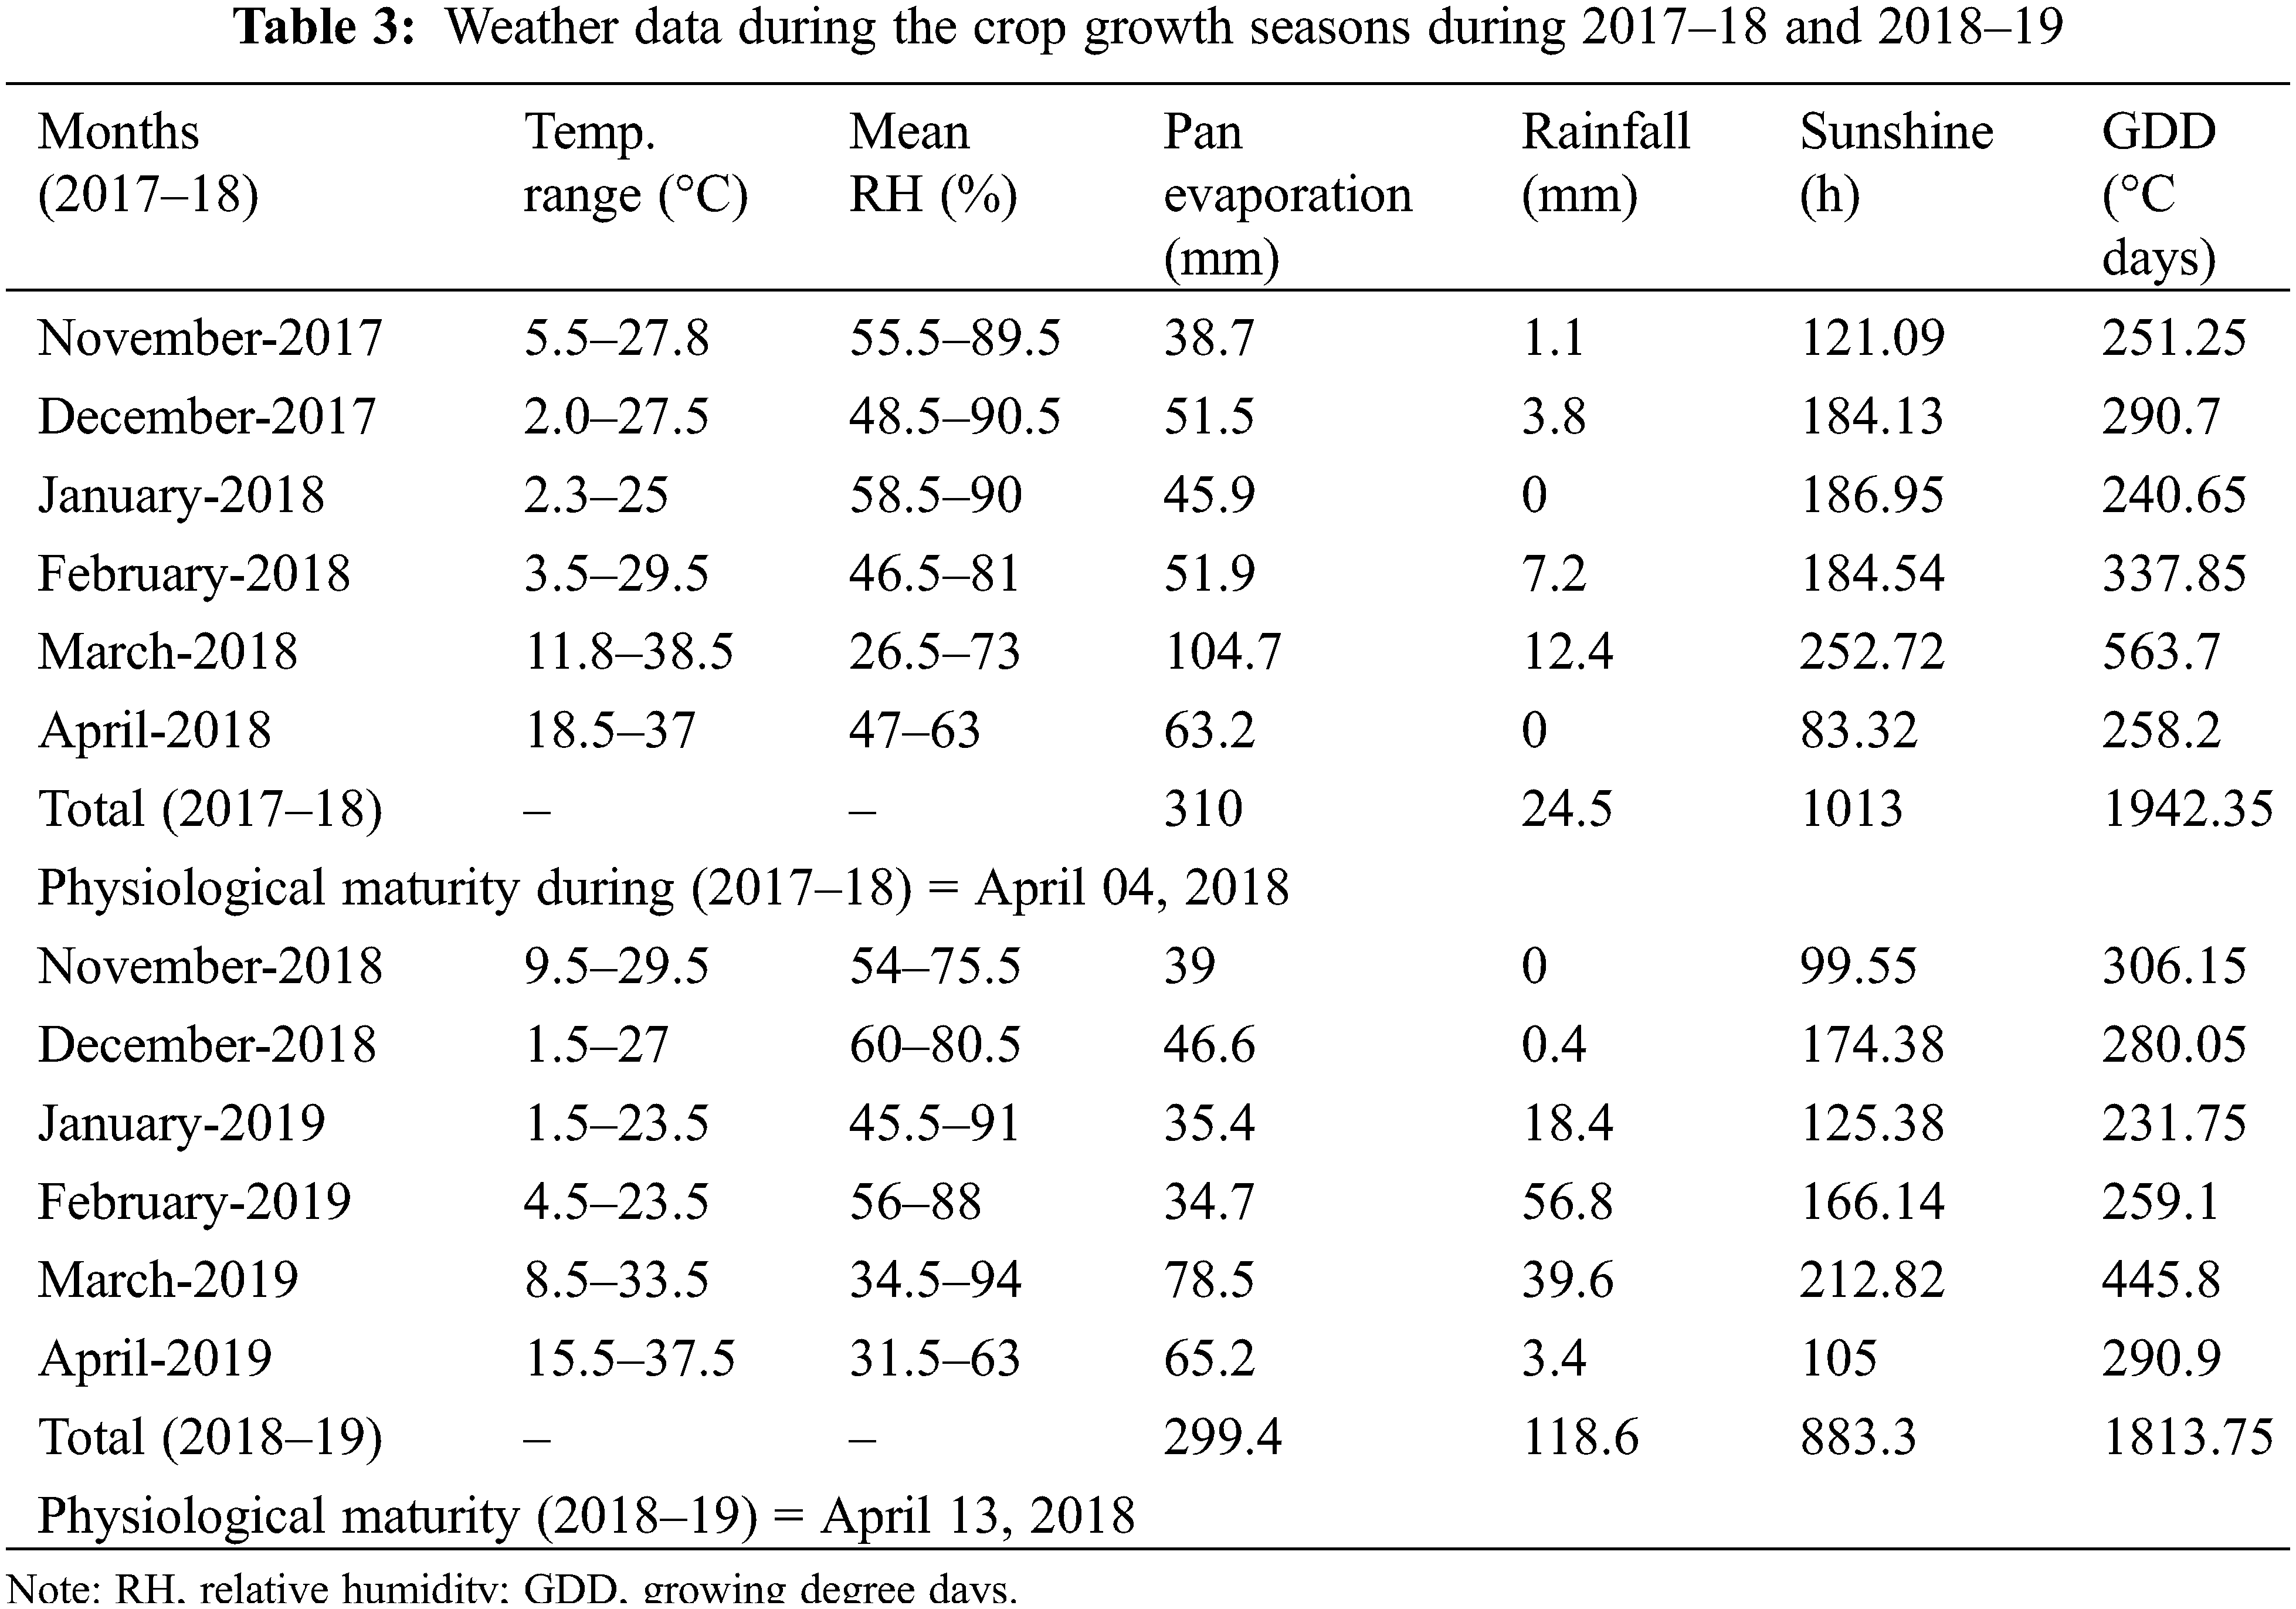
The meteorological data were recorded daily from the observatory half kilometer away from the experimental site. During 2017–18, crop received 350 mm water in the form of 4 irrigations including 25 mm rainfall; while in 2018–2019 the crop received 369 mm water in 3 irrigations including 119 mm rainfall. Irrigations were applied using a cut-throat flume. The crop was harvested on 11th and 13th of April during 2017–18 and 2018–19, respectively (Table 3).
A composite soil sample was taken before sowing and analyzed for different properties. Likewise, five core soil samples were taken from each experimental unit after harvesting the crop. These were then mixed to make a composite sample of each treatment and then dried at 40°C and ground to a size of <2 mm. Subsamples of 10 g were then taken from each composite sample and stored in polythene bags for chemical analysis. The organic matter content and soil N content were determined through wet oxidation determination and Kjeldahl method, respectively [30,31]. The phosphorus and potassium contents were determined by spectrophotometry and flame photometer, respectively.
First sampling for estimation of crop growth was made 40 days after sowing (DAS). Subsequently, the sampling was done at 14 days interval. In order to record the growth parameters, plants from an area of one square meter were harvested at ground level. Fresh weight of the whole sample was recorded. Plants were divided into their component fractions (leaves, stem, and spikes when they appeared) and weighed afresh. A subsample of 10 g from each fraction was taken and dried in the electrical oven maintaining a constant temperature of ±70°C to get constant weight. Crop growth rate (CGR) and net assimilation rate (NAR) were determined on the basis of seasonal growth data using the formulae suggested by Hunt [32] and opted by Rafiq et al. [33], and values are shown in g m−2 d−1:
where, Wt1 and Wt2 are the total dry weights of samples (g m−2) at first and second sampling, and T2 and T1 are the duration (days) between the two sampling dates.
Leaf area index: At each sampling, leaf area of the sub-samples consisting of 10 g fresh leaves was measured using leaf area meter (Licor, Model-3100). LAI was thereafter calculated as the ratio of the total leaf area to the land area.
Leaf area duration: LAD was determined according to the equation by Hunt [32].
where, LAI1 and LAI2 are the leaf area indices at the time of first and second sampling, while T2 and T1 are the duration (days) between the two sampling dates.
Growing degree days: GDD were calculated from the date of sowing date (10th of November) till the last sampling date (2nd April) for both years using the formula of Salazar-Gutierrez et al. [34].
During both years, 30 plants from each plot were tagged for recording data of plant height, spike length, grains spike−1, days to anthesis, and physiological maturity (by daily visiting the field). Thereafter, an average was calculated. At maturity, an area of 11.25 m2 was harvested from each plot and threshed manually. Biological and seed yield/plot (kg) was recorded and converted into kg ha−1. Half kilogram grains from each plot were taken for recording 1,000 seed weight and their qualitative analysis.
Various quality characteristics were determined by the methods described by the American Association of Cereal Chemists [35] and Alina et al. [36]. The Kjeldahl method was used to determine the grain N contents. The protein contents were obtained by multiplication of percent N with a correction factor. Starch contents were determined by Omeg Analyzer G, where an 18-mm sample spacer was used to filled wheat grains in machine sample hopper. After that, the digital reading of starch content was noted from screen display, according to the procedure of Alina et al. [36]. Gluten values of grains were estimated by glutomatic apparatus, by using sodium chloride solution, according to the method of [35].
The analysis of variance (ANOVA) for all studied traits was performed using the general linear model (GLM) procedure of the SAS 9.4 software for Windows (SAS, 2013). Data were statistically analyzed using Fisher’s least significant difference (LSD) test at p ≤ 0.05 [37]. Boxplots were drawn to show the variation in N application rates. In R project (version 3.4.5), ggplot2 package was used to draw boxplots. Pearson correlation coefficients were used to assess the associations among growth, yield, and grain biochemical composition parameters. Principle component analysis (PCA) analysis was conducted to reveal the interrelationship of studied traits with fertilizer treatments.
3.1 Yield and Yield Contributing Parameters
The results showed that there were highly significant (p ≤ 0.01) differences among N fertilization on plant height (PH), number of tillers per m2 (NTM), number of spikelets per spike (NSS), grain yield (GY), grains per spike (GS), 1,000 grain weight (TGW), leaf area duration (LAD), net assimilation rate (NAR), crop growth rate (CGR), and leaf area index (LAI) in response to varying N rates during both years of study (Tables 4–6). The results of the mean effect showed that 200 kg N ha−1 recorded the highest wheat plants (116.82 cm), the highest number of tillers per m2 (520.67), and the highest number of spikelets per spike (21.39), followed by 171 kg N ha−1 (113.24, 467 and 20.62 cm, respectively) in both seasons (Table 4) in comparison with control treatment (no N fertilizer). The data indicated a greater number of grains per spike with the application of N at 142 and 171 kg ha−1; while the application of a higher dose of N (200 kg ha−1) remained at par with that of N rate of 142 and 171 kg ha−1. Mean of the years showed that 142 kg N ha−1 resulted in the maximum number of grains per spike. Also, the data (Table 5) showed a progressive increase in 1,000 seed weight with increasing levels of N applied from 28 to 142 kg ha−1 and its recession thereafter with additional incremental N, demonstrating the non-profitability of its additional application. There was a 2.36% increase in the 1,000 grain weight by the application of N at 142 kg ha−1 and a reduction of 7.61% and 11.70% by the application of higher doses of N (171 and 200 kg ha−1) in comparison to its recommended (114 kg ha−1) dose. Mean of cumulative data presented in Table 5 depicted a regular increase in wheat seed yield with increasing levels of N from control to 142 kg ha−1 (1,792.5 to 5,461.3 kg ha−1). Application of higher levels of N resulted in lodging. The data (Fig. 1) revealed a significant increase in LAI with an increase in N levels during both years of study. Whereas 200 and 171 kg N ha−1 recorded the greatest LAI in both seasons.
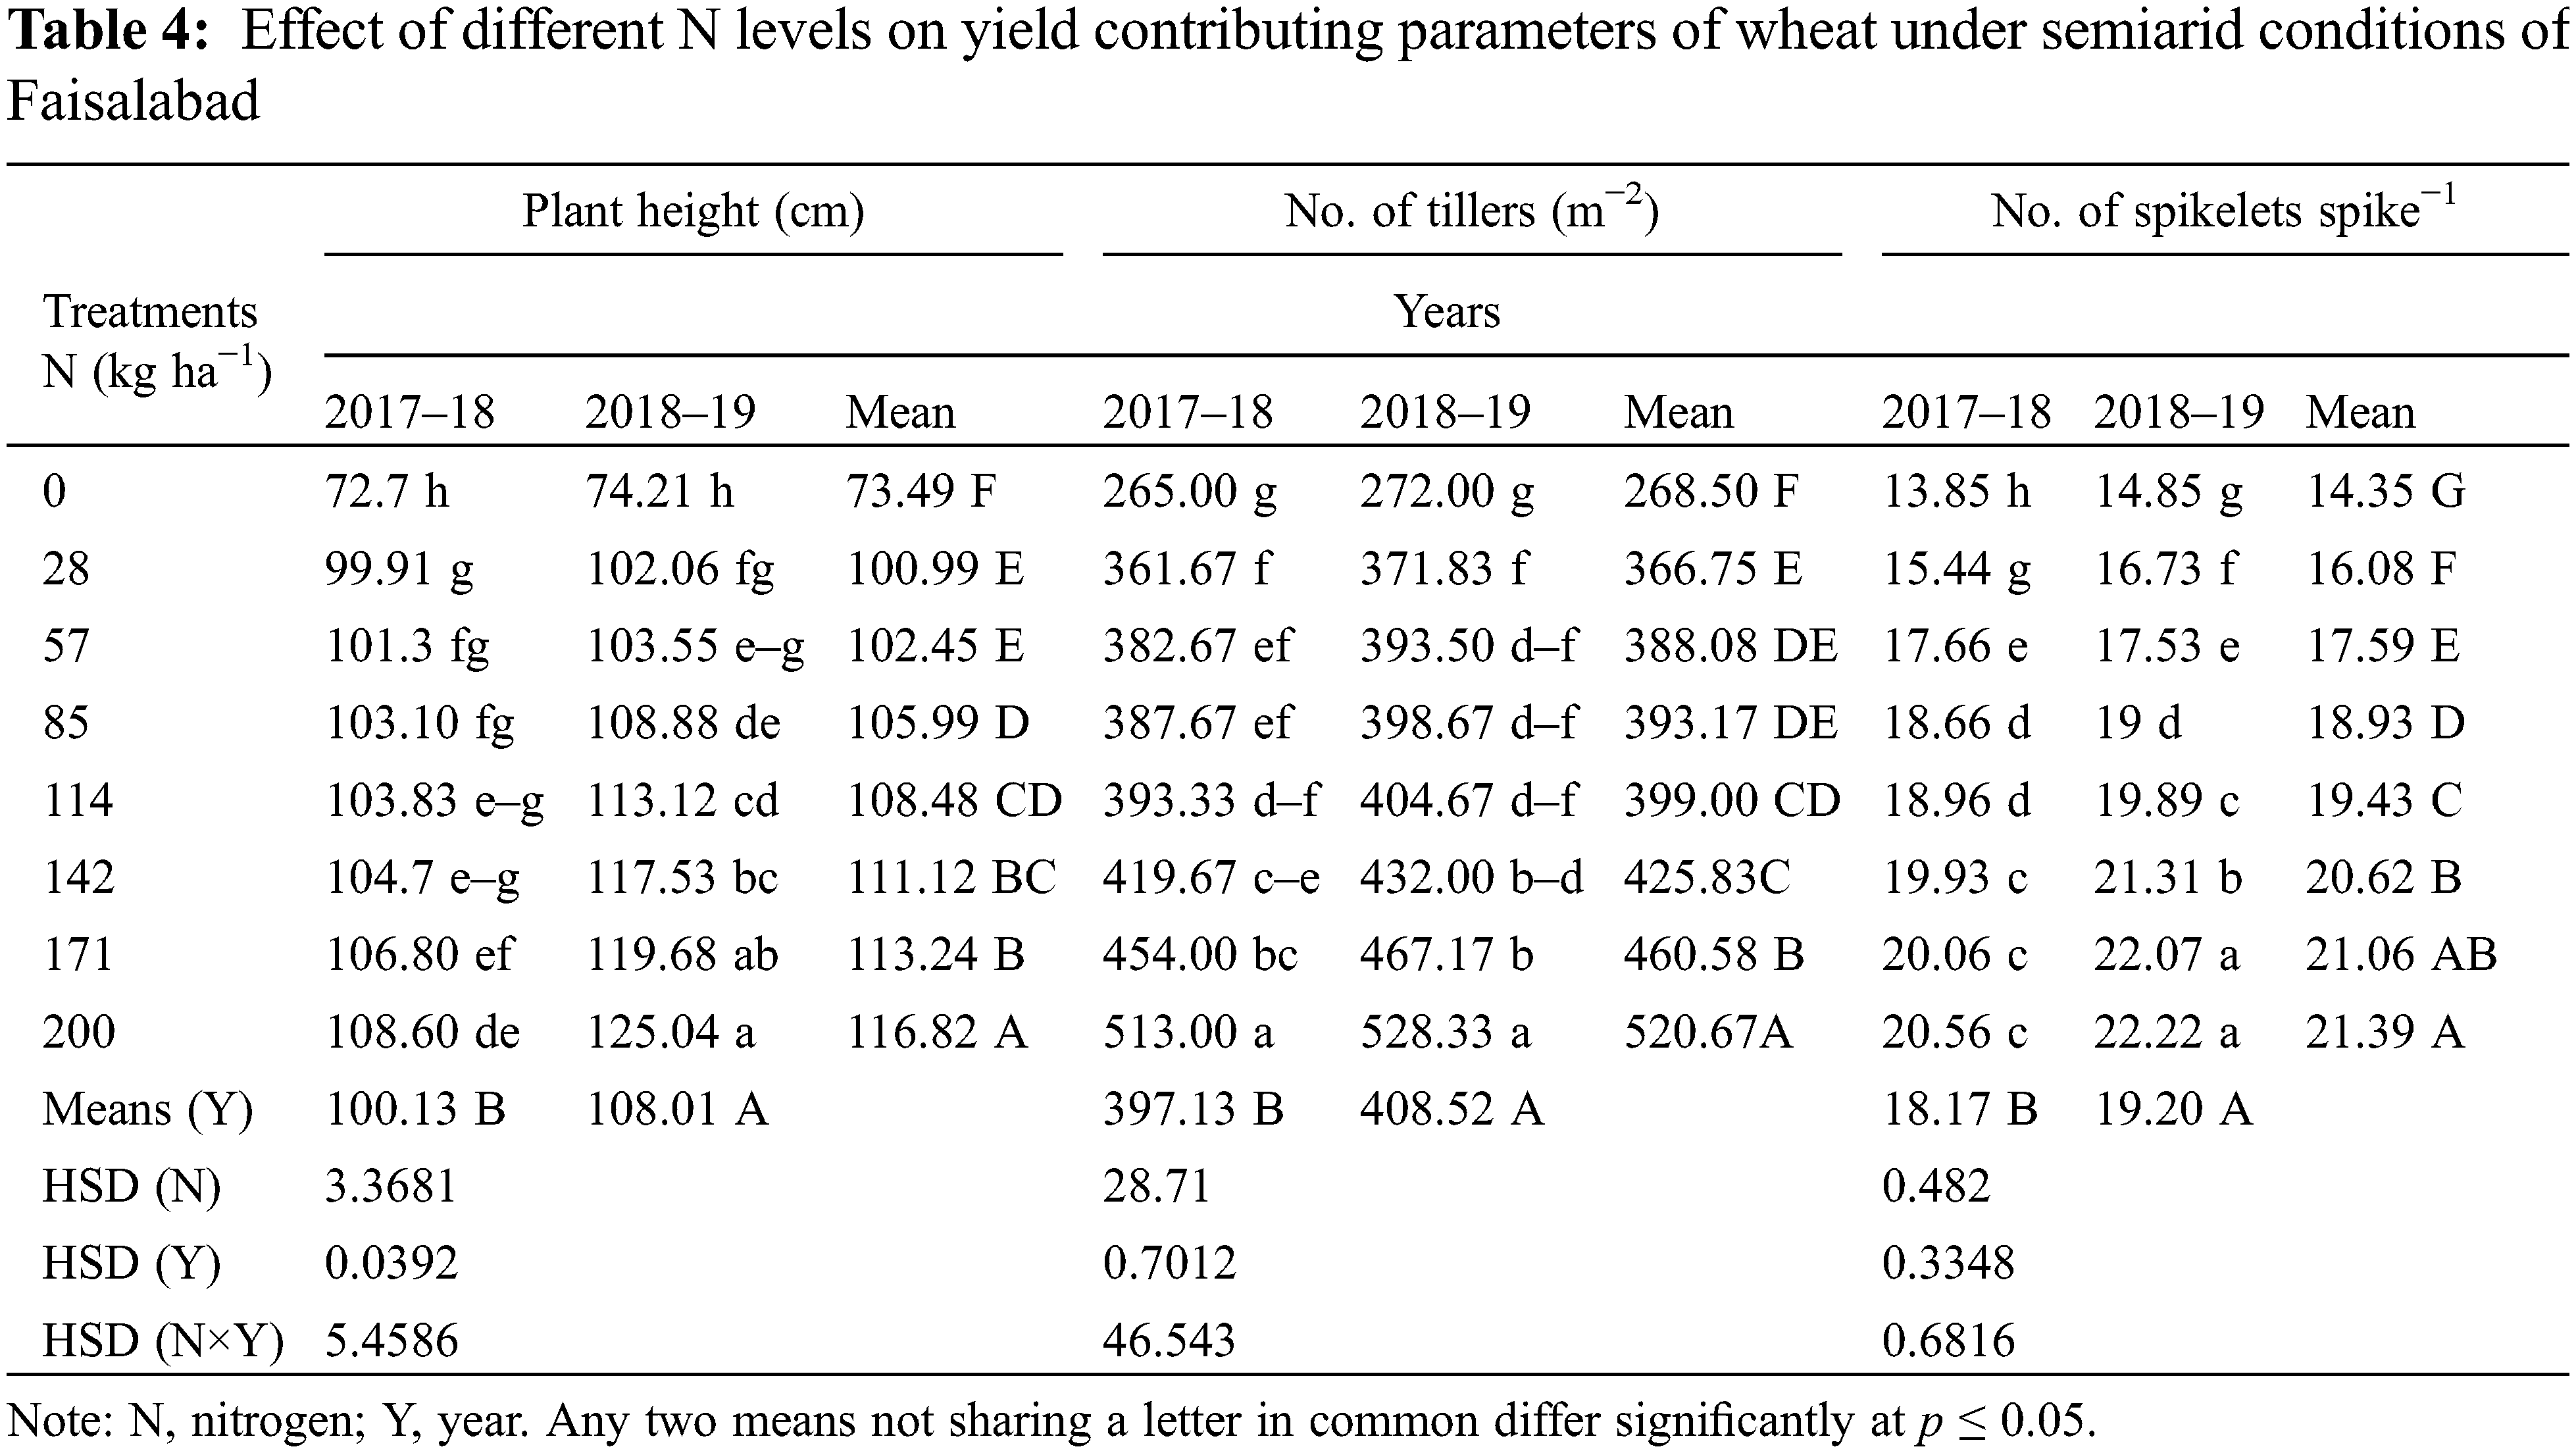
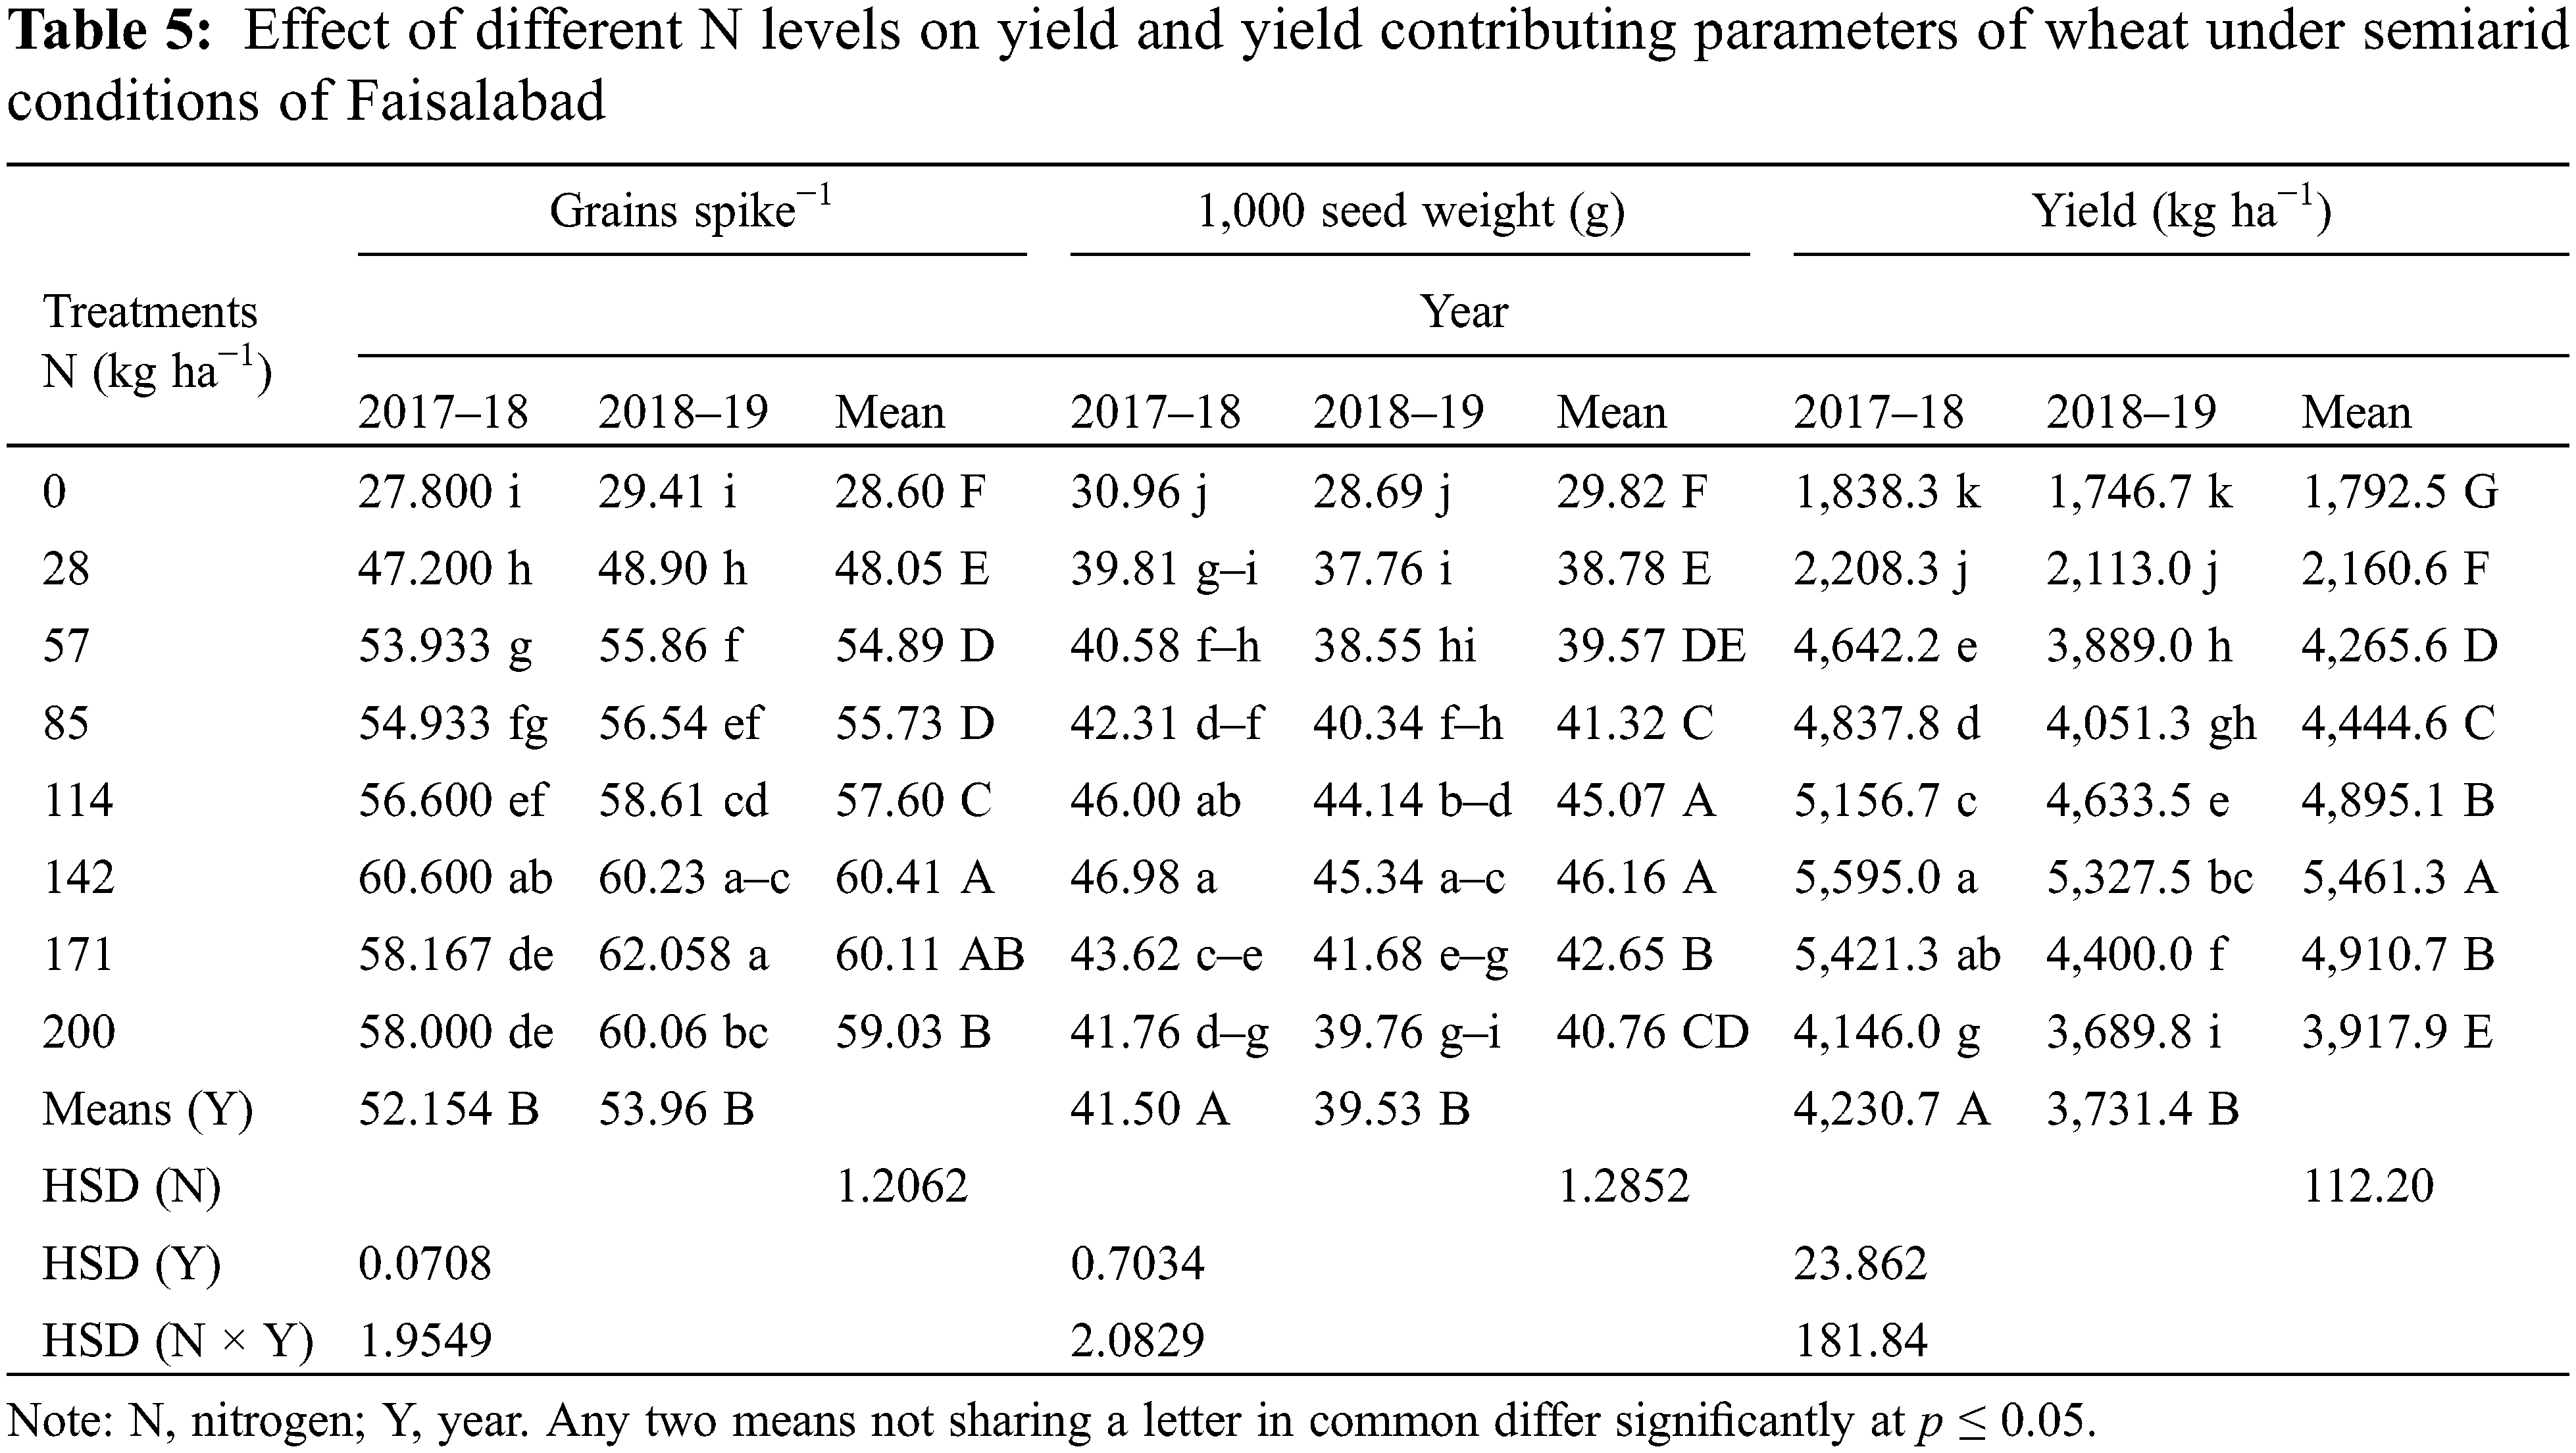
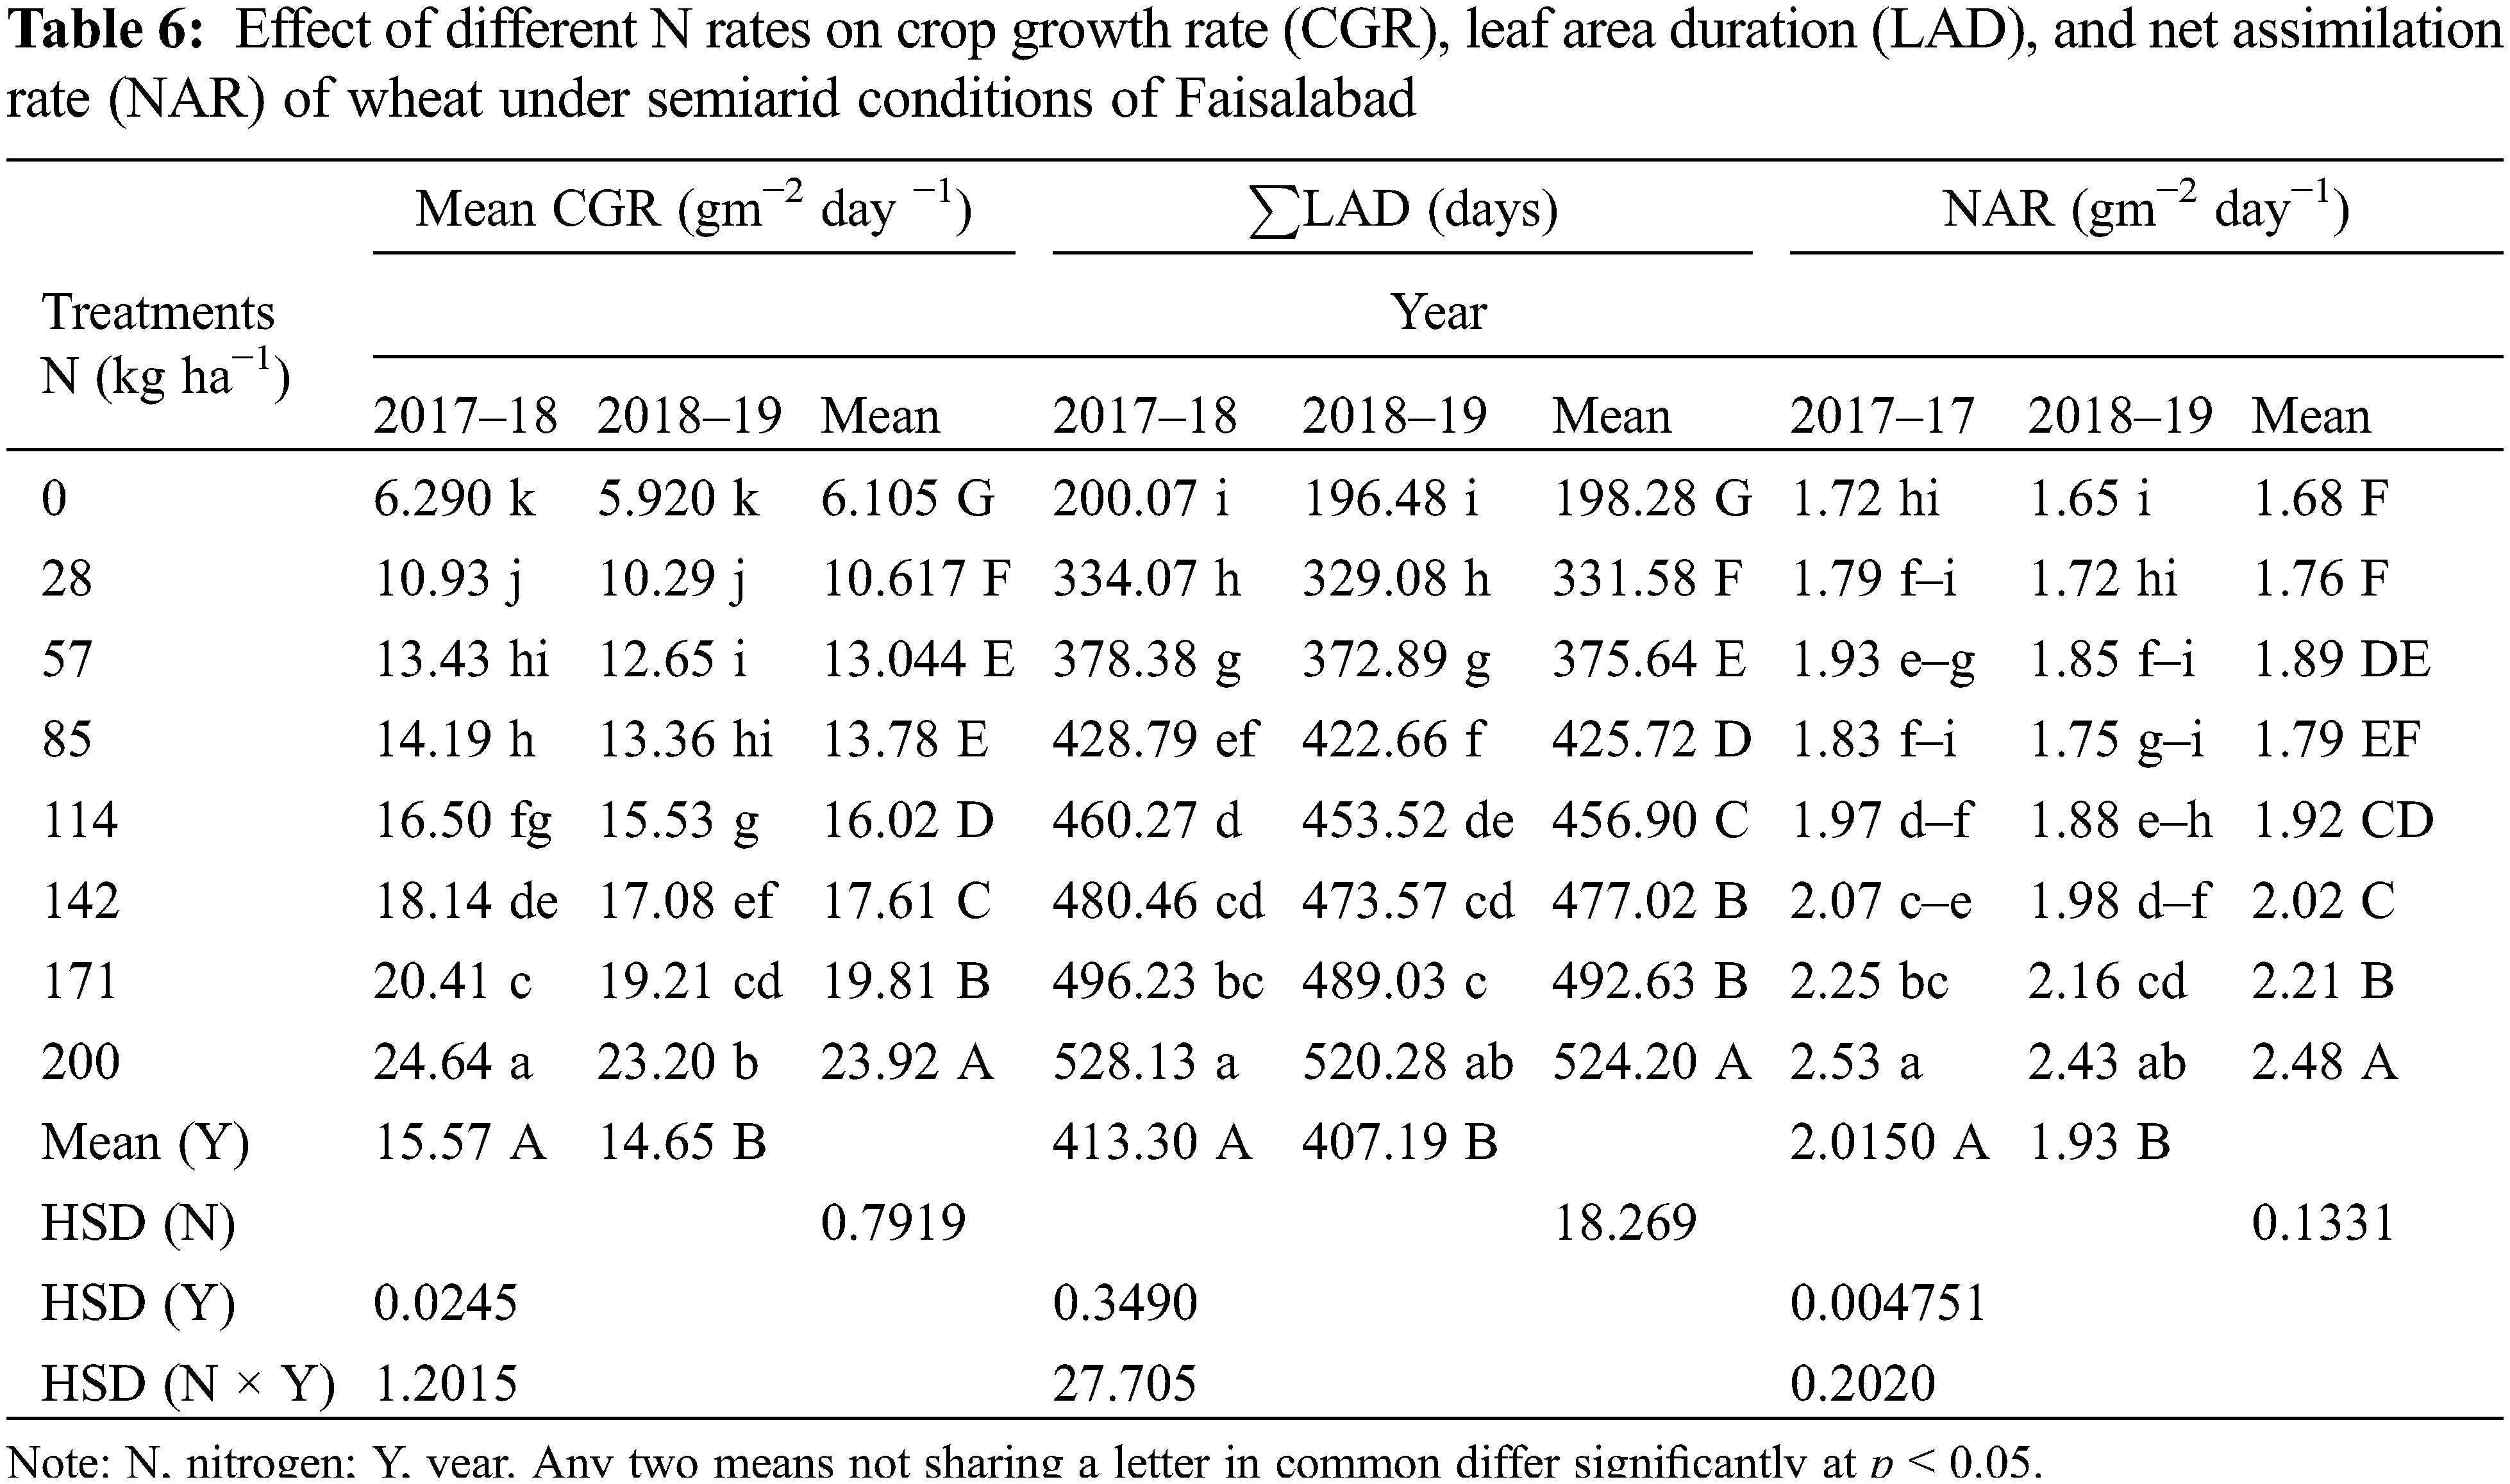
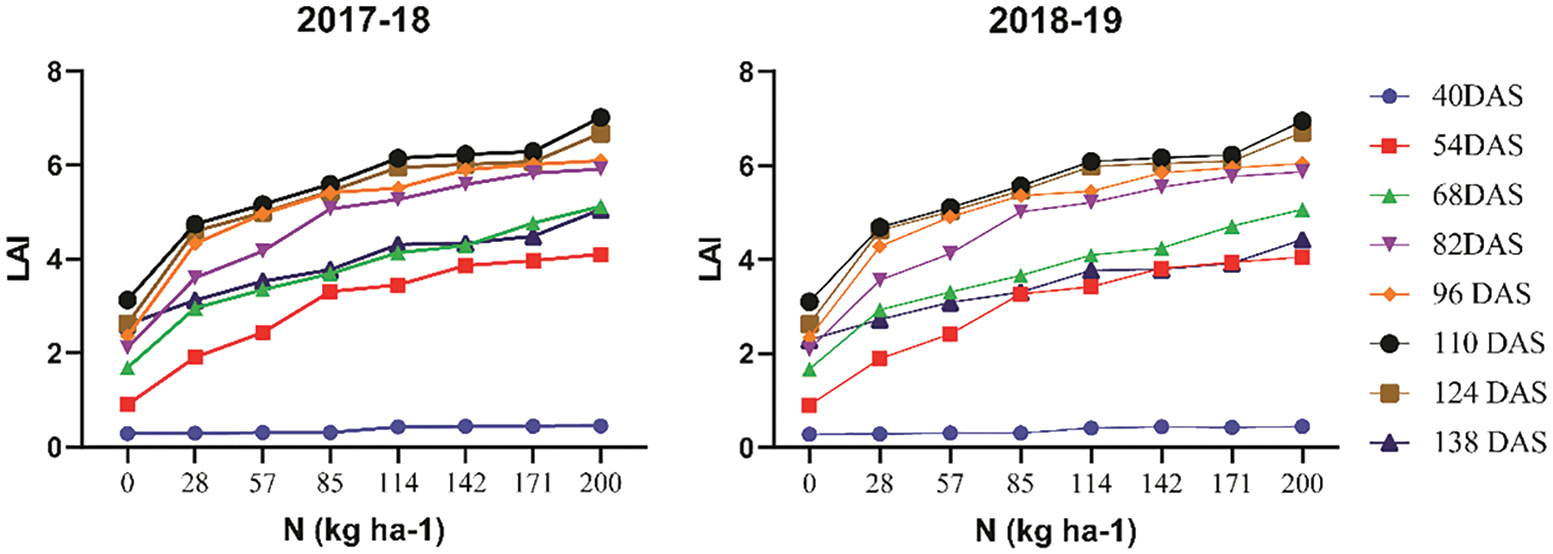
Figure 1: Effect of different N rates on leaf area index (LAI) under semiarid conditions of Faisalabad
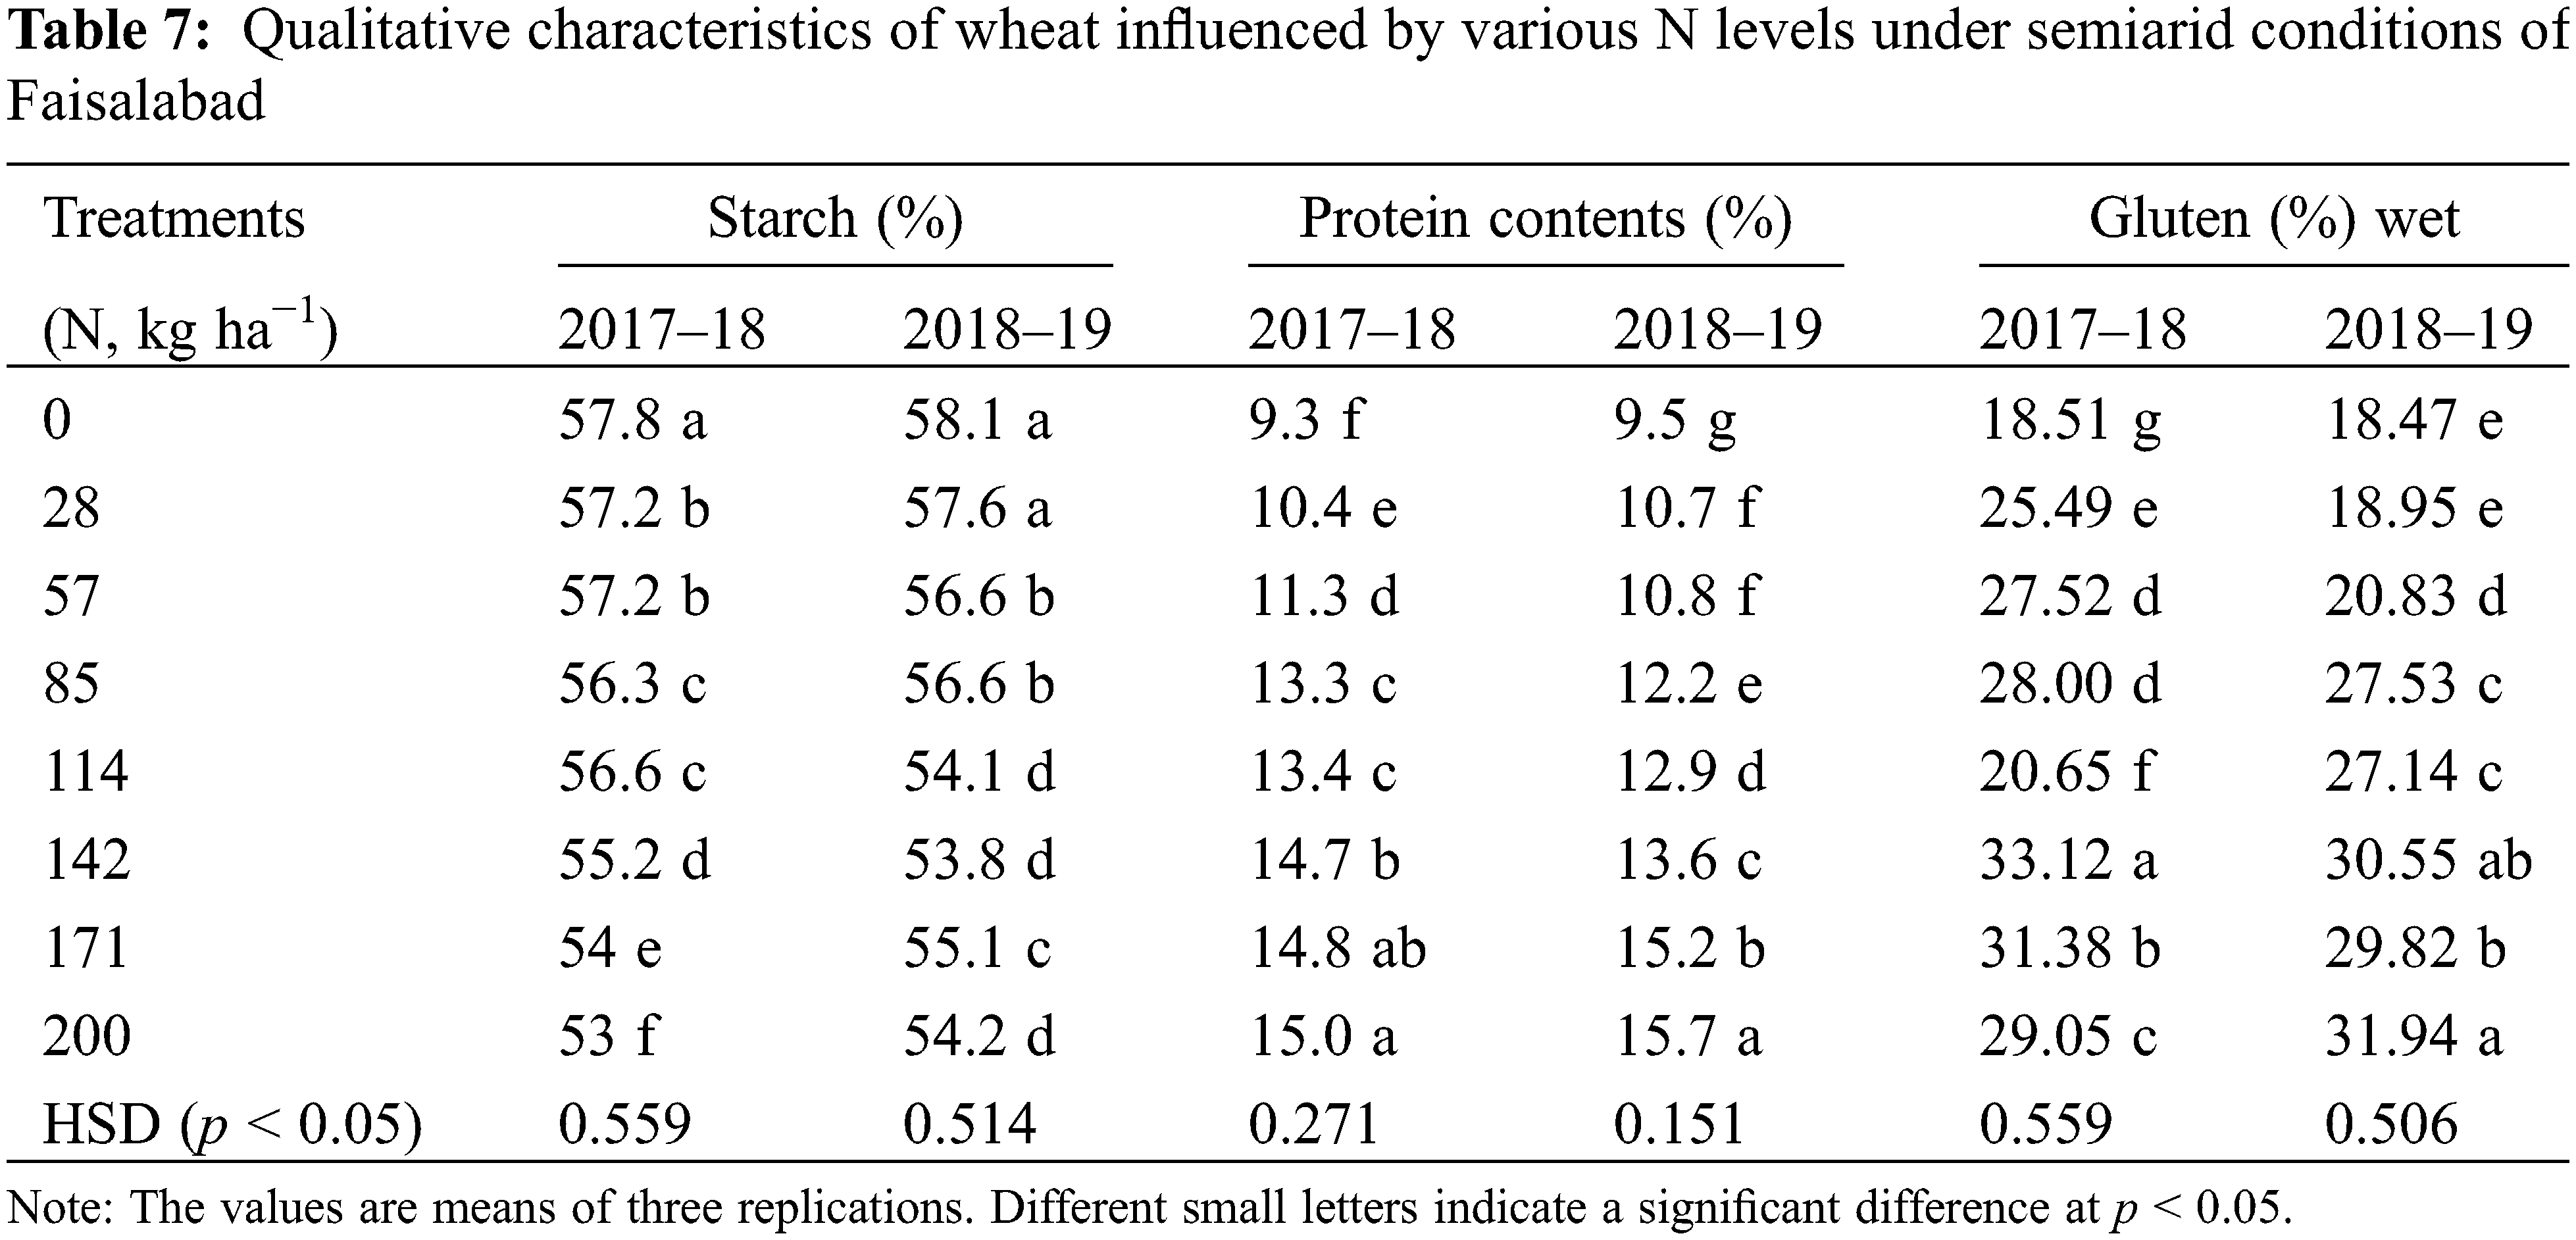
The results showed that there were highly significant (p ≤ 0.05) differences. Among the varying N fertilization rates on protein content, gluten, and starch. Seed crude protein, a gauge for grain quality was affected in both years (Table 7). It was also proportionally related to the N applied; its average however ranged from 9.4% (control) to 15.35% (N rate of 200 kg ha−1). Data indicated an increase in wet gluten contents from 18.51% for control to 33.38% for N rate of 140 kg ha−1 during 2017–18 and from 18.47% (control) to 31.94% (N rate of 200 kg ha−1) during 2018–19 (Table 7).
3.3 Correlation between Studied Traits
Correlation analysis among all studied traits showed that significant and positive correlations were exhibited (Fig. 2). Amongst the yield trait pairs, the correlation between GY and TSW (0.87), TSW and SSN (0.76), GS and TSW (0.89) were significant, while the least correlation was observed between CGR and TSW (0.56). Also, correlations among the quality traits were significant and positive, except for the correlation of starch content with all other traits (Fig. 2). Among the growth traits, the correlation between PH and LAD (0.98), TN and PH (0.95), and TN and CGR (0.92) showed the highest significant positive coefficients. As for as the correlation among different types of traits, including yield, growth, and seed quality parameters is concerned, highly significant positive correlations were exhibited between PC and CGR (0.91), gluten and LAD (0.82), PC and GS (0.80), LAD and TSW (0.82), GY and CGR (0.58) (Fig. 2).
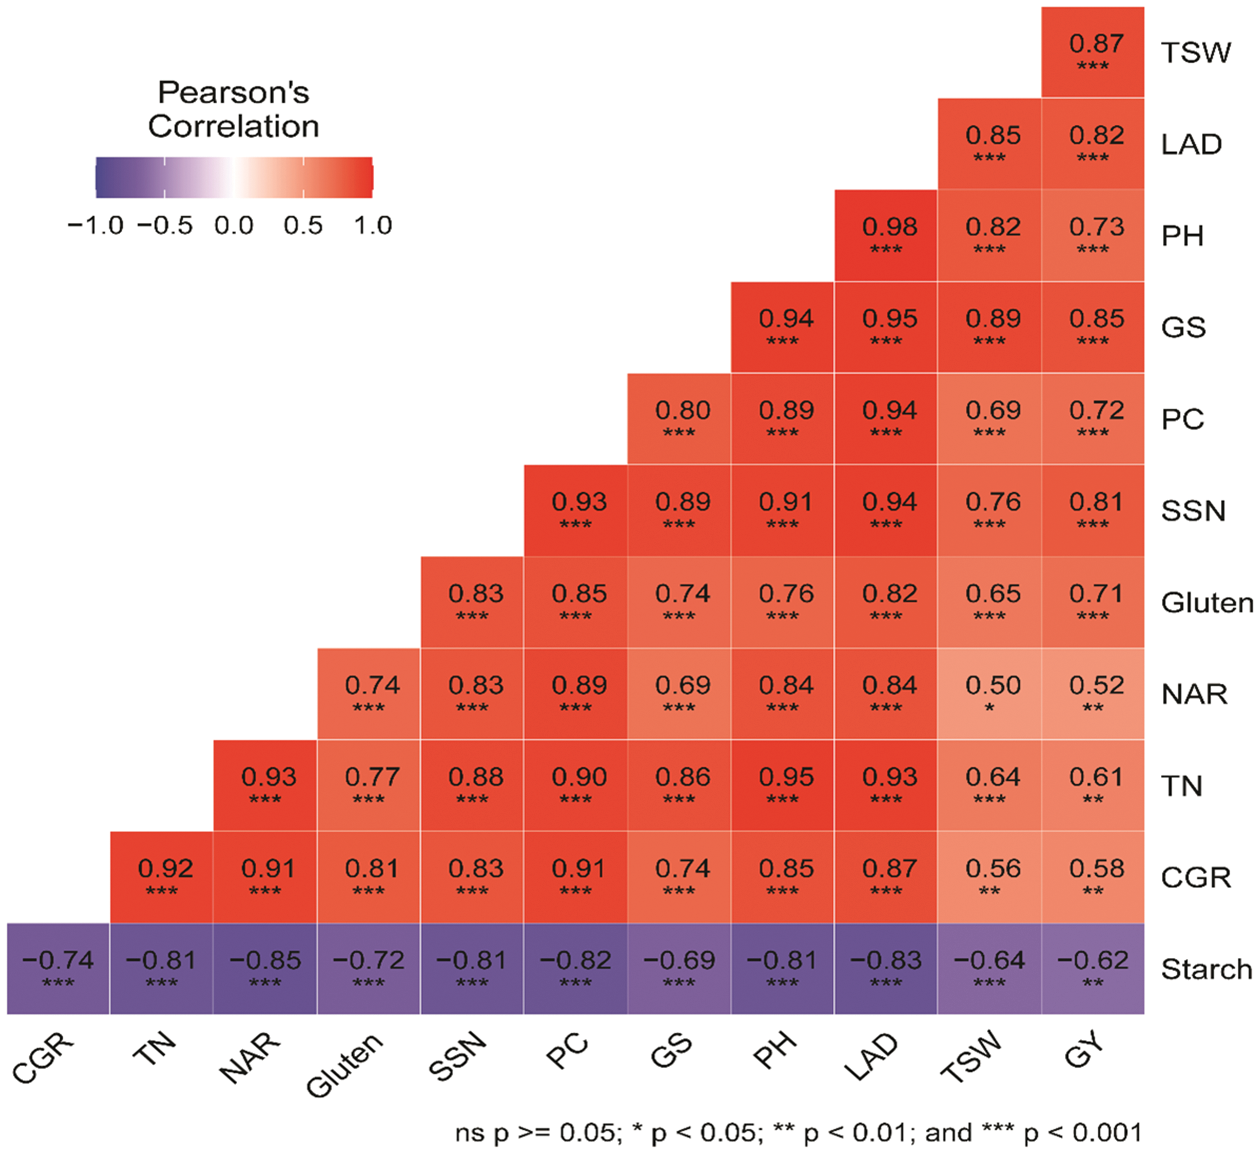
Figure 2: Pearson’s correlation coefficients among all studied traits under different nitrogen fertilizers levels (combined analysis of two successive seasons). PH, plant height; TN, number of tillers per m2; SSN, number of spikelets per spike; GY, grain yield; GS, grains per spike; TGW, 1,000 grain weight; LAD, leaf area duration; NAR, net assimilation rate; CGR, crop growth rate; PC, protein content
3.4 Interrelationship of Nitrogen Fertilizer Treatments Based on Yield, Growth, and Quality Parameters
The hierarchical clustering clearly distinguished the interrelationship between the combinations of N treatments according to their performance of yield, growth, and quality parameters (Fig. 3). With respect to relationship between nitrogen fertilization treatments, three main clusters were characterized. The first cluster was formed by the control treatment in which no N was applied. Within this group, 0 nitrogen fertilization treatment depicted the lowest values for all measured parameters except starch. The second cluster included 28, 57, 85 and 114 kg N ha−1, whereas N application at 57 and 85 kg ha−1 formed the closest sub-clusters. N fertilization treatments in the second cluster showed an opposite pattern to the first cluster, as all parameters were negatively affected showing lower values, especially for 28 and 57 kg N ha−1. In respect to the third cluster, three treatments were clustered together and further were separated into two subclusters: the first sub-cluster included N rates of 142 and 171 kg N ha−1, and the second sub-cluster included 200 kg N ha−1. The overall performance of the third cluster showed a discrepant effect on all measured traits, as the majority of traits were positively affected by N treatments, while the three treatments negatively affected the starch. In sum, N application at 200 kg N ha−1 resulted in the highest values for all traits, followed by 171 and 142 kg N ha−1.
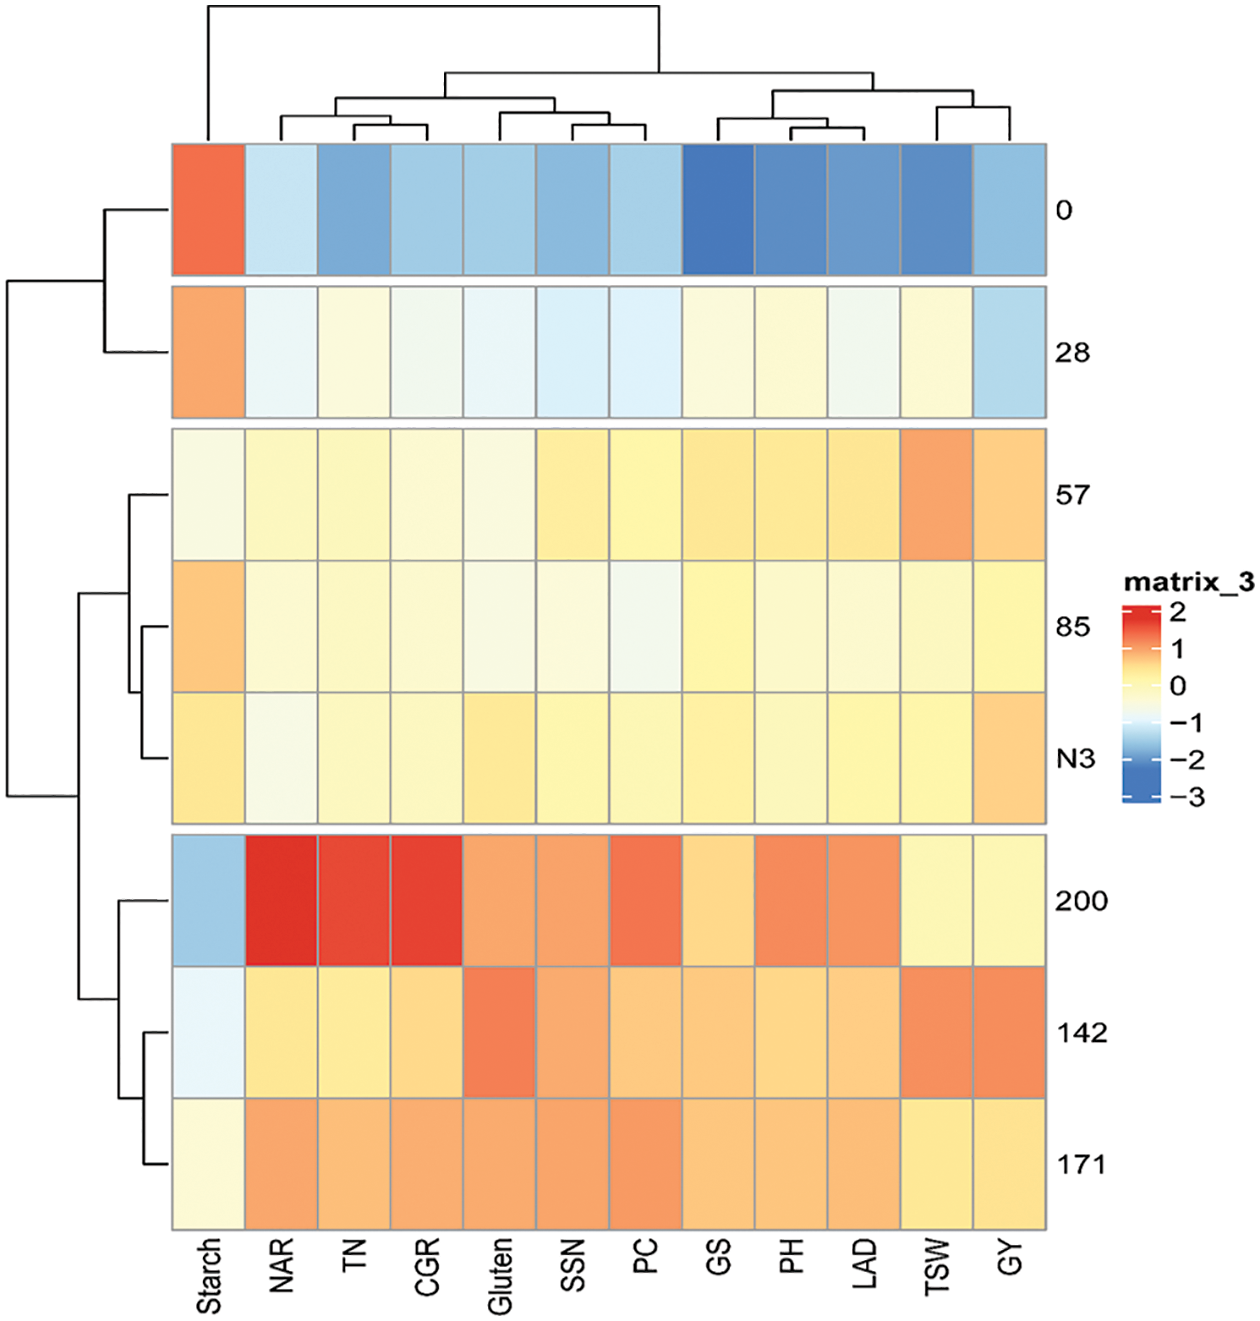
Figure 3: Clustering analysis presents the relationship between N fertilization treatments and studied traits. In the ballots, the hierarchical clustering analysis with the Euclidean distance using the principal component scores and Ward’s technique as the process of linkage was used. PH, plant height; TN, number of tillers per m2; SSN, number of spikelets per spike; GY, grain yield; GS, grains per spike; TGW, 1,000 grain weight; LAD, leaf area duration; NAR, net assimilation rate; CGR, crop growth rate; PC, protein content
3.5 Principal Component Analysis (PCA) Based on Nitrogen Fertilization Rates
To minimize the data dimensionality and show the possible correlations among the observed features in this research, PCA was undertaken using the dataset of seven fertilization variables (Fig. 4). Since the first two PCs revealed the largest proportion of variance (90.7%), the PCA-biplot was constructed using PC1 (82.3%) and PC2 (84%). The results of the biplot indicated that a strong distinction occurred between the mineral N treatments (Fig. 4). The seven treatments were separated on the biplot side where 200, 171 and 142 kg N ha−1 were in the upper right side of the figure which exhibited the highest values for grain yield and growth parameters. While, control without N was plotted at the bottom left of the figure with the lowest values.
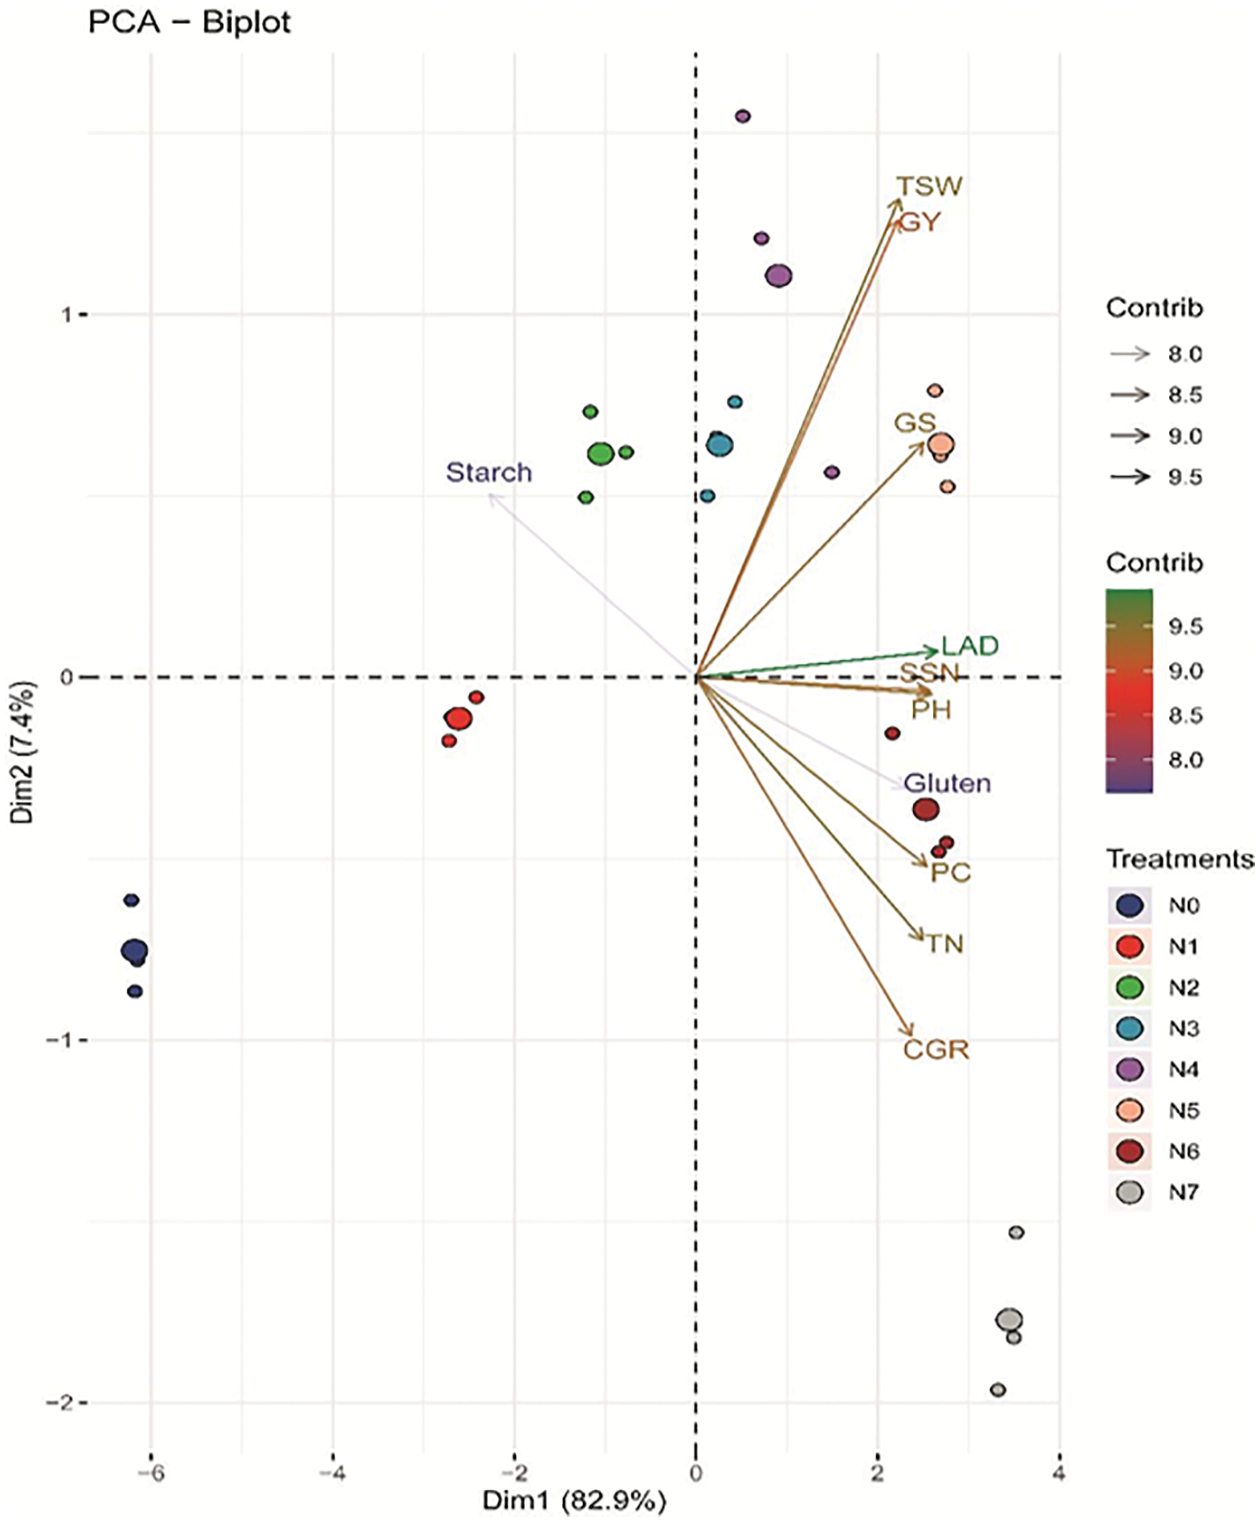
Figure 4: Principal Component Analysis (PCA)-biplot of N fertilizer treatments based on the variance in the morphological and yield traits. The first two components explained 82.3% and 8.4% of the variances, respectively. Arrows indicate the strength of the trait influence on the first two PCs. The different color intensities and lengths of the arrows denote the contribution of the traits to the first two components in the PCA. The darker green and longer arrows indicate a higher contribution, while the darker blue and shorter arrows indicate a lower contribution of the variables
A gradual increase in the levels of N significantly increased plant height during both years. Plants with sufficient N attained dark green color due to better growth, more photosynthetic activity, LAI, LAD, and greater plant height [38,39]. N fertilizer increases plant’s cytokinin contents [40] which in turn favors tillering by increasing germination of tiller primordia [41]. There was a significant increase in the number of tillers with the increasing amount of applied N during both years of study. An increasing trend in the number of tillers with an increase in N levels was also reported by Ali et al. [24] and Asif et al. [26]. The number of spikelets per spike or spike branching referred to as wheat sink [42–44] is also influenced by photoperiod and temperature [45] and is crucial in determining wheat grain yield [46]. Different rates of N had a significant impact on spike branching or spikelets per spike in this study. An increase in the number of spikelets because of higher supplies of N was reported by Nerson et al. [47] and Peltonen [48], and a decrease in the number of spikelets with N deficiency was reported by Ewert et al. [49] and Toyota et al. [50]. Similarly, in this work, data revealed a significant increase in LAI with an increase in N levels. The same has been reported by Nakano et al. [51]. Higher values of LAI were recorded till the crop’s physiological maturity in plots that received higher doses of N. Higher values of LAI with increased levels of N have also been reported in previous studies [23,24,26,40,41,52,53].
Our results also demonstrated that increasing N rates significantly increased the number of grains per spike. These results are also in line with the findings of Iqbal et al. [52], Amjed et al. [23], Leghari et al. [53], and Mosanaei et al. [28]. Test weight, the function of grain growth period may prove directly proportional to wheat seed yield [28], and any factor which causes a reduction in 1,000 grain weight reduces the final yield. Appropriate transmission of photosynthates from source to sink increased 1,000 seed weight with an increased N application in barley [54]. An increase in 1,000 grain weight of wheat with increasing levels of N has also been reported by Baethgen et al. [55]. Seed yield, the interactive product of N, soil fertility, other management factors, and environment with a plant population of the planted variety were significantly influenced by different N rates. The mean of cumulative data depicted a regular increase in wheat seed yield with increasing levels of N, however, higher rates demonstrated a decrease in yield. Application of higher levels of N resulted in lodging. Similar findings were reported by Fisher et al. [56], who reported a 7%–35% yield reduction because of stem lodging especially when it happened within 20 days after anthesis. Berry et al. [57] also reported yield reduction due to lodging. Higher seed yields under N rate of 142 kg ha−1 could be attributed to more number of grains (60.41) per spike, higher 1,000 grain weight (46.16 g), GDD (477.02°C days), NAR (2.0283 g m−2 day−1), more number of tillers m−2 and greater LAI for plants (Tables 4–7). Increased wheat yield because of a balanced increase of N has also been reported in several previous studies [22–25]. In addition, the Agriculture Department, Government of the Punjab Lahore in its wheat production plan for 2020–21 had also recommended N application rates of 158, 133, and 113 kg ha−1 for soils with organic matter of 0.86%, 0.86%–1.29% and >1.29%, respectively. These recommendations are also quite close to the findings of these studies; hence establishing the authenticity of our findings.
The nutritional quality of wheat grains is of pivotal importance as these comprise an important part of our daily diet and are also consumed as a staple food by billions across the globe. Starch percentage in wheat grains was inversely proportional to the applied N; the same had also been confirmed by Kozlovsky et al. [58], Benjamín Ramírez et al. [59], Faryal et al. [2], and Sohail et al. [60]. Seed crude protein, a gauge for grain quality was affected in both years. It was also proportionally related to the applied N; its average however ranged from 9.4% in control to 15.35% with N rate of 200 kg ha−1. The results are in line with those of previously reported studies [2,61,62]. Wheat grains contain gluten (C24H27N5O9)-a protein-itemization that yields peptides and amino acids in the human digestive system which are then absorbed in the intestine. Data indicated an increase in wet gluten contents from 18.51% (control) to 33.38% (N rate of 140 kg ha−1) during 2017–18 and from 18.47% in control to 31.94% with N rate of 200 kg ha−1. Increasing trends in wheat gluten content by increased N levels have also been reported by Kozlovsky et al. [58], Benjamín Ramírez et al. [59], Faryal et al. [2], and Sohail et al. [60].
In the current study, findings of Pearson correlation analysis among studied parameters showed interesting significant, and strong correlations among these. These traits are of great importance for selection and breeding criteria for grain yield improvement, which highlights the role of those yield components in contributing to high grain yield. Similar findings were reported in different studies [63–66]. Contrary to our research, El-Sorady et al. [67] reported that grain yield was negatively correlated with plant height.
PCA was utilized in this work to evaluate the effects of N fertilization rates on growth, yield, and yield-related traits in wheat. PCA is usually used to identify the traits that accounted for the majority of the existing variation, thereby it is widely implemented in several studies to confirm the influential factors which affect the studied parameters [68,69]. In this study, the results of PCA confirmed the findings of ANOVA as the first two PCs accounted for 90.7% of the total variation among N fertilization treatments. A notable distinction was observed among N rates, implying the usefulness as a robust and fast visualizing tool to investigate the influence of the treatments on the measured traits. In this context, N at 200 and 171 kg ha−1 treatments were superior in yield and growth characters, while control without N showed a reverse pattern for the same traits.
The application of different N rates significantly influenced the yield, yield-related traits, and quality of the wheat cultivar Ujala-2016. However, maximum yield, and significant improvement in the studied traits, were recorded at a N rate of 142 kg ha−1 in comparison to the other N application rates. Therefore, the application of N to wheat crop for other varieties may also be critically revisited for achieving higher economic yields and grain quality.
Acknowledgement: The authors would like to extend their sincere appreciation to the Researchers Supporting Project No. (RSP2023R410), King Saud University, Riyadh, Saudi Arabia.
Authorship: Study conception and design: Muhammad Rafiq, Muhammad Saqib, Husnain Jawad, Muhammad Arif; data collection: Muhammad Rafiq, Muhammad Saqib, Ghulam Abbas; analysis and interpretation of results: Talha Javed, Sadam Hussain, Muhammad Sultan Ali Bazmi, Marjan Aziz, Baber Ali; draft manuscript preparation: Muhammad Saqib, Sadam Hussain, Muhammad Azeem Sabir; funding acquisition: Aneela Gulnaz, Sobhi F. Lamlom, Baber Ali, Mohammad Khalid Al-Sadoon..All authors reviewed the results and approved the final version of the manuscript.
Funding Statement: Supported by Researchers Supporting Project No. (RSP2023R410), King Saud University, Riyadh, Saudi Arabia.
Conflicts of Interest:: The authors declare that they have no conflicts of interest to report regarding the present study.
References
1. Wang, J., Hussain, S., Sun, X., Zhang, P., Javed, T. et al. (2022). Effects of nitrogen application rate under straw incorporation on photosynthesis, productivity and nitrogen use efficiency in winter wheat. Frontiers in Plant Science, 13, 862088. [Google Scholar]
2. Faryal, S., Ullah, R., Khan, M. N., Ali, B., Hafeez, A. et al. (2022). Thiourea-capped nanoapatites amplify osmotic stress tolerance in Zea mays L. by conserving photosynthetic pigments, osmolytes biosynthesis and antioxidant biosystems. Molecules, 27(18), 5744. DOI 10.3390/molecules27185744. [Google Scholar] [CrossRef]
3. Carr, N. F., Boaretto, R. M., Mattos, J. D. (2020). Coffee seedlings growth under varied NO3−:NH4+ ratio: Consequences for nitrogen metabolism, amino acids profile, and regulation of plasma membrane H+-ATPase. Plant Physiology and Biochemistry, 154, 11–20. [Google Scholar]
4. Bennett, W. F. (1994). Plant nutrient utilization and diagnostic plant symptoms. In: Bennett, W. F. (Eds.Nutrient deficiency and toxicities in crop plants, pp. 1–7. USA: The American Phyto-pathological Society. [Google Scholar]
5. Navarro-León, E., Barrameda-Medina, Y., Lentini, M., Esposito, S., Ruiz, J. M. et al. (2016). Comparative study of Zn deficiency in L. sativa and B. oleracea plants: NH4+ assimilation and nitrogen derived protective compounds. Plant Science, 248, 8–16. [Google Scholar]
6. Zorb, C., Ludewig, U., Hawkesford, M. J. (2018). Perspective on wheat yield and quality with reduced nitrogen supply. Trends in Plant Science, 23(11), 1029–1037. [Google Scholar]
7. Wang, J., Hussain, S., Sun, X., Chen, X., Ma, Z. et al. (2022). Nitrogen application at a lower rate reduce net field global warming potential and greenhouse gas intensity in winter wheat grown in semi-arid region of the Loess Plateau. Field Crops Research, 280, 108475. DOI 10.1016/j.fcr.2022.108475. [Google Scholar] [CrossRef]
8. Umar, U. D, Ahmed, N., Zafar, M. Z., Rehman, A., Naqvi, S. A. H. et al. (2022). Micronutrients foliar and drench application mitigate mango sudden decline disorder and impact fruit yield. Agronomy, 12(10), 2449. DOI 10.3390/agronomy12102449. [Google Scholar] [CrossRef]
9. Wlese, M. V. (1994). Wheat and other small grains. In: Bennett, W. F. (Eds.Nutrient deficiency and toxicities in crop plants, pp. 27–33. USA: The American Phyto-pathological Society. [Google Scholar]
10. Zhong, Y., Xu, D., Hebelstrup, K. H., Yang, D., Cai, J. et al. (2018). Nitrogen topdressing timing modifies free amino acids profiles and storage protein gene expression in wheat grain. BMC Plant Biology, 18(1), 1–14. DOI 10.1186/s12870-018-1563-3. [Google Scholar] [CrossRef]
11. Zhang, K., Wang, X., Wang, X., Tahir Ata-Ul-Karim, S., Tian, Y. et al. (2020). Does the organ-based N dilution curve improve the predictions of N status in winter wheat? Agriculture, 10, 500. [Google Scholar]
12. Iqbal, M. A. (2015). An investigation into crops improved seed availability, snags and future prospect for Pakistan. American-Eurasian Journal of Agricultural and Environmental Sciences, 15(3), 308–314. [Google Scholar]
13. Passioura, J. (2006). Increasing crop productivity when water is scarce-from breeding to field management. Agricultural Water Management, 80(1–3), 176–196. DOI 10.1016/j.agwat.2005.07.012. [Google Scholar] [CrossRef]
14. Lihua, L. V., Yao, Y. R., Zhang, L. H., Dong, Z. Q., Jia, X. L. et al. (2013). Winter wheat grain yield and its components in the North China Plain: Irrigation management and cultivation climate. Chilean Journal of Agricultural Research, 73(3), 223–228. [Google Scholar]
15. Iqbal, M. A., Iqbal, A. (2015). A study on dwindling agricultural water availability in irrigated plains of Pakistan and drip irrigation as a future life-line. American-Eurasian Journal of Agricultural & Environmental Sciences, 15(2), 184–190. [Google Scholar]
16. Iqbal, M. A., Iqbal, A., Afzal, S., Akbar, N., Abbas, R. N. et al. (2015). In Pakistan, agricultural mechanization status and future prospects. American-Eurasian Journal of Agricultural & Environmental Sciences, 15(1), 122–128. [Google Scholar]
17. Ahmad, M., Ishaq, M., Shah, W. A., Adnan, M., Fahad, S. et al. (2022). Managing phosphorus availability from organic and inorganic sources for optimum wheat production in calcareous soils. Sustainability, 14, 7669. [Google Scholar]
18. Saini, A., Manuja, S., Kumar, S., Hafeez, A., Ali, B. et al. (2022). Impact of cultivation practices and varieties on productivity, profitability, and nutrient uptake of rice (Oryza sativa L.) and wheat (Triticum aestivum L.) cropping system in India. Agriculture, 12, 1678. [Google Scholar]
19. Jan, M. T., Shah, M., Khan, S. (2002). Type of N fertilizer rate and timing effect on wheat production. Sarhad Journal Agriculture, 18(4), 405–410. [Google Scholar]
20. Asif, M., Ali, A., Safdar, M. E., Maqsood, M., Hussain, S. et al. (2009). Growth and yield of wheat as influenced by different levels of irrigation and nitrogen. International Journal of Agriculture and Applied Sciences, 1, 25–28. [Google Scholar]
21. Chen, X., Ren, X., Hussain, S., Hussain, S., Saqib, M. (2020). Effects of elevated ammonia concentration on corn growth and grain yield under different nitrogen application rates. Journal of Soil Science and Plant Nutrition, 20(4), 1961–1968. DOI 10.1007/s42729-020-00267-1. [Google Scholar] [CrossRef]
22. Hameed, E., Shah, W. A., Shad, A. A., Bakht, J., Muhammad, T. (2003). Effect of different planting dates, seed rate and nitrogen levels on wheat. Asian Journal of Plant Sciences, 2(6), 467–474. DOI 10.3923/ajps.2003.467.474. [Google Scholar] [CrossRef]
23. Amjed, A., Ahmad, A., Syed, W. H., Khaliq, T., Asif, M. et al. (2011). Effects of N on growth and yield components of wheat. Biological Science, 23(4), 331–332. [Google Scholar]
24. Ali, A., Choudhry, M. A., Malik, M. A., Ahmad, R. (2000). Effect of various doses of nitrogen on the growth and yield of two wheat cultivar. Pakistan Journal of Biological Sciences, 3(6), 1004–1005. [Google Scholar]
25. Modheja, A., Naderib, A., Emamc, Y., Aynehbandd, A., Normohamadie, G. (2008). Effects of post-anthesis heat stress and nitrogen levels on grain yield in wheat (T. durum and T. aestivum) genotypes. International Journal of Plant Production, 2, 257–268. [Google Scholar]
26. Asif, M., Maqsood, M., Ali, A., Hassan, S. W., Hussain, A. et al. (2012). Growth, yield components and harvest index of wheat (Triticum aestivum L.) affected by different irrigation regimes and nitrogen management strategy. Science International, 24(2), 215–218. [Google Scholar]
27. Abid, M., Tian, Z., Karim, S. T. A., Cui, Y., Liu, Y. et al. (2016). Nitrogen nutrition improves the potential of wheat (Triticum aestivum L.) to alleviate the effects of drought stress during vegetative growth periods. Frontiers in Plant Science, 7, 981. [Google Scholar]
28. Mosanaei, H., Ajamnorozi, H., Dadashi, M. R., Faraji, A., Pessarakli, M. (2017). Improvement effect of nitrogen fertilizer and plant density on wheat (Triticum aestivum L.) seed deterioration and yield. Emirates Journal of Food and Agriculture, 29(11), 899–910. [Google Scholar]
29. Salam, A., Afridi, M. S., Javed, M. A., Saleem, A., Hafeez, A. et al. (2022). Nano-priming against abiotic stress: A way forward towards sustainable agriculture. Sustainability, 14, 14880. [Google Scholar]
30. Nelson, D., Sommers, L. E. (1983). Total carbon, organic carbon, and organic matter. In: Methods of soil analysis: Part 2 chemical and 442 microbiological properties, vol. 9, pp. 539–579. [Google Scholar]
31. Bremner, J., Mulvaney, C. (1982). Nitrogen-total. In: Klute, A., Page, A. L., Miller, R. H., Keeney, D. R. (Eds.Methods of soil analysis. Part 2. Chemical and microbiological properties, pp. 595–624. Madison, WI, USA: Soil Science Society of America. [Google Scholar]
32. Hunt, R. (1979). Plant growth analysis: The rationale behind the use of the fitted mathematical function. Annals of Botany, 43(2), 245–249. [Google Scholar]
33. Rafiq, M., Hussain, A., Ahmad, A., Basra, S. M. A., Shah, A. W. et al. (2005). Moisture stress effects on growth pattern of yield contributing factors in wheat (Triticum aestivum L.). International Journal of Biology and Biotechnology, 43(3), 189–210. [Google Scholar]
34. Salazar-Gutierreza, M. R., Johnsonb, J., Chaves-Cordobaa, B., Hoogenboom, G. (2013). Relationship of base temperature to development of winter wheat. International Journal of Plant Production, 7(4), 741–762. [Google Scholar]
35. American Association of Cereal Chemists (2000). Approved methods of analysis. St. Paul, Minnesota, USA. [Google Scholar]
36. Alina, T., Lazureanu, A. (2011). The influence of dose fertilizer on the qualitative corn hybrid Pr35P12. Journal of Horticulture, Forestry and Biotechnology, 15, 215–217. [Google Scholar]
37. Steel, R. G. D., Torrie, J. H., Dickey, D. H. (1997). Principles and procedures of statistics, a biometrical approach. 3rd editionNew York, USA. [Google Scholar]
38. Khan, F., Khan, S., Hussain, S., Fahad, S., Faisal, S. (2014). Different strategies for maintaining carbon sequestration in crop lands. Scientia Agriculturae, 2, 62–76. [Google Scholar]
39. Khan, F., Khan, S., Fahad, S., Faisal, S., Hussain, S. et al. (2014). Effect of different levels of nitrogen and phosphorus on the phenology and yield of maize varieties. American Journal of Plant Sciences, 5(17), 2582–2590. DOI 10.4236/ajps.2014.517272. [Google Scholar] [CrossRef]
40. Suge, H., Iwamura, H. (1993). Effect of cytokinin and anticytokinin on tillering of barley. Japanese Journal of Crop Science, 62(4), 595–600. DOI 10.1626/jcs.62.595. [Google Scholar] [CrossRef]
41. Liu, Y., Ding, Y. S., Wang, Q. S., Meng, D. X., Wang, S. H. (2011). Effects of nitrogen and 6 benzyl amino purine on rice tiller bud growth and changes in endogenous hormones and nitrogen. Crop Science, 51(2), 786–792. DOI 10.2135/cropsci2010.04.0217. [Google Scholar] [CrossRef]
42. Borras, L., Slafer, G. A., Otegui, M. E. (2004). Seed dry weight response to source-sink manipulations in wheat, maize and soybean: A quantitative reappraisal. Field Crops Research, 86(2–3), 131–146. DOI 10.1016/j.fcr.2003.08.002. [Google Scholar] [CrossRef]
43. Reynolds, M., Calderini, D., Condon, A., Vargas, M. (2007). Association of source/sink traits with yield, biomass and radiation use efficiency among random sister lines from three wheat crosses in a high yield environment. The Journal of Agricultural Science, 145(1), 3–16. DOI 10.1017/S0021859607006831. [Google Scholar] [CrossRef]
44. Foulkes, M. J., Slafer, G. A., Davies, W. J., Berry, P. M., Sylvester-Bradley, R. et al. (2011). Raising yield potential of wheat. III. Optimizing partitioning to grain while maintaining lodging resistance. Journal of Experimental Botany, 62(2), 469–486. DOI 10.1093/jxb/erq300. [Google Scholar] [CrossRef]
45. Pennell, A., Halloran, G. M. (1984). Influence of vernalization and photoperiod on supernumerary spikelet expression in wheat. Annals of Botany, 53(6), 821–831. DOI 10.1093/oxfordjournals.aob.a086752. [Google Scholar] [CrossRef]
46. Khan, N. U., Khan, A. A., Goheer, M. A., Shafique, I., Hussain, S. et al. (2021). Effect of zero and minimum tillage on cotton productivity and soil characteristics under different nitrogen application rates. Sustainability, 13(24), 13753. DOI 10.3390/su132413753. [Google Scholar] [CrossRef]
47. Nerson, H., Edelstein, M., Pinthus, M. J. (1990). Effects of N and P nutrition on spike development in spring wheat. Plant and Soil, 124(1), 33–37. DOI 10.1007/BF00010928. [Google Scholar] [CrossRef]
48. Peltonen, J. (1992). Ear developmental stage used for timing supplemental nitrogen application to spring wheat. Crop Science, 32(4), 1029–1033. DOI 10.2135/cropsci1992.0011183X003200040039x. [Google Scholar] [CrossRef]
49. Ewert, F., Honermeier, B. (1999). Spikelet initiation of winter triticale and winter wheat in response to nitrogen fertilization. European Journal of Agronomy, 11(2), 107–113. DOI 10.1016/S1161-0301(99)00023-4. [Google Scholar] [CrossRef]
50. Toyota, M., Tsutsui, I., Kusutani, A., Asanuma, K. (2001). Initiation and development of spikelets and florets in wheat as influenced by shading and nitrogen supply at the spikelet phase. Plant Production Science, 4(4), 283–290. DOI 10.1626/pps.4.283. [Google Scholar] [CrossRef]
51. Nakano, H., Morita, S., Kusuda, O. (2008). Effect of nitrogen application rate and timing on grain yield and protein content of the bread wheat cultivar ‘Minaminokaori’ in Southwestern Japan. Plant Production Science, 11(1), 151–157. DOI 10.1626/pps.11.151. [Google Scholar] [CrossRef]
52. Iqbal, A., Akbar, N., Khan, H. Z., Bakar, M. A. (2010). Influence of nitrogen fertilization on growth and yield of two wheat varieties. Crop Environment, 1(1), 57–58. [Google Scholar]
53. Leghari, S. J., Ahmed, N., Bhabhan, G. M., Hussain, K., Lashari, A. A. et al. (2016). Role of nitrogen for plant growth and development: A review. Advances in Environmental Biology, 10(9), 209–218. [Google Scholar]
54. Sadeghi, H., Kazemeini, A. R. (2011). Effect of crop residue management and nitrogen fertilizer on grain yield and yield components of two barley cultivars under dry land conditions. Iranian Journal of Crop Science, 13(3), 436–451. [Google Scholar]
55. Baethgen, W. E., Christianson, C. B., Lamothe, A. G. (1995). Nitrogen fertilizer effects on growth, grain yield, and yield components of malting barley. Field Crops Research, 43(2–3), 87–99. DOI 10.1016/0378-4290(95)00034-N. [Google Scholar] [CrossRef]
56. Fischer, R. A., Stapper, M. (1987). Lodging effects on high-yielding crops of irrigated semi dwarf wheat. Field Crops Research, 17(3–4), 245–258. DOI 10.1016/0378-4290(87)90038-4. [Google Scholar] [CrossRef]
57. Berry, P. M., Spink, J. (2012). Predicting yield losses caused by lodging in wheat. Field Crops Research, 137, 19–26. DOI 10.1016/j.fcr.2012.07.019. [Google Scholar] [CrossRef]
58. Kozlovsky, O., Balik, J., Cerny, J., Kulhanek, M., Kos, M. et al. (2009). Influence of nitrogen fertilizer injection (CULTAN) on yield, yield components formation and quality of winter wheat grain. Plant Soil and Environment, 55(12), 536–543. [Google Scholar]
59. Benjamín Ramírez, W., Félix, F. R., Torres-Chávez, P. I., Medina-Rodríguez, C. L., Matus Barba, E. A. et al. (2014). Effects of nitrogen and irrigation on gluten protein composition and their relationship to “yellow berry” disorder in wheat (Triticum aestivum). Pakistan Journal of Botany, 46(5), 1797–1804. [Google Scholar]
60. Sohail, M., Hussain, I., Tanveer, S. K., Abbas, S. H., Qamar, M. et al. (2018). Effect of nitrogen fertilizer application methods on wheat yield and quality. Science, Technology and Development, 37(2), 89–92. [Google Scholar]
61. Weber, E. A., Graeff, S., Koller, W. D., Hermann, W., Merkt, N. et al. (2008). Impact of nitrogen amount and timing on the potential of acrylamide formation in winter wheat (Triticum aestivum L.). Field Crops Research, 106, 44–52. [Google Scholar]
62. Zorb, C., Grover, C., Steinfurth, D., Muhling, K. H. (2010). Quantitative proteome analysis of wheat gluten as influenced by N and S nutrition. Plant and Soil, 327, 225–234. [Google Scholar]
63. Aasfar, A., Bargaz, A., Yaakoubi, K., Hilali, A., Bennis, I. et al. (2021). Nitrogen fixing Azotobacter species as potential soil biological enhancers for crop nutrition and yield stability. Frontiers in Microbiology, 12, 354. DOI 10.3389/fmicb.2021.628379. [Google Scholar] [CrossRef]
64. El-Naggar, M. E., Abdelsalam, N. R., Fouda, M. M. G., Mackled, M. I., Al-Jaddadi, M. A. M. et al. (2020). Soil application of nano silica on maize yield and its insecticidal activity against some stored insects after the post-harvest. Nanomaterials, 10(4), 739. DOI 10.3390/nano10040739. [Google Scholar] [CrossRef]
65. Shahid, M., Mohammad, F., Tahir, M. (2002). Path coefficient analysis in wheat. Sarhad Journal of Agriculture, 18(4), 383–388. [Google Scholar]
66. Sharifi, R. S., Namvar, A., Sharifi, R. S. (2017). Grain filling and fatty acid composition of safflower fertilized with integrated nitrogen fertilizer and biofertilizers. Pesquisa Agropecuária Brasileira, 52(4), 236–243. DOI 10.1590/s0100-204x2017000400003. [Google Scholar] [CrossRef]
67. El-Sorady, G. A., El-Banna, A. A., Abdelghany, A. M., Salama, E. A., Ali, H. M. et al. (2022). Response of bread wheat cultivars inoculated with azotobacter species under different nitrogen application rates. Sustainability, 14(14), 8394. DOI 10.3390/su14148394. [Google Scholar] [CrossRef]
68. Abdelsalam, N. R., Kandil, E. E., Al-Msari, M. A., Al-Jaddadi, M. A., Ali, H. M. et al. (2019). Effect of foliar application of NPK nanoparticle fertilization on yield and genotoxicity in wheat (Triticum aestivum L.). Science of the Total Environment, 653, 1128–1139. [Google Scholar]
69. Al-Nemi, R., Makki, A. A., Sawalha, K., Hajjar, D., Jaremko, M. J. M. (2022). Untargeted metabolomic profiling and antioxidant capacities of different solvent crude extracts of Ephedra foeminea. Metabolites, 12(5), 451. [Google Scholar]
Cite This Article
 Copyright © 2023 The Author(s). Published by Tech Science Press.
This work is licensed under a Creative Commons Attribution 4.0 International License , which permits unrestricted use, distribution, and reproduction in any medium, provided the original work is properly cited.
 Downloads
 Citation Tools