
 Submit a Paper
 Propose a Special lssue
 Open Access
ARTICLE

Limitation of RGB-Derived Vegetation Indices Using UAV Imagery for Biomass Estimation during Buckwheat Flowering
1 Department of Plant Resources and Environment, Jeju National University, Jeju, 63243, Republic of Korea
2 Multimedia Communications Laboratory, University of Information Technology, Ho Chi Minh City, 700000, Vietnam
3 Vietnam National University, Ho Chi Minh City, 700000, Vietnam
4 Faculty of Biology—Biotechnology, University of Science, Ho Chi Minh City, 700000, Vietnam
5 Department of Biotechnology, Faculty of Science, Mersin University, Yenişehir, Mersin, 33343, Türkiye
6 Department of Smart Farm Engineering, College of Industrial Sciences, Kongju National University, Yesan-gun, 32439, Republic of Korea
* Corresponding Authors: Yong Suk Chung. Email: ; Dong-Wook Kim. Email:
# These authors contributed equally to this work
(This article belongs to the Special Issue: Application of Digital Agriculture and Machine Learning Technologies in Crop Production)
Phyton-International Journal of Experimental Botany 2025, 94(7), 2215-2228. https://doi.org/10.32604/phyton.2025.067439
Received 03 May 2025; Accepted 30 June 2025; Issue published 31 July 2025
 View Full Text
 Download PDF
Abstract
Accurate and timely estimation of above-ground biomass is crucial for understanding crop growth dynamics, optimizing agricultural input management, and assessing productivity in sustainable farming practices. However, conventional biomass assessments are destructive and resource-intensive. In contrast, remote sensing techniques, particularly those utilizing low-altitude unmanned aerial vehicles, provide a non-destructive approach to collect imagery data on plant canopy features, including spectral reflectance and structural details at any stage of the crop life cycle. This study explores the potential visible-light-derived vegetative indices to improve biomass prediction during the flowering period of buckwheat (Fagopyrum tataricum). Red, green, and blue (RGB) images of buckwheat were acquired during peak flowering, using a DJI P4 multispectral Drone. From the analysis of those images, four vegetative indices were calculated. Aboveground fresh biomass was harvested and measured on 14 September 2024. The results showed negative correlations between the green-band based excess green (ExG), excess green minus excess red (ExGR), and green leaf index (GLI) indices and the fresh above-ground biomass of buckwheat, while the red band-based excess red (ExR) index showed an insignificant positive correlation at p < 0.10. An investigation into green-band-based vegetation indices (VIs) for estimating fresh biomass revealed significant negative correlations during the experimental period. This unexpected inverse relationship is attributed to spectral interference from abundant white flowers during the flowering stage, where the high reflectance of white petals masked the green vegetation signal. Consequently, these green-band VIs demonstrated limited predictive power for biomass under such conditions, indicating that their utility is compromised when floral reflectance is dominant. Therefore, we suggest that further experiments are required to validate this relationship and improve the estimation of fresh above-ground biomass in white-flowered buckwheat plants.Keywords
In the context of sustainable agriculture, estimating aboveground biomass (AGB) of plants is critical for understanding crop growth, optimizing field management, and assessing productivity [1]. AGB is an essential agroecological trait employed to evaluate crop development and measure biomass carbon reserves in agricultural environments [2]. Traditional methods of biomass estimation are labor-intensive and time-consuming, often limiting their feasibility for large-scale monitoring [3,4]. Remote and proximal sensing approaches enable non-destructive data collecting on plant canopy features, such as spectral reflectance and architecture details [5]. Hence, these methods have the potential to estimate AGB dynamics in field settings.
Unmanned aerial vehicles (UAVs), commonly known as drones, serve as versatile remote sensing tools that can be programmed to fly over agricultural fields at designated times, providing frequent and systematic monitoring of crops and environmental conditions. These UAVs are equipped with high-resolution cameras and multispectral sensors that capture detailed imagery, facilitating the collection of data on crop health, growth patterns, and stress factors over time. The ability to perform repeated surveys allows farmers and researchers to track changes and make timely management decisions, enhancing productivity and sustainability [6].
One of the key advantages of UAV-based remote sensing is its high spatial resolution, which exceeds that of traditional satellite imagery, enabling precise identification of individual plant stress and variability within fields. Additionally, their relative affordability and ease of deployment make UAVs an attractive option for small to large-scale agricultural operations, significantly reducing costs associated with traditional aerial surveying or ground-based inspections. Recent advancements in UAV technology and remote sensing sensors have further expanded their capabilities. Notably, the integration of multispectral and hyperspectral sensors has enabled more accurate and efficient estimation of biomass and crop yield potential. Vegetation indices (VIs), derived from multi-band imagery—such as the NDVI (Normalized Difference Vegetation Index)—are now widely used to assess plant vigor, chlorophyll content, and biomass. These indices facilitate early detection of diseases, nutrient deficiencies, and water stress, ultimately supporting precision agriculture practices [7].
VIs leverage spectral bands from either the visible spectrum or extended regions, including the red-edge, near-infrared, and short-wave infrared, to assess plant health and chlorophyll content. This capability makes them indispensable tools for biomass estimation [8–10]. VIs, derived from spectral reflectance data, capture information about canopy structure, vegetation health, and photosynthetic activity, which provides insights for non-invasive biomass evaluation [11,12]. In 2016, Wang Li and his group emphasizes the role of VIs derived from UAV imagery in estimating maize AGB. Their outcome concluded that spectral VIs, calculated from high-resolution UAV images, can effectively reflect biomass variability when integral into the AGB estimation models [13]. They highlighted the importance of integrating spectral data with structural features to enhance the accuracy of biomass estimation.
UAV-captured RGB imagery is reliable in biomass estimations and provides valuable guidance for precision agriculture practices. Several scholars have discussed the potential of UAV-based RGB image data in constructing accurate and efficient biomass estimation models. By integrating VIs based on visual spectrum and texture features, UAV-derived models offer a significant improvement over traditional methods, enabling real-time and scalable monitoring of crop growth. Mian et al. [2] used UAV-mounted RGB images to estimate wheat biomass across different growth stages, developing models that combined vegetation indices (VIs) and texture features, which showed the strongest correlation with biomass. Similarly, Biswal et al. [14] demonstrated that integrating spectral and texture data from UAV multispectral images significantly improves aboveground biomass (AGB) estimation in paddy crops, effectively addressing challenges like dense canopies and background interference for more reliable crop monitoring.
RGB-based vegetation indices (VIs) offer a cost-effective, accessible, and less complex alternative to multispectral VIs for biomass estimation. Unlike multispectral sensors, which entail costly equipment and specialized data processing, RGB sensors are widely available and easier to operate [15,16]. Previous research has demonstrated the potential of RGB-derived VIs in estimating biomass across various crops, with studies showing high correlations between RGB-based indices and crop biomass—for example, R2 values between 0.62 and 0.73 for maize and other crops [17]. Other studies have shown the effectiveness of UAV-based RGB imagery in estimating crop height through digital surface models (DSM), illustrating its potential for biomass assessment. Furthermore, research has demonstrated that RGB-derived vegetation indices, such as RGBVI, GLI, VARI, and NGRDI, can reliably predict forage yield, with significant correlations observed [18,19]. These findings underscore the value of RGB imaging as a practical and cost-effective tool for biomass estimation and crop monitoring in precision agriculture [20].
VIs have been extensively applied in major crops such as wheat and maize; however, the potential of RGB based VIs to predict biomass in crops like buckwheat remains underexplored. As a multi food-use pseudo-cereal crop with exceptional nutritional, medicinal, and functional properties, buckwheat gains significant popularity among common cereals [21–23]. It offers distinct agronomic advantages due to its short life cycle of approximately 90 days, rapid growth, and nutrient-conserving characteristics [24,25]. Buckwheat’s versatile traits allow it to be cultivated not only as a staple grain but also as a cover crop, smother crop, fertility-restoring crop, and stubble crop, promoting sustainable agriculture [24,26]. Its above-ground biomass (AGB) is valued beyond its seeds, which are a popular gluten-free food source—its foliage is consumed as a leafy vegetable or dried as tea [27,28]. The biomass is also used for various purposes such as forage, green manure, land reclamation, and mulch. Additionally, buckwheat leaves and seeds are rich in bioactive compounds like fagopyrin and rutin, making them valuable for extraction processes. Due to its multifunctionality and economic significance, buckwheat has attracted increased research interest. Current studies aim to enhance its agronomic traits, increase yield, improve stress resistance, and optimize cultivation practices [29]. Thus, estimating buckwheat biomass is crucial for informed crop management decisions, because multiple factors, including sowing time, irrigation, nutrient supply, growth stage, and plant density, which influence biomass production, should be monitored [28,30–32]. Previous studies have identified the critical period for yield determination in common buckwheat as spanning from the first open flowers to the first brown fruit stages [33]. Despite the importance of accurately estimating buckwheat biomass, research on non-destructive methods during its flowering stage remains scarce. This study aims to evaluate the effectiveness of four UAV-derived RGB vegetation indices—Excess Green (ExG), Excess Red (ExR), Excess Green-Red (ExGR), and Green Leaf Index (GLI)—for predicting above-ground biomass (AGB) in buckwheat during flowering. Due to limited understanding of reflectance patterns at this stage, the focus is on identifying potential trends and limitations rather than testing a specific hypothesis. These indices enhance vegetation contrast by emphasizing green reflectance and suppressing red and blue, making them valuable for remote sensing applications [34]. Although not universally standardized, previous studies have shown that such indices are effective for biomass estimation, highlighting their potential in low-cost remote sensing techniques used in precision agriculture and high-throughput phenotyping [16,35]. The goal is to improve our understanding of canopy dynamics and biomass accumulation during this critical growth phase, providing insights to optimize buckwheat cultivation and management strategies. We also assess whether these indices sustain their predictive power under flowering conditions, contributing to more reliable biomass estimation methods.
2.1 Acquisition of Aerial Images
Tartary buckwheat (Fagopyrum tataricum) was cultivated in the open field located at 126.33° E longitude and 33.72° N Latitude within Jeju National University, Aradong, Jeju City, Jeju Self-Governing Province, Republic of Korea during the growing season in 2024 (June to July) (Fig. 1). As the study aimed to explore vegetation index responses during the flowering phase, the experiment was designed to capture canopy-level variation under natural field conditions without imposing controlled treatments. During the peak flowering period of buckwheat, UAV images were collected on 13 August 2024, using a DJI Phantom 4 Multispectral drone equipped with six 1/2.9″ CMOS sensors, including an RGB sensor (model FC6360_5.7_1600x1300, DJI, Germany). The drone operated automatically, following predefined waypoints via the DJI GO Pro app (SZ DJI Technology Co., Ltd., Shenzhen, China), with settings set to an ISO value of 400 and automatic white balance [36,37]. The flights took place between 11:30 a.m. and 12:30 p.m. under sunny, low-wind conditions. The drone flew at a height of 10 m, with a speed of 2.0 m/s, and maintained a forward overlap of 60% and a side overlap of 50%. A radiation correction target plate (Type 882 Synthetic Tarpulin woven polyester fabric, Group 8 Technology, Provo, UT, USA) was included in the images for radiometric calibration. To ensure accurate geo-referencing, 21 ground control points (GCPs), consisting of 21.0 cm by 14.8 cm white paper sheets, were strategically placed across the study area (see Fig. 2). The RGB images obtained from the sensor were saved in JPG format for subsequent analysis.
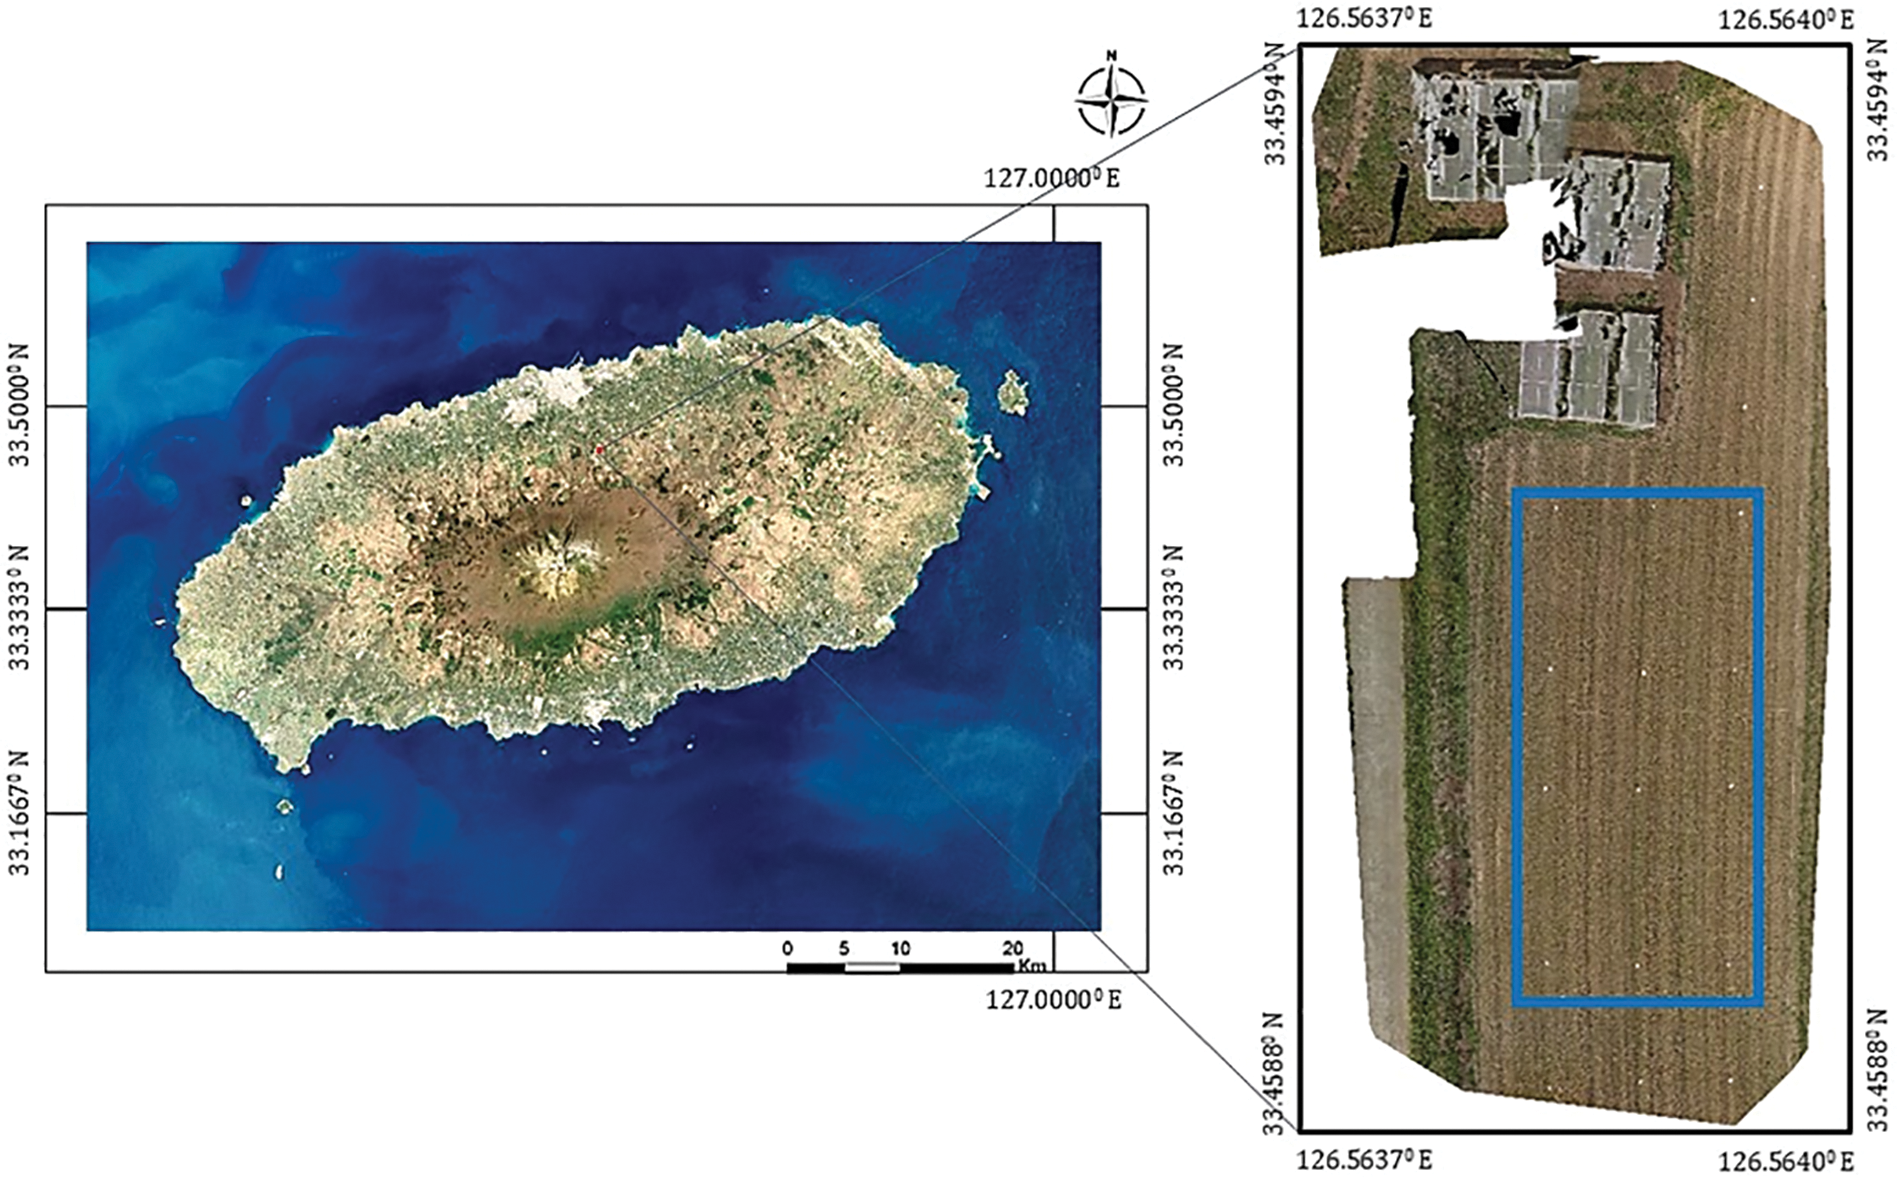
Figure 1: The location of the experimental site and the overview of the buckwheat field created using images obtained by a UAV remote sensing platform
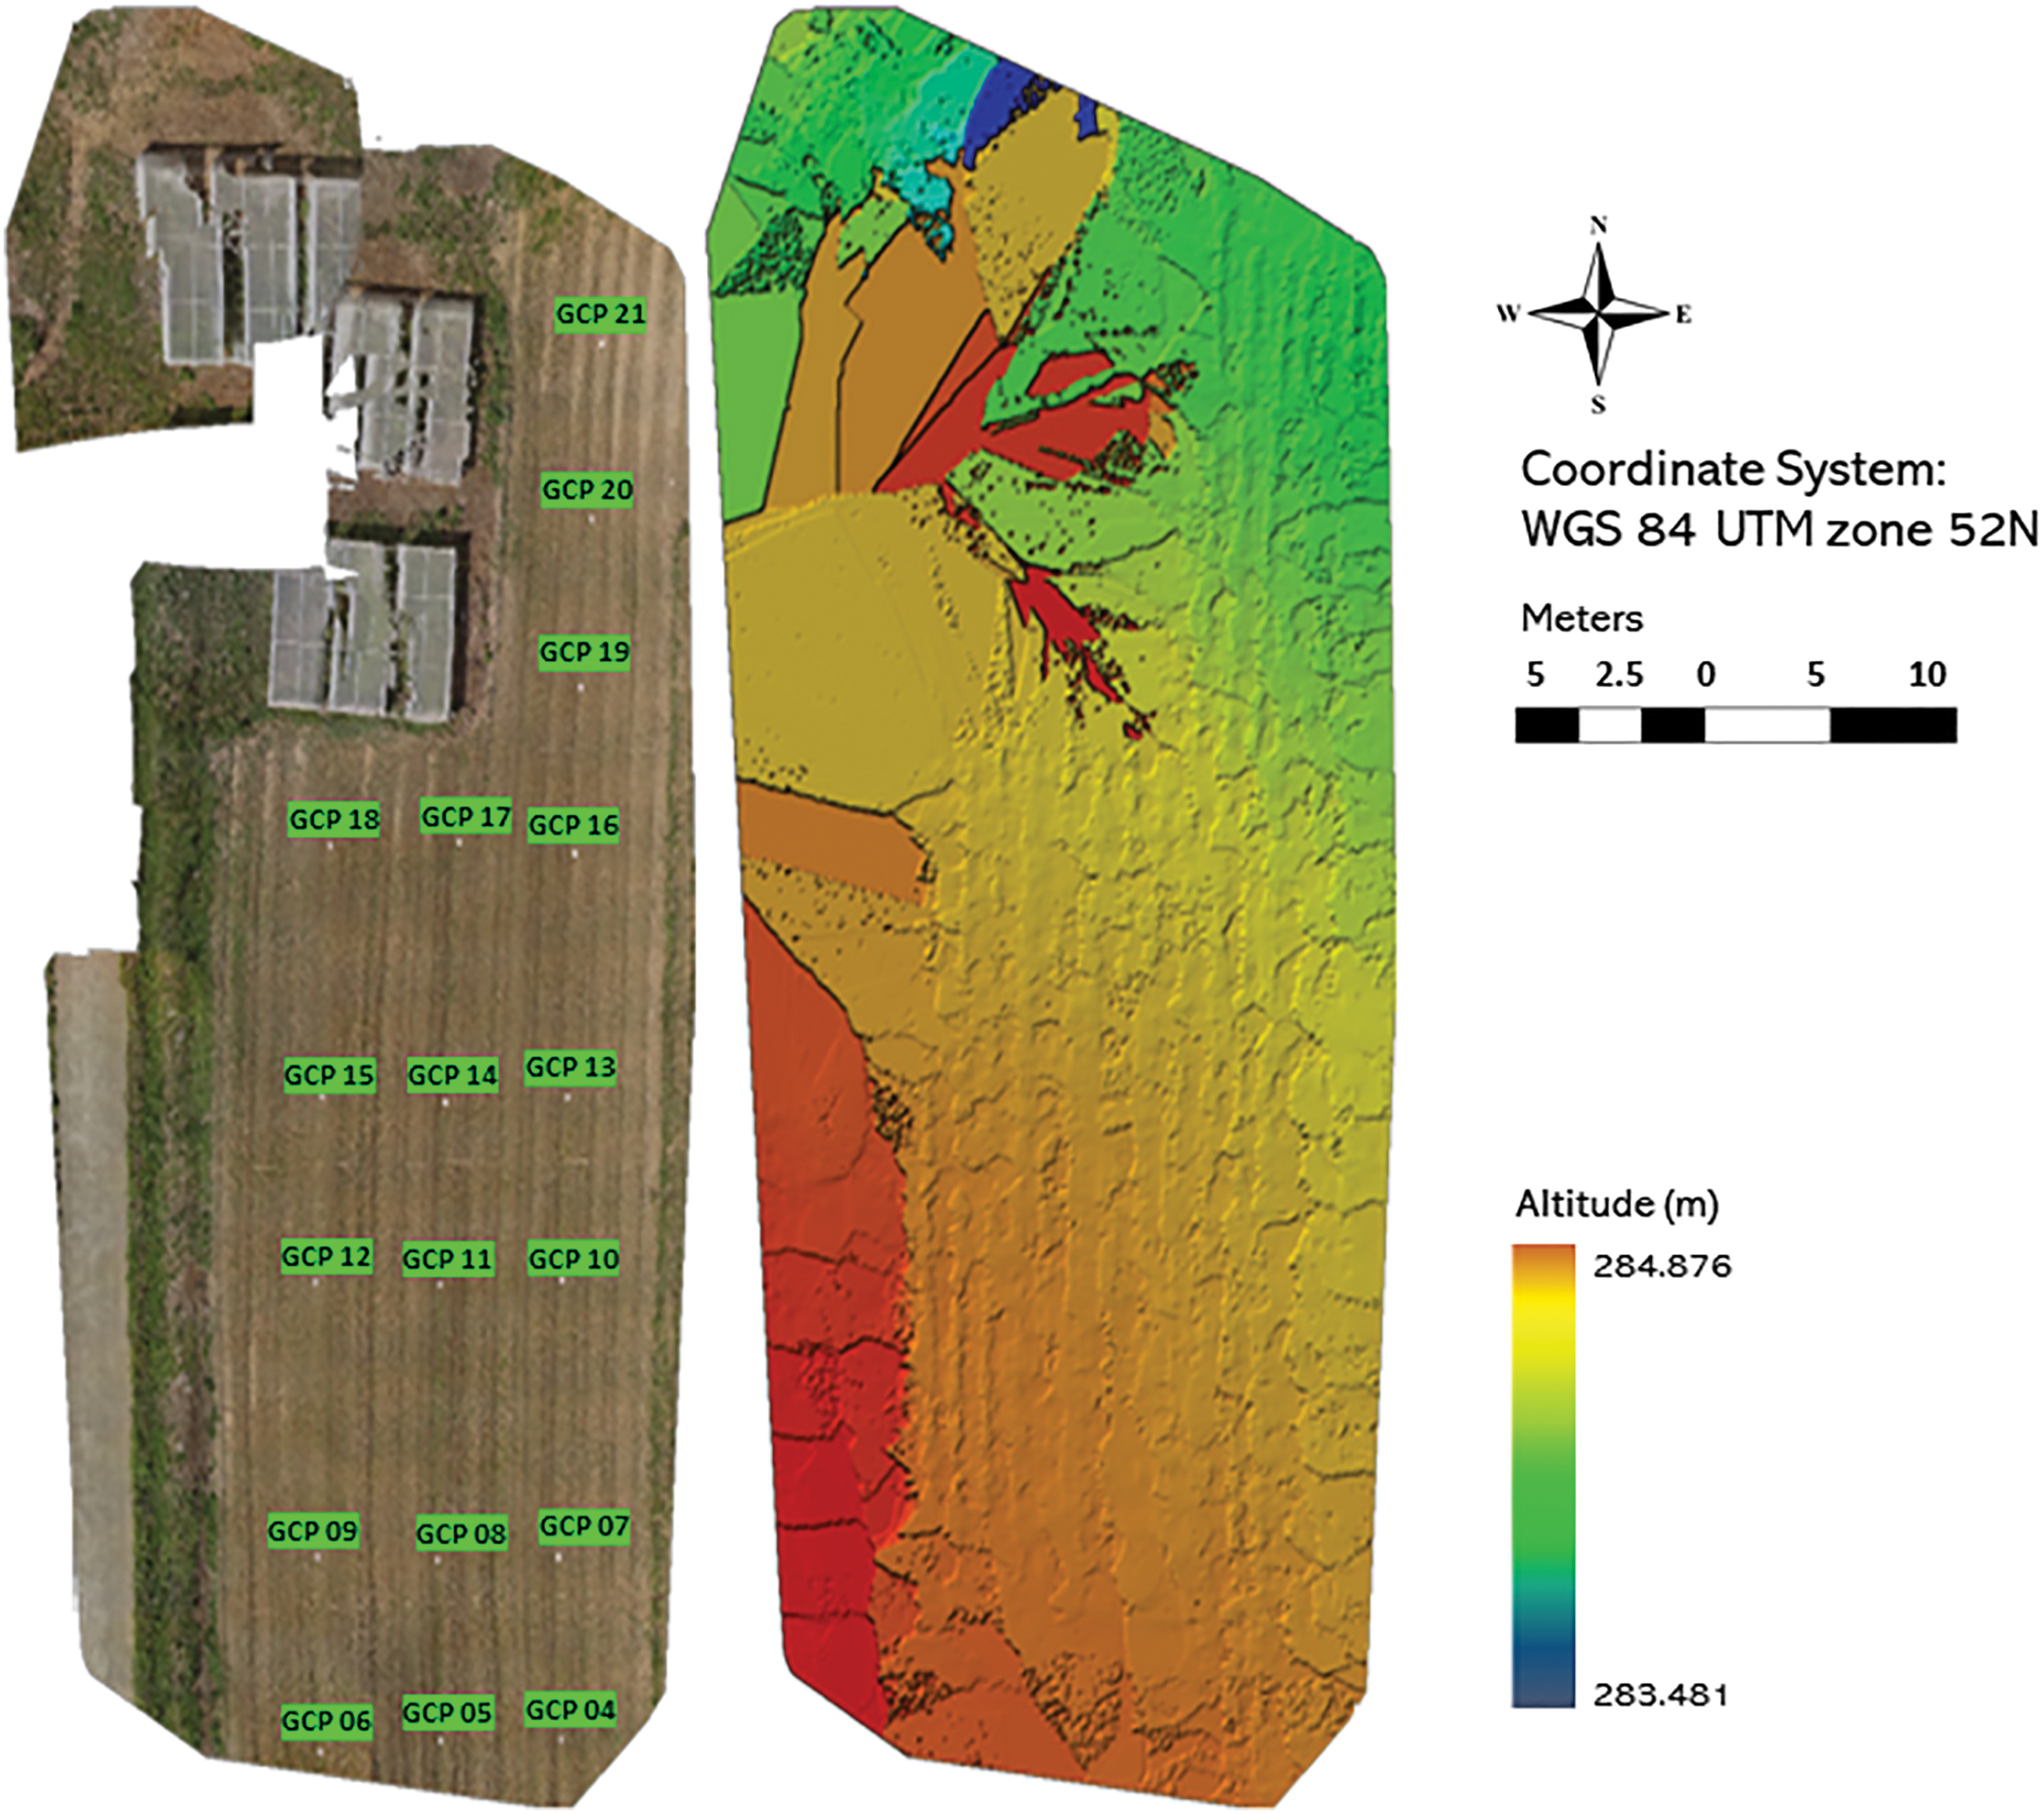
Figure 2: Orthomosaic image with ground control points and the corresponding sparse digital surface model (DSM)
The collected UAV images were processed using a semi-automated workflow in Pix4Dmapper Pro version 3.0.17 (Pix4D SA, Lausanne, Switzerland), which facilitated the generation of orthomosaics and digital surface models (DSM) (see Fig. 2). The orthomosaics provided detailed RGB color data, while the DSMs contained elevation information crucial for analyses such as biomass estimation and canopy structure assessment. The processing workflow commenced with the ‘Initial Processing’ phase, during which key points across the overlapping images were identified based on geometric similarities. This step enabled the software to align the images accurately and estimate the positions and orientations of the camera at the time of capture (illustrated in Fig. 3). To improve the precision of georeferencing, ground control points (GCPs) collected using real-time kinematic (RTK) GPS were imported into Pix4D. These GCPs were manually located within the images and matched with their exact physical locations, allowing for better spatial accuracy and correction of lens distortions.
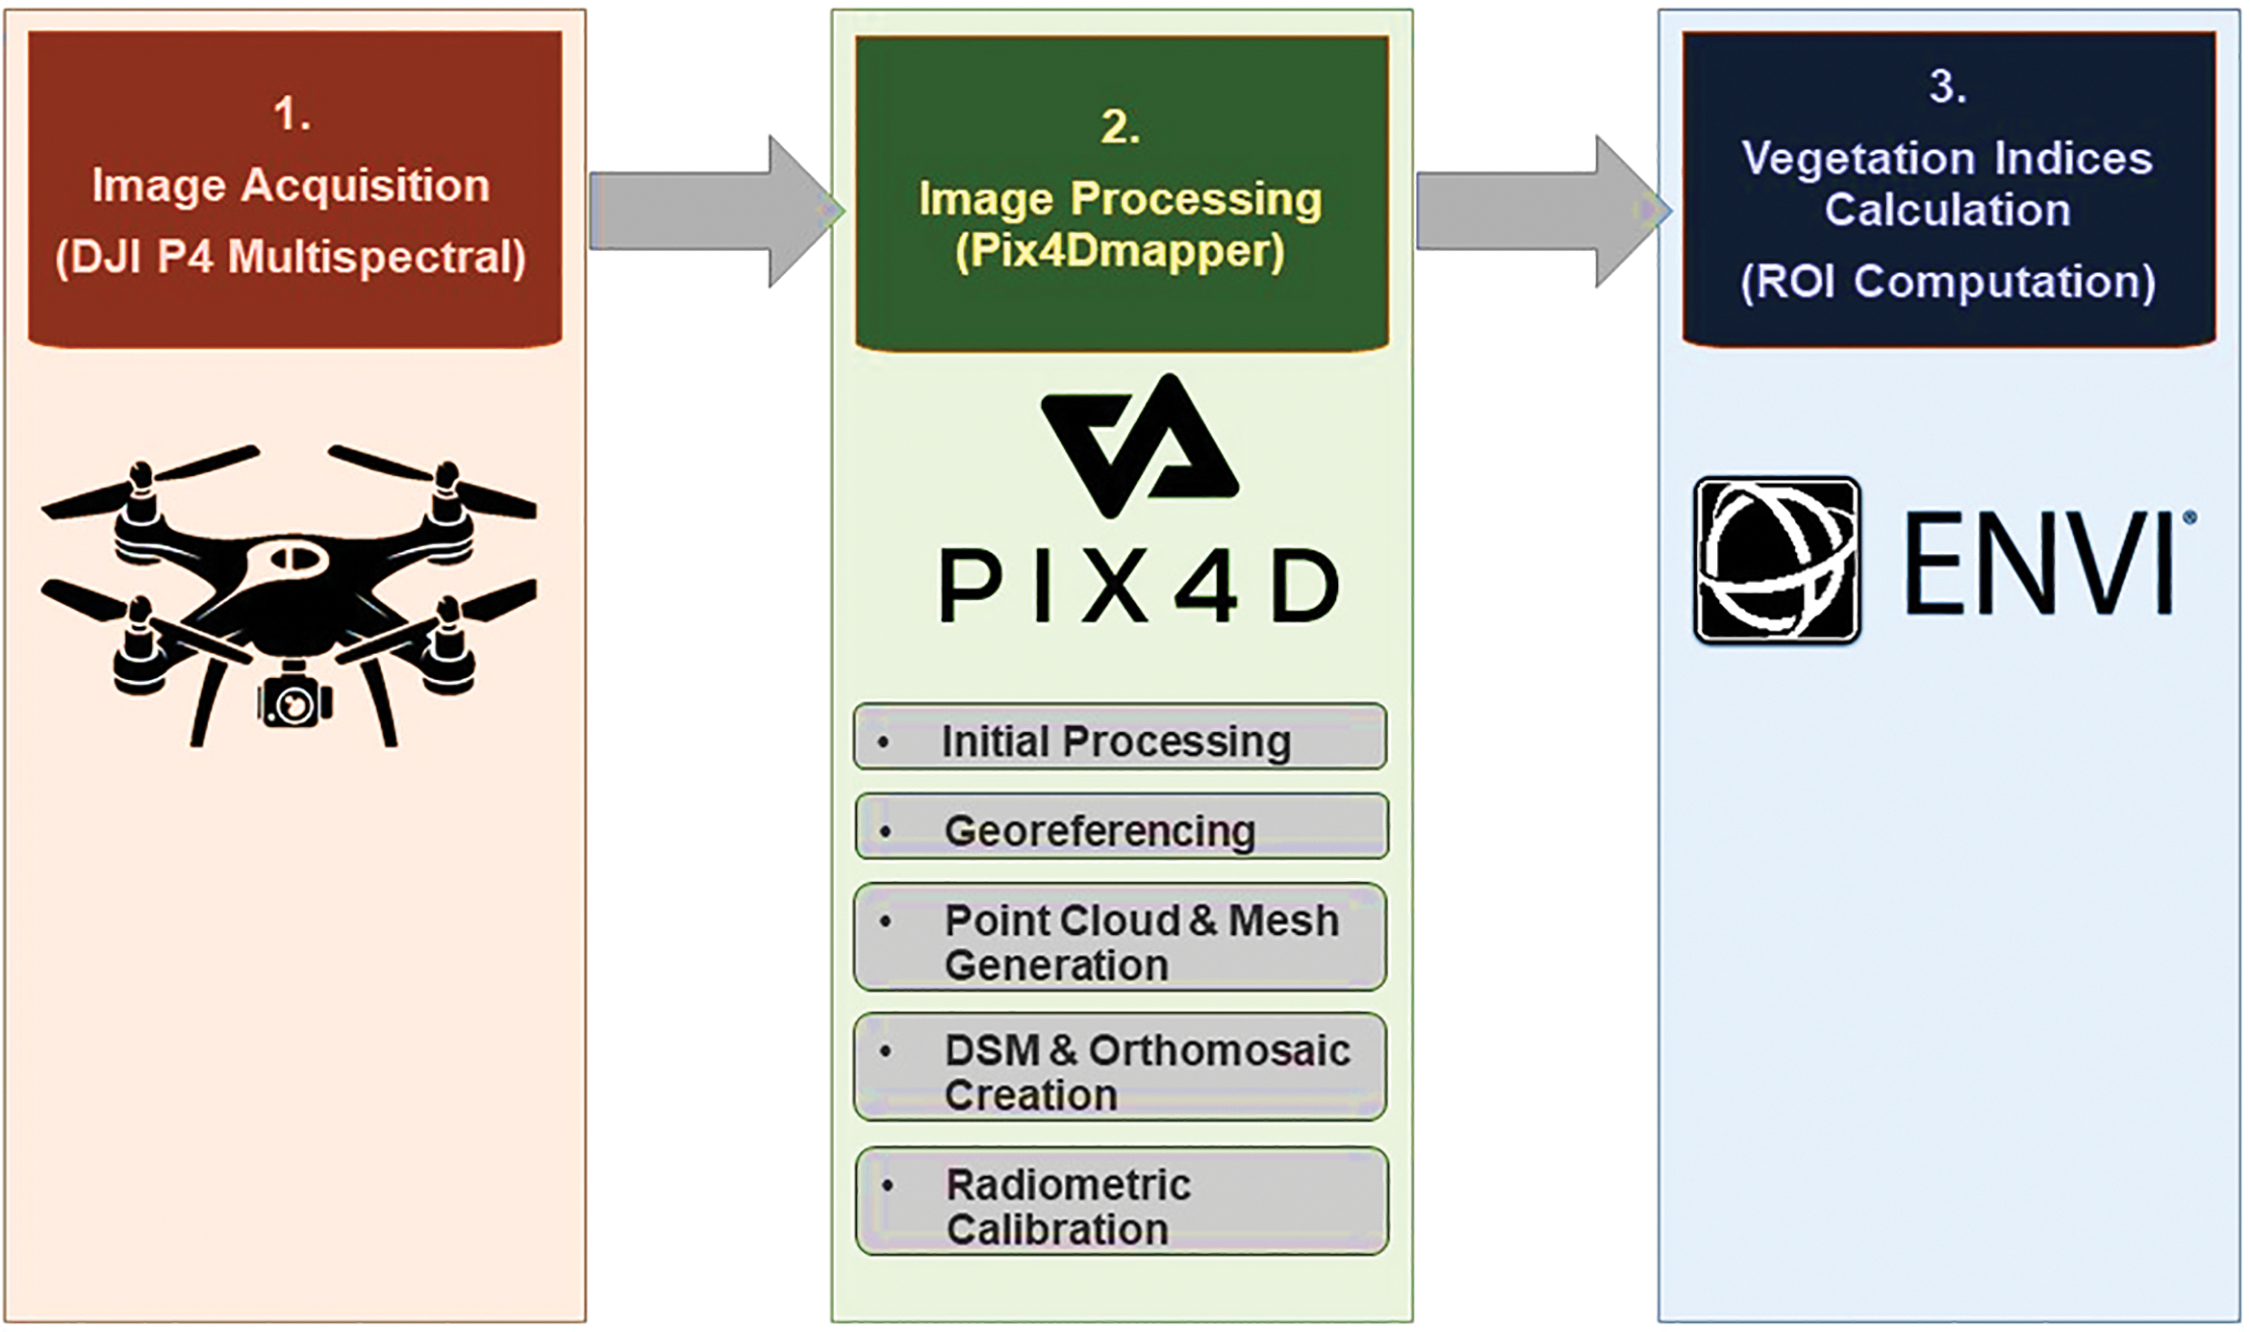
Figure 3: Three major steps of image analysis used in the study: (1) Image acquisition using a DJI Phantom 4 Multispectral UAV during peak flowering of buckwheat; (2) Image processing in Pix4Dmapper software; and (3) Region of interest (ROI) computation for Vegetation index (VI) calculation using ENVI software to extract plot-level spectral information
Following this, the ‘Point Cloud and Mesh’ step involved constructing a dense three-dimensional point cloud through a structure-from-motion (SfM) algorithm, which integrated the key points extracted from the aligned images. This dense point cloud represented the 3D structure of the terrain and vegetation. The point cloud was then interpolated to produce a detailed 3D mesh, providing a continuous surface model. In the final ‘DSM, Orthomosaic, and Index’ phase, the 3D mesh was accurately placed within the real-world coordinate system, with the Image Coordinate System specified as WGS84 (egm2008) and the output coordinate system as WGS84/UTM zone 52N (egm2008). This step involved calculating elevation data to produce the DSM, which serves as a foundational layer for further spatial analysis.
The orthomosaic was generated by orthorectifying and resampling the aerial imagery onto the three-dimensional surface model, with RGB pixel values incorporated to produce a georeferenced, geometrically corrected, and visually accurate representation of the study field. Both the digital surface model (DSM) and orthomosaic were exported in GeoTIFF format, preserving essential geographic metadata for precise spatial referencing. To correct for radiometric variations caused by fluctuations in illumination and atmospheric conditions during image acquisition, radiometric calibration was conducted utilizing the empirical line method [20,38]. A calibration target, consisting of four surfaces with known reflectance values (3%, 12%, 36%, and 56%), was positioned within the UAV flight path to be captured concurrently with the imagery. The digital number (DN) values originating from the respective red, green, and blue spectral bands of these targets were extracted from the orthomosaic using ENVI software (L3 HARRIS Geospatial, USA). These DN readings were modeled against the known reflectance values—obtained from the sensor’s calibration data provided by the manufacturer [39]—via an exponential regression equation (Eq. (1)), enabling the conversion of DN values to surface reflectance for all image pixels.
where
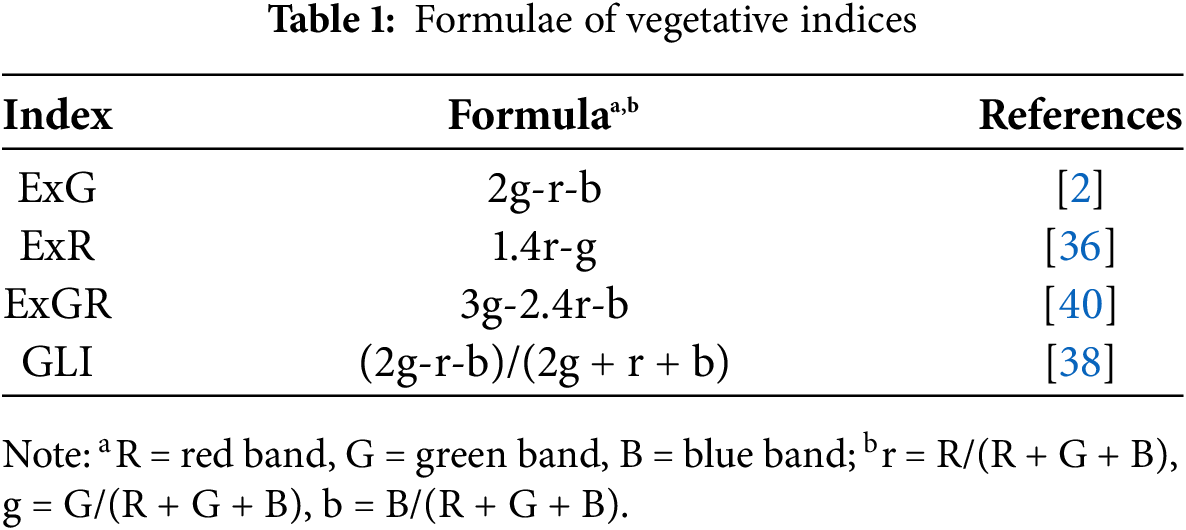
Vegetation indices (VIs) were computed from the spectral band raster data, including metrics such as Excess Green (ExG), Excess Green minus Excess Red (ExGR), Excess Red (ExR), and Green Leaf Index (GLI) (see Table 1). These indices were selected based on their proven effectiveness in biomass estimation in prior studies. The region of interest (ROI) for each plot was delineated, and the VI values within each ROI were segmented accordingly. The mean pixel values of the indices were then calculated for each plot to provide representative measurements for subsequent analysis.
Buckwheat has a short life cycle of approximately 70 to 90 days, making it a fast-growing crop. Flowering begins 30–40 days after sowing, with the highest biomass accumulation occurring at 35–45 days of growth [25,41,42]. Therefore, based on the VI maps, 14 sampling plots (50 cm × 50 cm) representing high, moderate and low VI values were selected from the sampling area (Fig. 4) and on 14 September 2024, the buckwheat plants in these plots were harvested by cutting the entire above-ground portion of the plant as close to the soil surface as possible. Their fresh AGB was measured as fresh weight, without drying or moisture correction, using a precision balance (Kern PCB precision balance, Model Z674710-1EA: Kern PCB-200-2, weighing capacity: 200 g, resolution: 0.01 g, linearity: ±0.02 g). While this approach provided a practical basis for validation, we acknowledge that the sample size (n = 14) was limited, which may constrain the statistical power of the findings. Future studies should incorporate replicated plots and expanded sampling to improve statistical robustness.
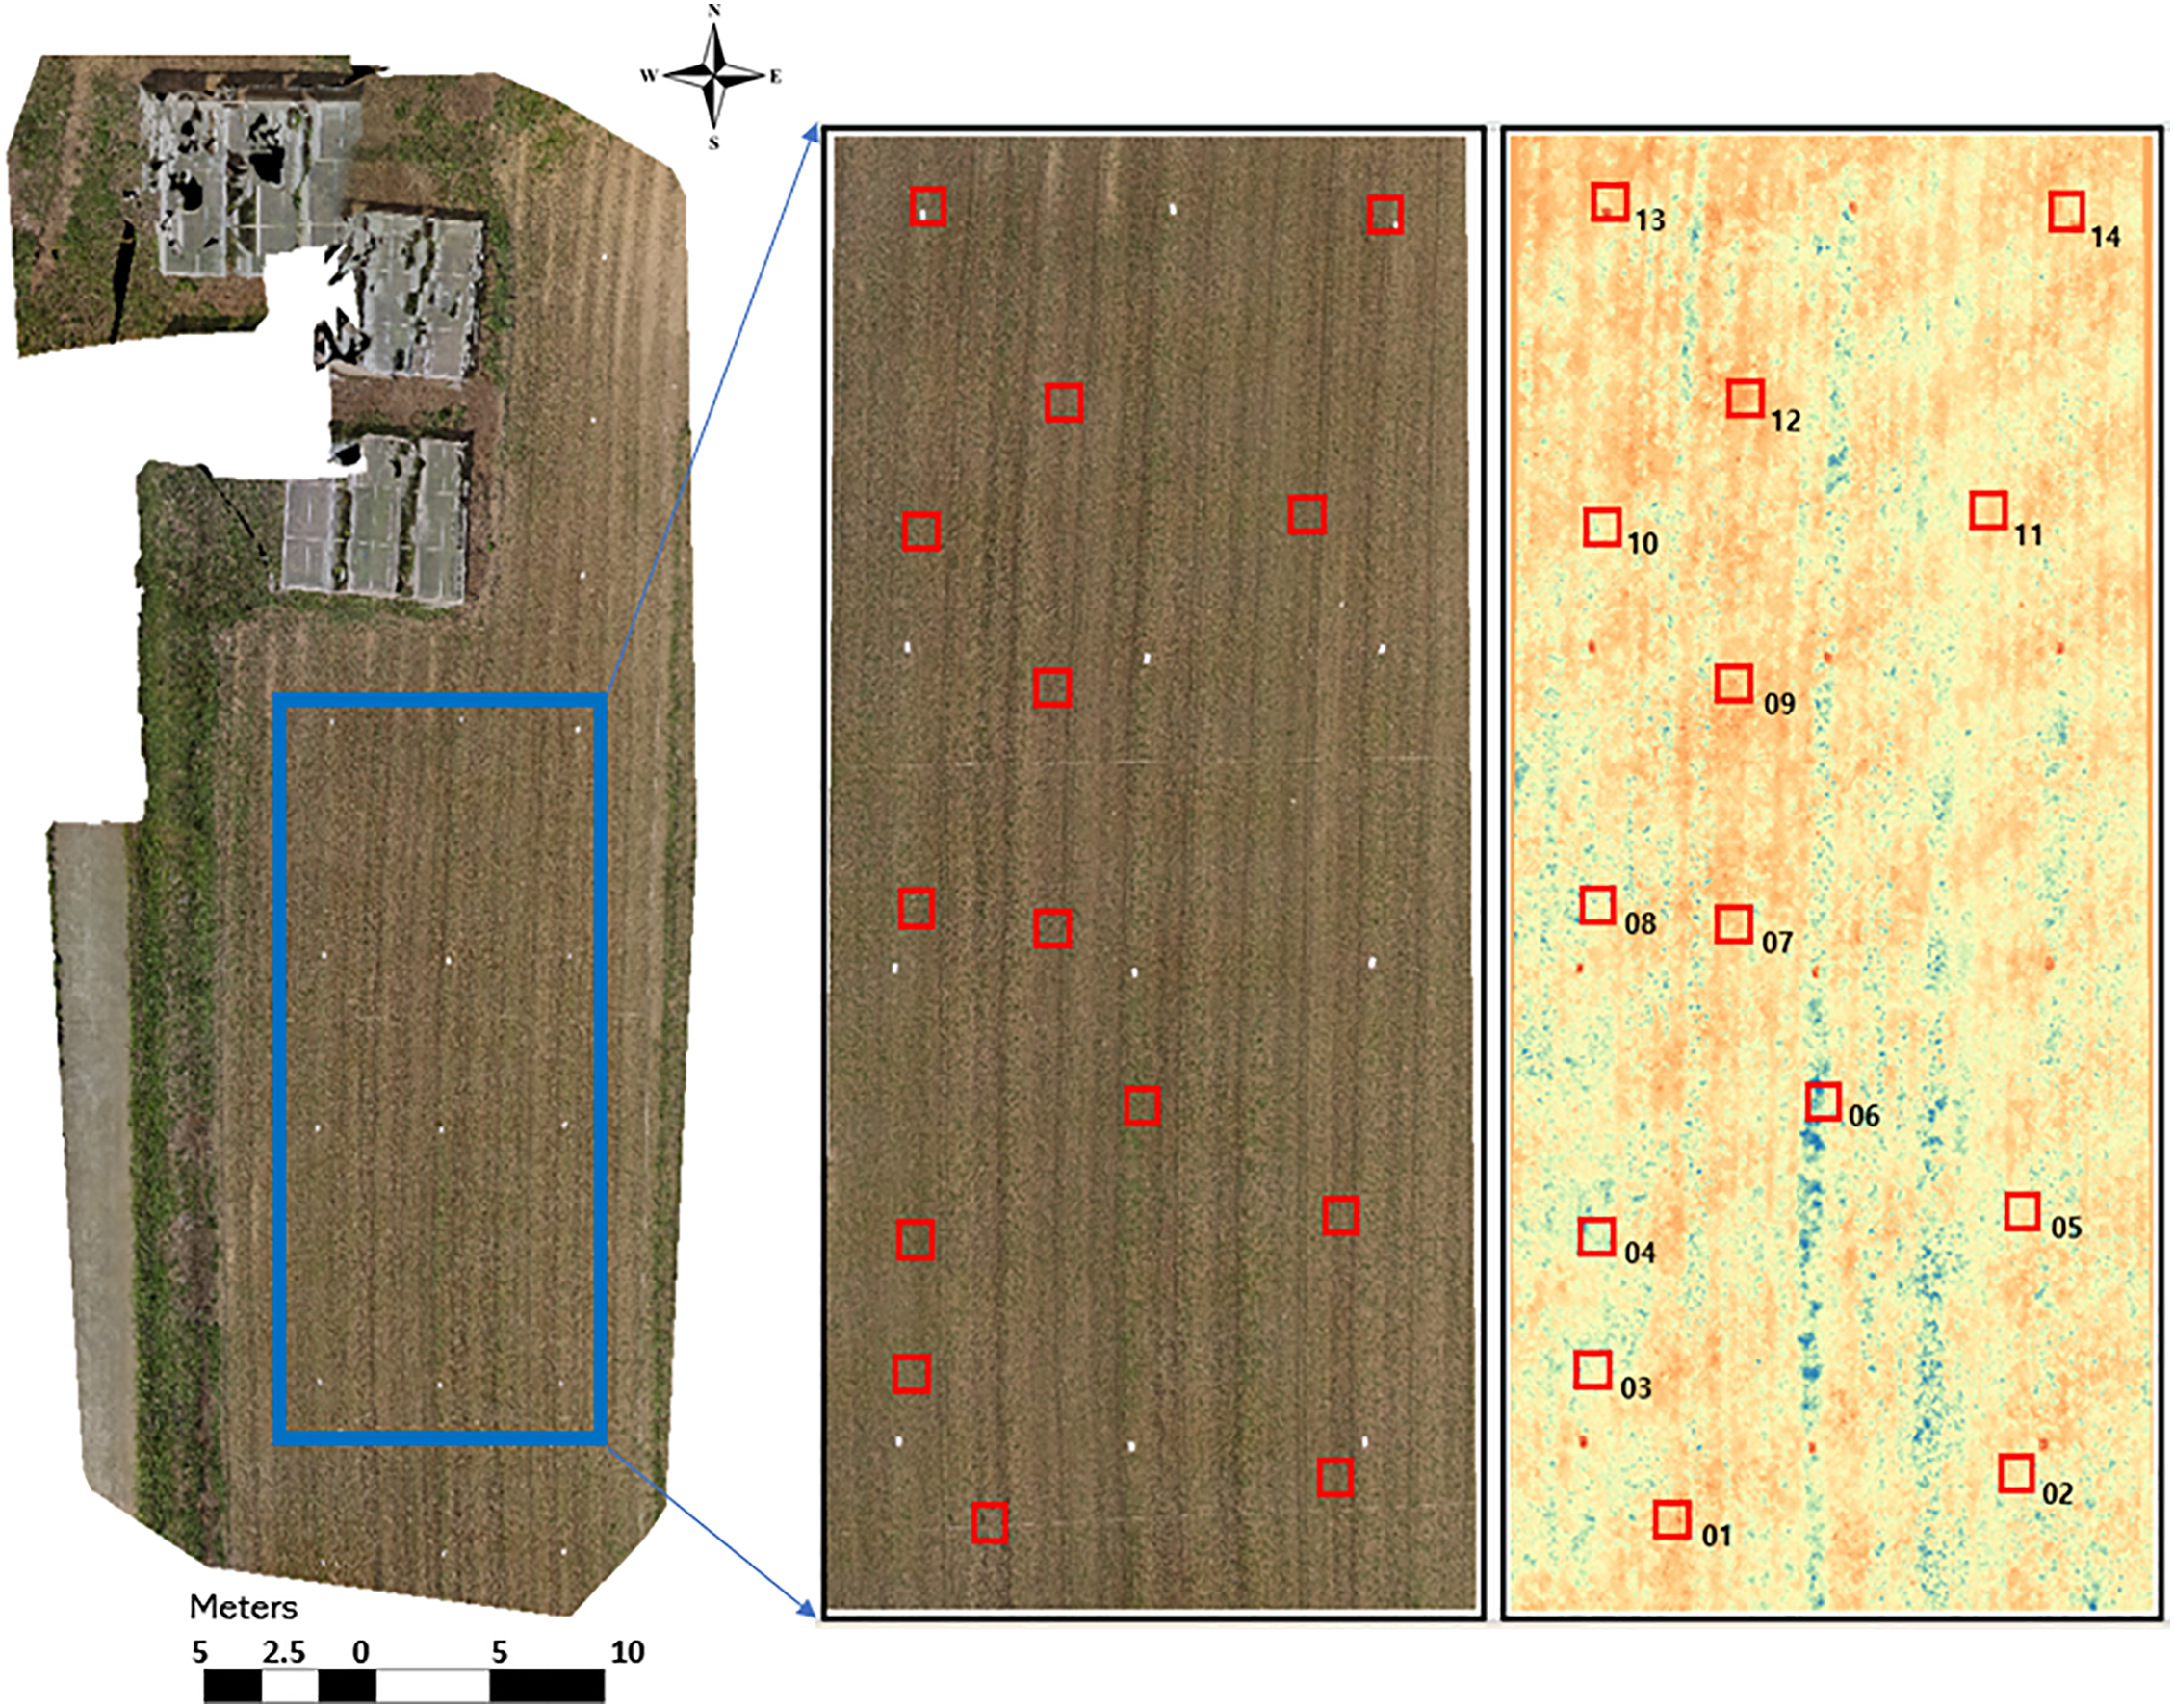
Figure 4: Demarcated sampling area and the selected 14 sampling plots based on RGB and EXG VI maps
Statistical analysis was performed using R software (Version 4.3.1, R Foundation for Statistical Computing, Vienna, Austria). The Shapiro-Wilk test was applied to assess the normality of the data. As all data sets meet normality assumptions at p-value < 0.10 [43], Pearson’s correlation analysis was used to evaluate statistically significant relationships between VI values and AGB. Given the small sample size and the exploratory nature of the study, Pearson’s correlation analysis was used as an initial assessment of linear relationships between VIs and AGB. In addition, 90% confidence intervals for the correlation coefficients were calculated and reported to better reflect the uncertainty in the estimates.
Among the 14 plots originally selected for biomass sampling, 5 plots were excluded from the final analysis due to their values being identified as statistical outliers. The remaining 9 plots were used for correlation analysis. Although the final sample size is limited, the selected plots were intentionally chosen to represent a broad range of vegetation index values, ensuring sufficient heterogeneity for exploratory analysis. The correlations between vegetation indices (VIs) that emphasize green reflectance and fresh AGB of buckwheat are significant (p < 0.10). In contrast, the red band-based VI (ExR) shows no significant correlation with fresh AGB. Although a p-value threshold of 0.10 is relatively lenient, it was used due to the exploratory nature of the study and the small sample size (Table 2). The results should thus be interpreted with attention. The regression plots in Fig. 5 depict inverse linear relationships between green-band-based vegetation indices (VIs) and biomass, indicating that higher VI values are generally associated with lower fresh above-ground biomass (AGB). The statistically significant negative correlations imply that ExG, ExGR, and GLI may not reliably estimate biomass at the flowering stage. Their applicability is potentially compromised by the influence of floral pigmentation, which affects green reflectance and diminishes their effectiveness as biomass indicators. On the other hand, Higher densities of white flowers resulted in lower VI values due to increased canopy reflectance in non-vegetative bands, which reduces the contrast typically captured by green band-based vegetation indices.
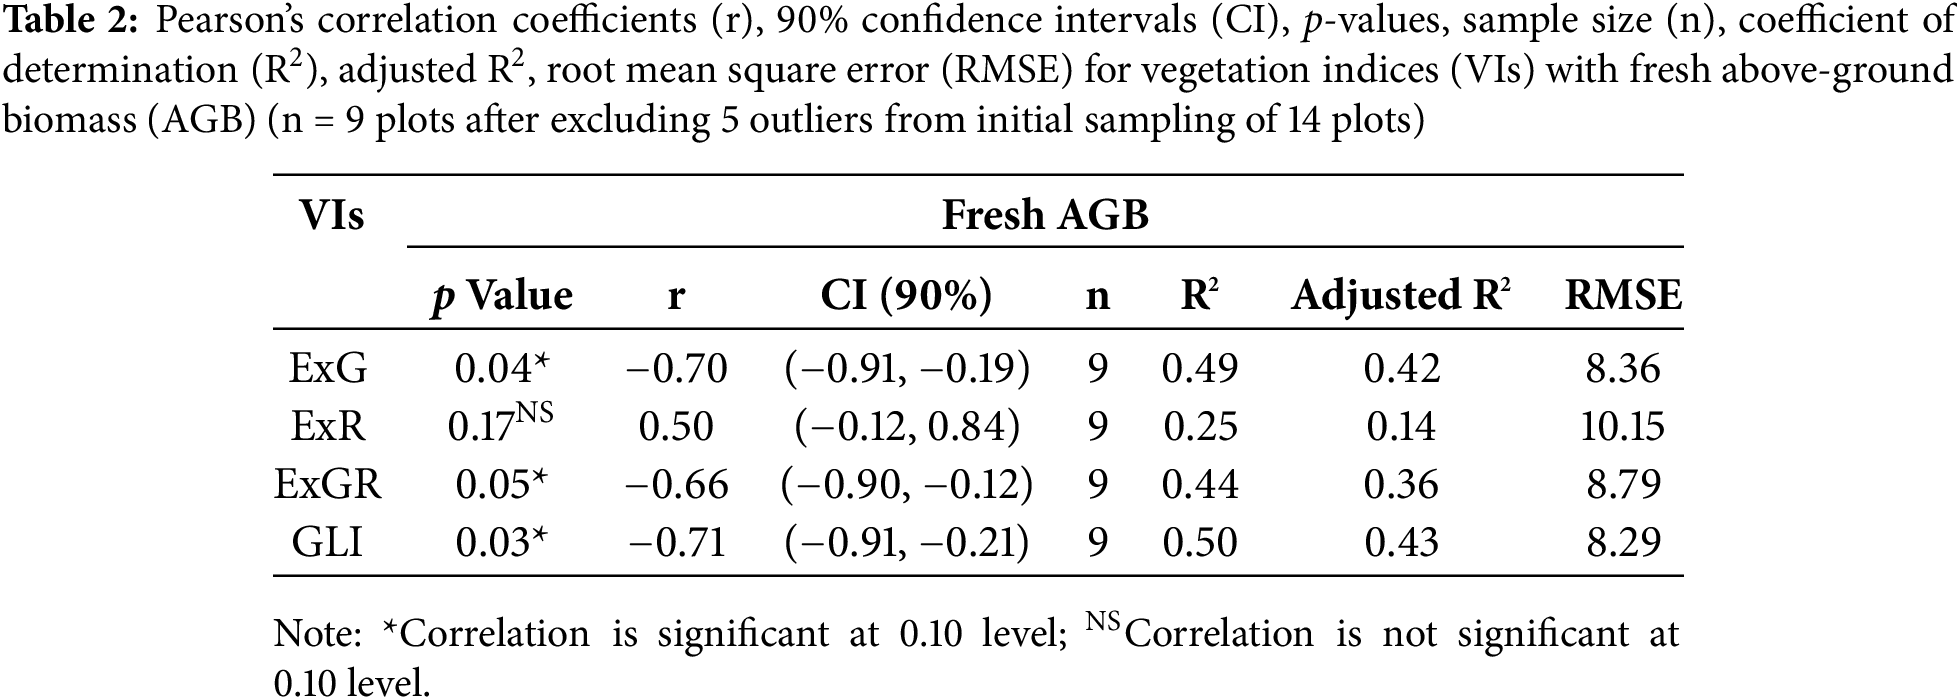
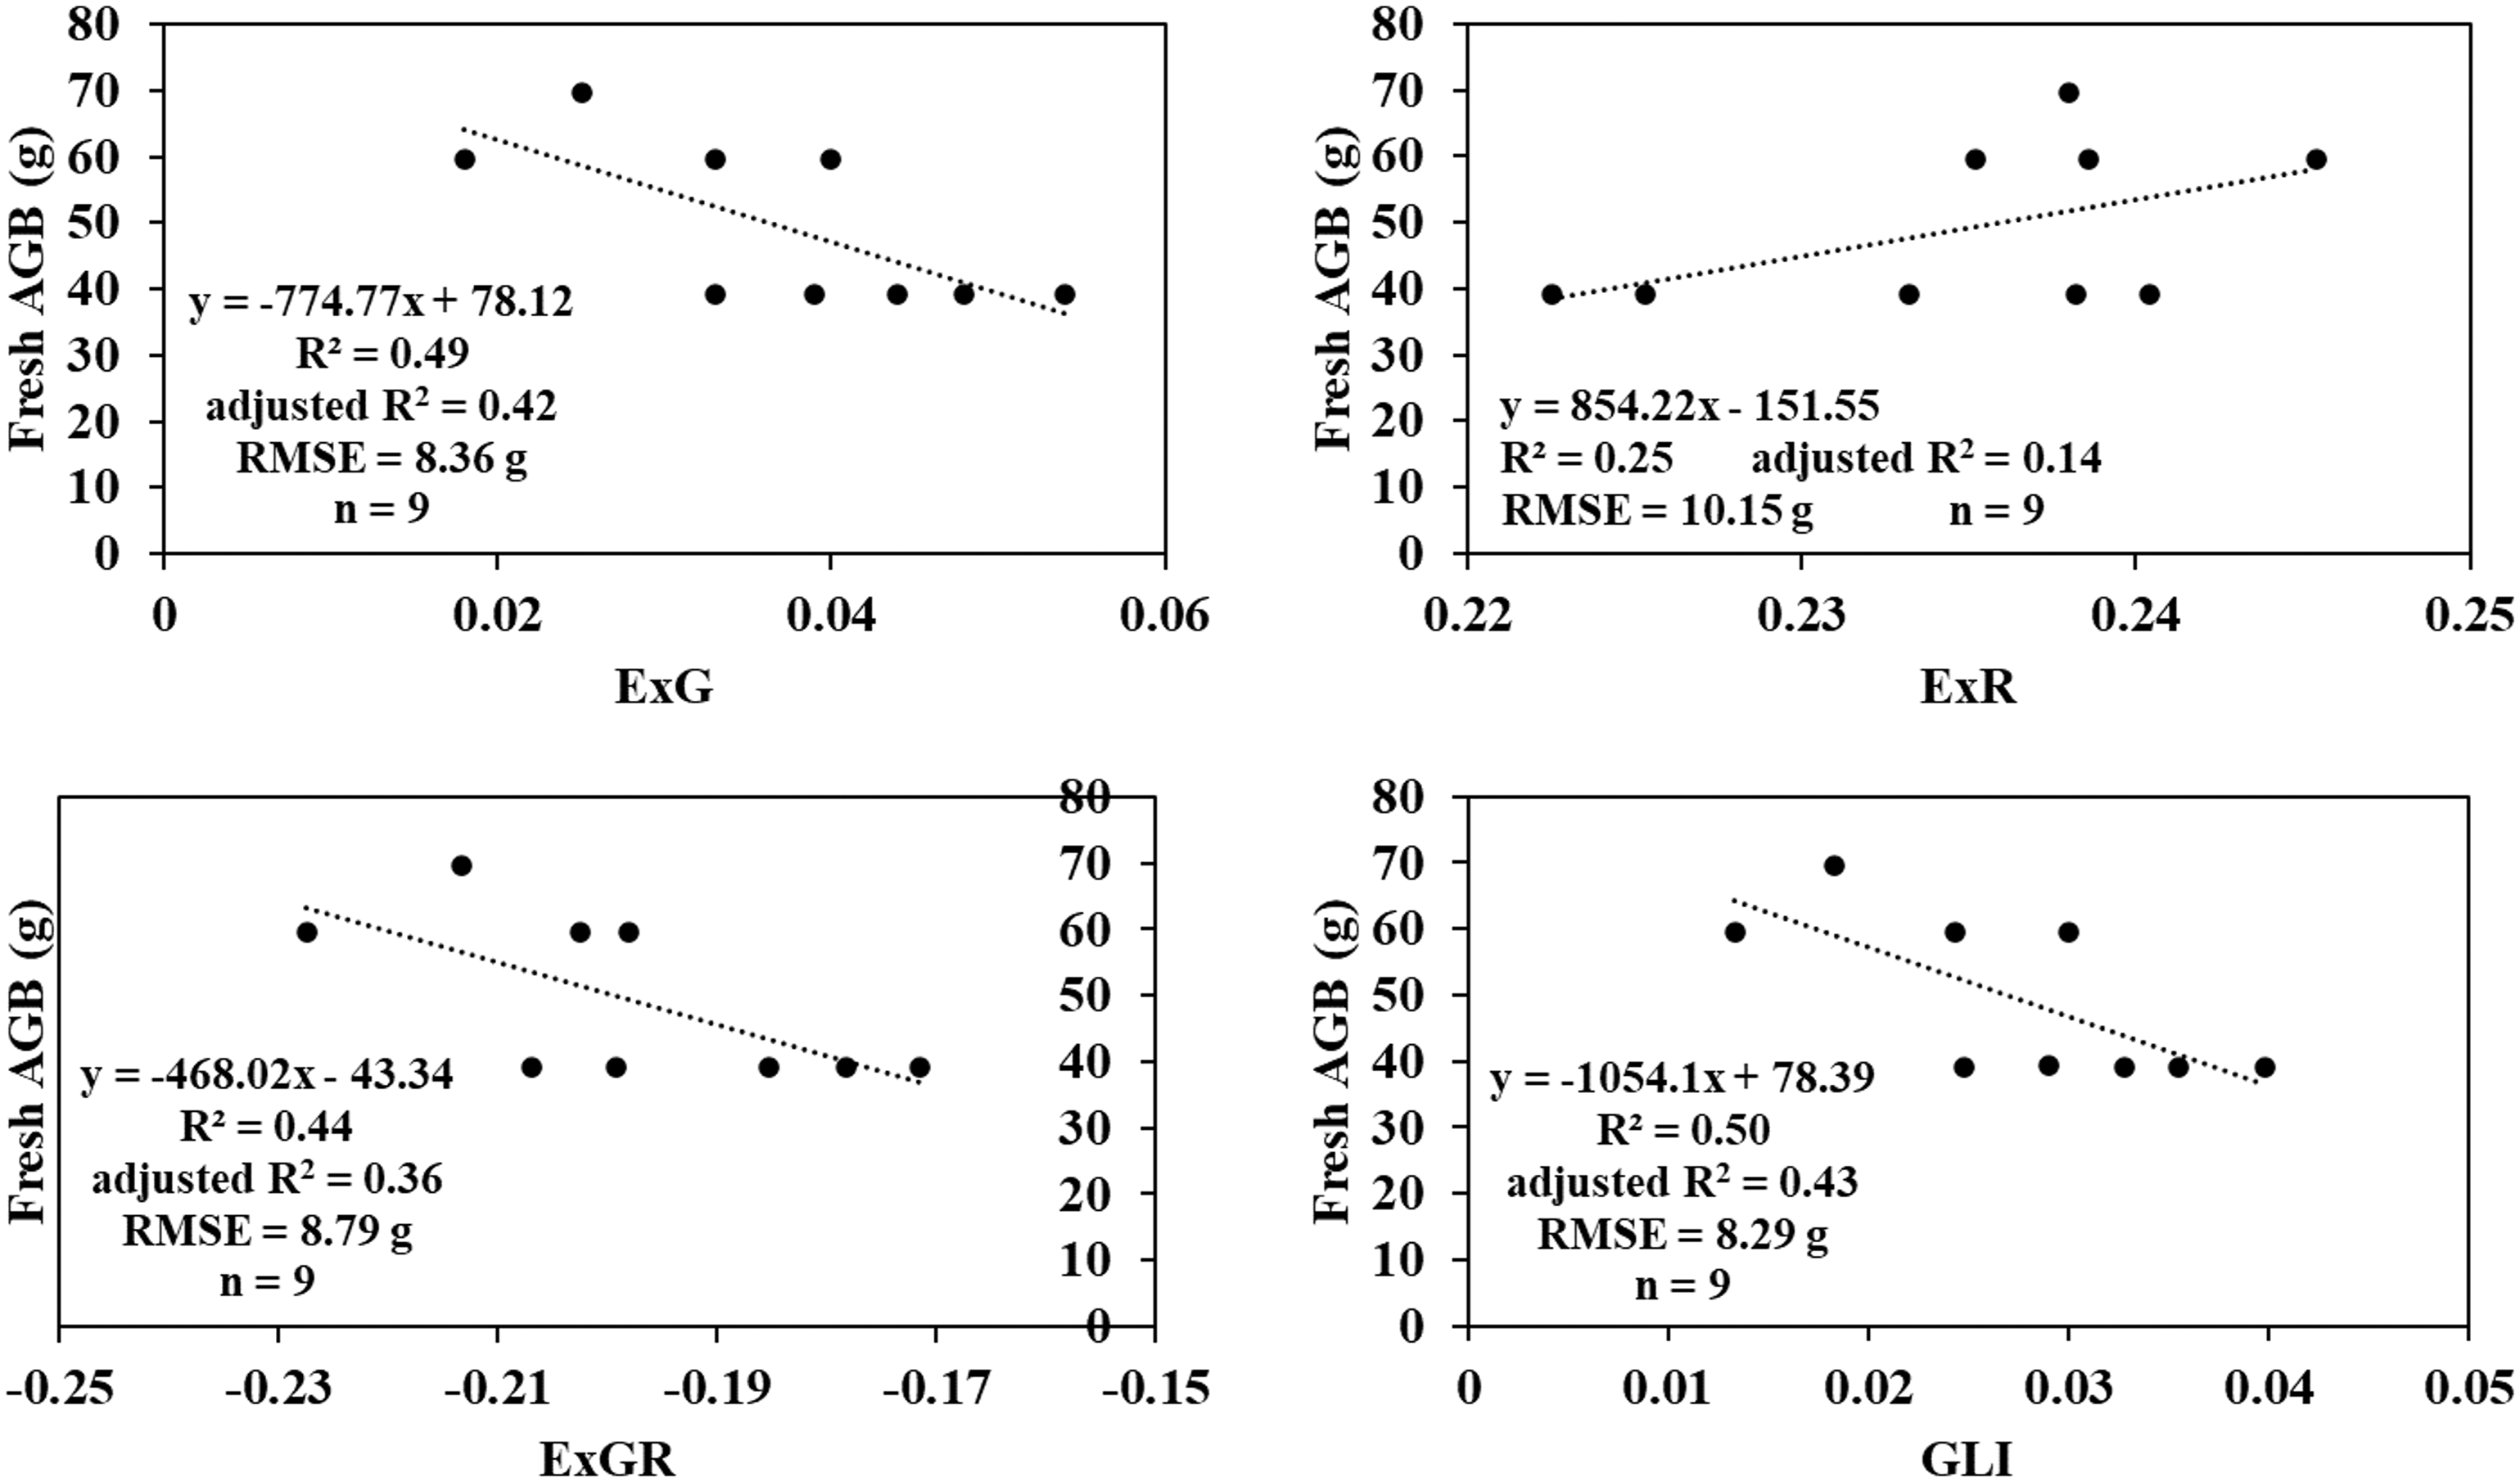
Figure 5: Simple linear regression analysis between RGB-derived vegetation indices (VIs) (ExG, ExR, ExGR, and GLI) and fresh above-ground biomass (AGB) of buckwheat at the flowering stage. Each plot shows the fitted regression line, equation, coefficient of determination (R2), adjusted R2, root mean square error (RMSE), and sample size (n = 9)
Digital imaging offers an important new method to accurately analyze flower colors, helping us understand the complexity of these signals as perceived by pollinators. Since white objects reflect light from all parts of the visible spectrum, white flowers also reflect all visible wavelengths of light [44,45]. The observed correlations between RGB vegetation indices (VIs) at the flowering stage and fresh AGB suggest that GLI and ExG are heavily influenced by the floral display (Fig. 5), with the green reflectance signal being overshadowed by the flowers. These findings highlight the disruptive effect of white flowers on biomass estimation when using green band-based indices. Meanwhile, ExR shows a moderate positive correlation (r = 0.505), but this relationship is not statistically significant (p = 0.17). This indicates that ExR may have some potential for biomass estimation during flowering, but further research is necessary to confirm its reliability and consistency.
The flowering stage introduces confounding spectral signatures to canopy reflectance due to the influence of flower color, texture, floral density, and their reflectance characteristics [46]. During flowering, the increased visibility of flowers, which typically have distinct spectral and textural characteristics compared to leaves, impacts the canopy-level reflectance signal. Bloomed flowers mask the green canopies, particularly when flowers obscure the underlying green vegetation (Fig. 6). This alters the visible reflectance patterns, disrupting the indices’ ability to accurately estimate biomass during this phenological stage [10]. As a result, indices like ExG, ExGR, and GLI, which rely heavily on green reflectance, exhibit the strongest negative correlations with biomass due to their inability to separate floral reflectance from vegetative signals.

Figure 6: UAV-captured images illustrating buckwheat flowers obscuring the green foliage: (a) Image captured at an altitude of 10 m; (b) Image captured at an altitude of 6 m
A forward-looking estimation approach is common in crop monitoring studies [46,47]. The objective of the study was to evaluate the predictive power of flowering-stage vegetation indices for final biomass, we selected four RGB based VIs because they have shown strong positive correlations between AGB and VIs derived from UAV imagery [17,48,49]. As the flowering period is critical for canopy development and photosynthetic activity, which influences final yield and biomass, the indices derived from this stage can serve as valuable indicators despite the temporal gap.
Our findings during the flowering stage reveal an opposing trend, indicating that flower coloration significantly interferes with the relationships typically observed. As shown in Fig. 5, the statistically significant negative correlations for ExG, GLI, and ExGR suggest that RGB indices produce lower VI values as AGB increases during blooming. These results underscore the possibility of developing new relationships between RGB VIs and fresh AGB in plants with white flowers, which could enhance biomass estimation accuracy at the flowering stage. Consequently, there is a clear need for more advanced methodologies to improve biomass predictions during this period. This knowledge has the potential to inform the development of more reliable biomass estimation models for buckwheat and other crops that produce white flowers, particularly at early growth stages.
This study aimed to evaluate the effectiveness of four UAV-derived RGB vegetation indices (ExG, ExGR, GLI, and ExR) in estimating the fresh above-ground biomass (AGB) of buckwheat during the flowering stage. While green-band-based indices like ExG, ExGR, and GLI may hold potential for biomass estimation during this period, the consistent negative correlations observed highlight a key limitation: the spectral signature of abundant white flowers acts as significant ‘spectral noise’, fundamentally disrupting the expected relationship between greenness indices and biomass. This indicates that the application of standard RGB green-band indices for biomass estimation is hindered when species have highly reflective floral parts. Future research should focus on adapting or correcting these indices to mitigate floral spectral interference, possibly through flower masking techniques, the development of new indices less affected by floral reflectance, or by integrating other spectral regions unaffected by flower albedo. Understanding and addressing this challenge is vital for enhancing remote sensing accuracy in phenologically diverse crops and natural vegetation. Consequently, further studies are necessary to validate and refine these approaches, ensuring reliable biomass estimation across different growth stages of buckwheat and similar species.
Acknowledgement: This research was supported by the 2025 scientific promotion program funded by Jeju National University.
Funding Statement: This research was supported by the 2025 scientific promotion program funded by Jeju National University.
Author Contributions: The authors confirm contribution to the paper as follows: Conceptualization, E. M. B. M. Karunathilake, Thanh Tuan Thai, and Yong Suk Chung; methodology, E. M. B. M. Karunathilake and Sheikh Mansoor; software, Thanh Tuan Thai, Anh Tuan Le and Dong-Wook Kim; validation, E. M. B. M. Karunathilake, Thanh Tuan Thai, and Sheikh Mansoor; formal analysis, Thanh Tuan Thai; investigation, Sheikh Mansoor and Anh Tuan Le; resources, Faheem Shehzad Baloch and Dong-Wook Kim; writing—original draft preparation, E. M. B. M. Karunathilake and Thanh Tuan Thai; writing—review and editing, Yong Suk Chung and Dong-Wook Kim; visualization, Thanh Tuan Thai; supervision, Yong Suk Chung and Dong-Wook Kim; project administration, Yong Suk Chung. All authors reviewed the results and approved the final version of the manuscript.
Availability of Data and Materials: Not applicable.
Ethics Approval: Not applicable.
Conflicts of Interest: The authors declare no conflicts of interest to report regarding the present study.
References
1. Hu P, Zheng B, Chen Q, Grunefeld S, Choudhury MR, Fernandez J, et al. Estimating aboveground biomass dynamics of wheat at small spatial scale by integrating crop growth and radiative transfer models with satellite remote sensing data. Remote Sens Environ. 2024;311:114277. doi:10.1016/j.rse.2024.114277. [Google Scholar] [CrossRef]
2. Mian D, Tianle Y, Zhaosheng Y, Tao L, Chengming S. Wheat biomass estimation in different growth stages based on color and texture features of UAV images. Smart Agric. 2022;4(1):71–83. doi:10.12133/j.smartag.SA202202004. [Google Scholar] [CrossRef]
3. Robertson SM, Schmid RB, Lundgren JG. Estimating plant biomass in agroecosystems using a drop-plate meter. PeerJ. 2023;11(3):e15740. doi:10.7717/peerj.15740. [Google Scholar] [CrossRef]
4. Karunathilake EMBM, Le AT, Heo S, Chung YS, Mansoor S. The path to smart farming: innovations and opportunities in precision agriculture. Agriculture. 2023;13(8):1593. doi:10.3390/agriculture13081593. [Google Scholar] [CrossRef]
5. Kwon SH, Ku KB, Le AT, Han GD, Park Y, Kim J, et al. Enhancing citrus fruit yield investigations through flight height optimization with UAV imaging. Sci Rep. 2024;14(1):322. doi:10.1038/s41598-024-57573-2. [Google Scholar] [CrossRef]
6. Wan L, Li Y, Cen H, Zhu J, Yin W, Wu W, et al. Combining UAV-based vegetation indices and image classification to estimate flower number in oilseed rape. Remote Sens. 2018;10(9):1484. doi:10.3390/rs10091484. [Google Scholar] [CrossRef]
7. Zhao D, Yang H, Yang G, Yu F, Zhang C, Chen R, et al. Estimation of maize biomass at multi-growing stage using stem and leaf separation strategies with 3D radiative transfer model and CNN transfer learning. Remote Sens. 2024;16(16):3000. doi:10.3390/rs16163000. [Google Scholar] [CrossRef]
8. Putra AN, Kristiawati W, Mumtazydah DC, Anggarwati T, Annisa R, Sholikah DH, et al. Pineapple biomass estimation using unmanned aerial vehicle in various forcing stage: vegetation index approach from ultra-high-resolution image. Smart Agric Technol. 2021;1:100025. doi:10.1016/j.atech.2021.100025. [Google Scholar] [CrossRef]
9. Sulik JJ, Long DS. Spectral indices for yellow canola flowers. Int J Remote Sens. 2015;36(10):2751–65. doi:10.1080/01431161.2015.1047994. [Google Scholar] [CrossRef]
10. Zhang T, Vail S, Duddu HSN, Parkin IAP, Guo X, Johnson EN, et al. Phenotyping flowering in Canola (Brassica napus L.) and estimating seed yield using an unmanned aerial vehicle-based imagery. Front Plant Sci. 2021;12:686332. doi:10.3389/fpls.2021.686332. [Google Scholar] [CrossRef]
11. Mansoor S, Karunathilake EMBM, Tuan TT, Chung YS. Genomics, phenomics, and machine learning in transforming plant research: advancements and challenges. Hortic Plant J. 2025;11(2):486–503. doi:10.1016/j.hpj.2023.09.005. [Google Scholar] [CrossRef]
12. Candiago S, Remondino F, De Giglio M, Dubbini M, Gattelli M. Evaluating multispectral images and vegetation indices for precision farming applications from UAV images. Remote Sens. 2015;7(4):4026–47. doi:10.3390/rs70404026. [Google Scholar] [CrossRef]
13. Li W, Niu Z, Chen H, Li D, Wu M, Zhao W. Remote estimation of canopy height and aboveground biomass of maize using high-resolution stereo images from a low-cost unmanned aerial vehicle system. Ecol Indic. 2016;67:637–48. doi:10.1016/j.ecolind.2016.03.036. [Google Scholar] [CrossRef]
14. Biswal S, Pathak N, Chatterjee C, Mailapalli DR. Estimation of aboveground biomass from spectral and textural characteristics of paddy crop using UAV-multispectral images and machine learning techniques. Geocarto Int. 2024;39(1):2364725. doi:10.1080/10106049.2024.2364725. [Google Scholar] [CrossRef]
15. Jia Y, Su Z, Shen W, Yuan J, Xu Z. UAV remote sensing image mosaic and its application in agriculture. Int J Smart Home. 2016;10(5):159–70. doi:10.14257/ijsh.2016.10.5.15. [Google Scholar] [CrossRef]
16. Lee KJ, Lee BW. Estimation of rice growth and nitrogen nutrition status using color digital camera image analysis. Eur J Agron. 2013;48(3):57–65. doi:10.1016/j.eja.2013.02.011. [Google Scholar] [CrossRef]
17. Niu Y, Zhang L, Zhang H, Han W, Peng X. Estimating above-ground biomass of maize using features derived from UAV-based RGB imagery. Remote Sens. 2019;11(11):1261. doi:10.3390/rs11111261. [Google Scholar] [CrossRef]
18. Kazemi F, Parmehr EG. Evaluation of RGB Vegetation Incides derived from UAV images for rice crop growth monitoring. ISPRS Ann Photogramm Remote Sens Spatial Inf Sci. 2023;10:385–90. doi:10.5194/isprs-annals-x-4-w1-2022-385-2023. [Google Scholar] [CrossRef]
19. Bendig J, Bolten A, Bennertz S, Broscheit J, Eichfuss S, Bareth G. Estimating biomass of barley using Crop Surface Models (CSMs) derived from UAV-based RGB imaging. Remote Sens. 2014;6(11):10395–412. doi:10.3390/rs61110395. [Google Scholar] [CrossRef]
20. Lussem U, Bolten A, Gnyp ML, Jasper J, Bareth G. Evaluation od RGB-based Vegetation Indices from UAV imagery to estimate forage yield in grassland. Int Arch Photogramm Remote Sens Spatial Inf Sci. 2018;42:1215–9. doi:10.5194/isprs-archives-xlii-3-1215-2018. [Google Scholar] [CrossRef]
21. Cawoy V, Ledent JF, Kinet JM, Jacquemart AL. Floral biology of common buckwheat (Fagopyrum esculentum Moench). Eur J Plant Sci Biotechnol. 2009;3(1):1–9. [Google Scholar]
22. Uddin MR, Li X, Park WT, Kim YB, Kim SJ, Kim YS, et al. Phenolic compound content in different organs of korean common buckwheat cultivars. Asian J Chem. 2013;25(1):424–6. doi:10.14233/ajchem.2013.13141. [Google Scholar] [CrossRef]
23. Wu Y, Li Z, Zhu H, Zi R, Xue F, Yu Y. Identification of tartary buckwheat (Fagopyrum tataricum (L.) Gaertn) and common buckwheat (Fagopyrum esculentum Moench) using gas chromatography-mass spectroscopy-based untargeted metabolomics. Foods. 2023;12(13):2578. doi:10.3390/foods12132578. [Google Scholar] [CrossRef]
24. Bavec F, Pušnik S, Rajčan I. Yield performance of two buckwheat genotypes grown as a full-season and stubble-crop. Plant Soil Environ. 2002;48(8):351–5. doi:10.17221/4379-pse. [Google Scholar] [CrossRef]
25. Boglaienko D, Soti P, Shetty KG, Jayachandran K. Buckwheat as a cover crop in Florida: mycorrhizal status and soil analysis. Agroecol Sustain Food Syst. 2014;38(9):1033–46. doi:10.1080/21683565.2014.906016. [Google Scholar] [CrossRef]
26. Babu S, Yadav GS, Singh R, Avasthe RK, Das A, Mohapatra KP, et al. Production technology and multifarious uses of buckwheat (Fagopyrum spp.a review. Indian J Agron. 2018;63(4):415–27. [Google Scholar]
27. Hornyák M, Dziurka M, Kula-Maximenko M, Pastuszak J, Szczerba A, Szklarczyk M, et al. Photosynthetic efficiency, growth and secondary metabolism of common buckwheat (Fagopyrum esculentum Moench) in different controlled-environment production systems. Sci Rep. 2022;12(1):257. doi:10.1038/s41598-021-04134-6. [Google Scholar] [CrossRef]
28. Mariotti M, Masoni A, Arduini I. Forage and grain yield of common buckwheat in Mediterranean conditions: response to sowing time and irrigation. Crop Pasture Sci. 2016;67(9):1000. doi:10.1071/cp16091. [Google Scholar] [CrossRef]
29. Oh MA, Park JE, Kim JY, Kang HM, Min Oh SS, Mansoor S, et al. Seed traits inheritance in Fagopyrum esculentum Moench. based on image analysis method. Front Plant Sci. 2024;15:1445348. doi:10.3389/fpls.2024.1445348. [Google Scholar] [CrossRef]
30. Kalinova J, Vrchotova N. The influence of organic and conventional crop management, variety and year on the yield and flavonoid level in common buckwheat groats. Food Chem. 2011;127(2):602–8. doi:10.1016/j.foodchem.2011.01.050. [Google Scholar] [CrossRef]
31. Fang X, Li Y, Nie J, Wang C, Huang K, Zhang Y, et al. Effects of nitrogen fertilizer and planting density on the leaf photosynthetic characteristics, agronomic traits and grain yield in common buckwheat (Fagopyrum esculentum M.). Field Crops Res. 2018;219(2):160–8. doi:10.1016/j.fcr.2018.02.001. [Google Scholar] [CrossRef]
32. Kalinová J, Moudrý J, Čurn V. Yield formation in common buckwheat (Fagopyrum esculentum Moench). Acta Agron Hung. 2005;53(3):283–91. doi:10.1556/aagr.53.2005.3.5. [Google Scholar] [CrossRef]
33. Guglielmini AC, Forcat JI, Miralles DJ. The critical period for yield determination in common buckwheat (Fagopyrum esculentum Moench). Eur J Agron. 2019;110:125933. doi:10.1016/j.eja.2019.125933. [Google Scholar] [CrossRef]
34. Woebbecke DM, Meyer GE, Bargen VK, Mortensen DA. Color Indices for weed identification under various soil, residue, and lighting conditions. Trans ASAE. 1995;38(1):259–69. doi:10.13031/2013.27838. [Google Scholar] [CrossRef]
35. Bagheri N, Aghdam MJ, Ebrahimi H. Estimating Nitrogen and Chlorophyll content in corn using spectral vegetation indices derived from UAV multispectral imagery. BBR. 2024;3(1):81–93. doi:10.22103/BBR.2024.23234.1082. [Google Scholar] [CrossRef]
36. Ku KB, Mansoor S, Han GD, Chung YS, Tuan TT. Identification of new cold tolerant Zoysia grass species using high-resolution RGB and multi-spectral imaging. Sci Rep. 2023;13(1):13209. doi:10.1038/s41598-023-40128-2. [Google Scholar] [CrossRef]
37. Wang T, Chandra A, Jung J, Chang A. UAV remote sensing based estimation of green cover during turfgrass establishment. Comput Electron Agric. 2022;194(3):106721. doi:10.1016/j.compag.2022.106721. [Google Scholar] [CrossRef]
38. Han GD, Jang G, Kim J, Kim DW, Rodrogues R, Kim SH, et al. RGB images-based vegetative index for phenotyping kenaf (Hibiscus cannabinus L.). PLoS One. 2021;16(9):e0256978. doi:10.1371/journal.pone.0256978. [Google Scholar] [CrossRef]
39. Kim DW, Yun H, Jeong SJ, Kwon YS, Kim SG, Lee W, et al. Modeling and testing of growth status for Chinese cabbage and white radish with UAV-based RGB imagery. Remote Sens. 2018;10(4):563. doi:10.3390/rs10040563. [Google Scholar] [CrossRef]
40. Karunathilake EMBM, Thai TT, Mansoor S, Le AT, Baloch FS, Chung YS, et al. The use of RGB vegetation indices to predict the buckwheat yield at the flowering stage. J Crop Sci Biotechnol. 2025;28(3):379–89. doi:10.1007/s12892-025-00283-6. [Google Scholar] [CrossRef]
41. Juszczak D, Wesołowski M. Phenological phases of buckwheat (Fagopyrum esculentum Mnch.) in the primary and secondary crop depending on seeding rate. Acta Agrobot. 2012;64(4):213–26. doi:10.5586/aa.2011.063. [Google Scholar] [CrossRef]
42. Vogel M. Cover crop connection examining the properties of buckwheat as an alternative cover crop [Internet]. Brookfield, WI, USA: Lessiter Media Publications. 2023 [cited 2025 Jun 3]. Available from: https://www.covercropstrategies.com/articles/2842-examining-the-properties-of-buckwheat-as-an-alternative-cover-crop. [Google Scholar]
43. Shapiro SS, Wilk MB. An analysis of variance test for normality (complete samples). Biometrika. 1965;52(3–4):591–611. doi:10.1093/biomet/52.3-4.591. [Google Scholar] [CrossRef]
44. Garcia JE, Greentree AD, Shrestha M, Dorin A, Dyer AG. Flower colours through the lens: quantitative measurement with visible and ultraviolet digital photography. PLoS One. 2014;9(5):e96646. doi:10.1371/journal.pone.0096646. [Google Scholar] [CrossRef]
45. Knipling EB. Physical and physiological basis for the reflectance of visible and near-infrared radiation from vegetation. Remote Sens Environ. 1970;1(3):155–9. doi:10.1016/s0034-4257(70)80021-9. [Google Scholar] [CrossRef]
46. Lukas V, Huňady I, Kintl A, Mezera J, Hammerschmiedt T, Sobotková J, et al. Using UAV to identify the optimal vegetation index for yield prediction of oil seed rape (Brassica napus L.) at the flowering stage. Remote Sens. 2022;14(19):4953. doi:10.3390/rs14194953. [Google Scholar] [CrossRef]
47. Danilevicz MF, Bayer PE, Boussaid F, Bennamoun M, Edwards D. Maize yield prediction at an early developmental stage using multispectral images and genotype data for preliminary hybrid selection. Remote Sens. 2021;13(19):3976. doi:10.3390/rs13193976. [Google Scholar] [CrossRef]
48. Liu Y, Feng H, Yue J, Fan Y, Jin X, Zhao Y, et al. Estimation of potato above-ground biomass using UAV-based hyperspectral images and machine-learning regression. Remote Sens. 2022;14(21):5449. doi:10.3390/rs14215449. [Google Scholar] [CrossRef]
49. Zhou R, Yang C, Li E, Cai X, Wang X. Aboveground biomass estimation of wetland vegetation at the species level using unoccupied aerial vehicle RGB imagery. Front Plant Sci. 2023;14:1181887. doi:10.3389/fpls.2023.1181887. [Google Scholar] [CrossRef]
Cite This Article
 Copyright © 2025 The Author(s). Published by Tech Science Press.
This work is licensed under a Creative Commons Attribution 4.0 International License , which permits unrestricted use, distribution, and reproduction in any medium, provided the original work is properly cited.
 Downloads
 Citation Tools