
 Submit a Paper
 Propose a Special lssue
 Open Access
ARTICLE

Comparative Analysis of the Impact of Different Ecotypes on In Vitro Anti-Inflammatory Activity of Ethanolic Extracts of Moringa oleifera Leaves
1 Department of Neuroscience, Psychology, Drug Research and Child Health (NEUROFARBA), Section of Pharmacology and Toxicology, University of Florence, Viale Pieraccini 6, Florence, Italy
2 Institute for Sustainable Plant Protection (IPSP), CNR, Via Madonna del Piano 10, Sesto Fiorentino, Italy
3 Department of Agricultural, Food, Environmental and Forestry Sciences and Technologies (DAGRI), Section of Arboreal Crops, University of Florence, Piazzale delle Cascine 18, Florence, Italy
* Corresponding Authors: Elisabetta Bigagli. Email: ; Cecilia Brunetti. Email:
(This article belongs to the Special Issue: Plant-Derived Natural Products: Phytochemical Diversity and Functional Properties)
Phyton-International Journal of Experimental Botany 2026, 95(1), 2 https://doi.org/10.32604/phyton.2026.073250
Received 14 September 2025; Accepted 24 December 2025; Issue published 30 January 2026
 View Full Text
 Download PDF
Abstract
Moringa oleifera (MO) is traditionally used to mitigate inflammatory-mediated disorders; however, the influence of ecotypic variation on its anti-inflammatory activity remains poorly understood. In this study, we compared the phytochemical composition and anti-inflammatory activity of ethanolic extracts obtained from fresh and dried leaves of four MO ecotypes (India, Paraguay, Mozambique, and Pakistan), all grown under the same outdoor conditions, as well as two commercial powders (Just Moringa and WISSA), using LPS-stimulated RAW 264.7 macrophages. Extracts from fresh leaves were 19–43% more cytotoxic than those from dried leaves, depending on the ecotype, likely due to higher cyanogenic glycoside content. Extracts from the India and Paraguay ecotypes, characterized by high levels of quercetin derivatives and caffeic acids, as well as Just Moringa, enriched in kaempferol derivatives, significantly inhibited LPS-induced nitric oxide (NO) production (p < 0.05). Just Moringa and Paraguay extracts also reduced iNOS gene expression (p < 0.05 and p < 0.01, respectively), whereas only the Paraguay extract decreased iNOS protein levels (p < 0.05). In contrast, quercetin-3-O-glucoside and rutin showed significant effects only at concentrations approximately 100-fold higher than those present in the extracts, indicating that the phytocomplex displays greater bioactivity than individual compounds. Overall, these results demonstrate that ecotypic variation strongly affects the polyphenolic composition and anti-inflammatory properties of MO leaves, highlighting the importance of reporting both origin and phytochemical composition in MO-based products.Keywords
Supplementary Material
Supplementary Material FileMoringa oleifera Lam. (MO), a member of the Moringaceae family native to the sub-Himalayan mountains of northern India, has been introduced over time into arid and semi-arid regions of Africa, South America, and Southeast Asia [1,2,3,4], giving rise to multiple ecotypes [5]. These ecotypes differ in the production and accumulation of primary and secondary metabolites, including polyphenols, which may vary substantially in both quality and quantity [6,7]. Leaves are the most widely used plant part, as they contain the highest concentrations of bioactive compounds, particularly polyphenols, which are secondary metabolites synthesized in response to both abiotic and biotic stresses [8,9].
The health-promoting properties of polyphenols are well documented and are attributed not only to their antioxidant activity but also to their ability to modulate inflammatory pathways [10]. In recent years, beyond the anti-inflammatory effects of individual polyphenolic compounds, mounting evidence suggests that phytocomplexes, such as plant extracts, may exhibit enhanced activity compared with isolated constituents due to additive or synergistic interactions [11]. Several beneficial activities of MO have been reported in vitro and in vivo, including anti-inflammatory, antioxidant, antiviral, antibacterial, cardioprotective, antidiabetic, and anticancer effects [12]. However, the botanical origin of the plant is often not specified. Given the growing commercial interest in natural products, standardization of production processes and the reporting of both origin and phytochemical composition are crucial, as different ecotypes may possess distinct phytocomplexes and, consequently, different biological activities.
The present study aimed to compare ethanolic extracts obtained from fresh and dried leaves of different M. oleifera ecotypes grown under the same environmental conditions, as well as extracts from two commercial powders. The extracts were characterized for their polyphenolic and cyanogenic glycoside contents and subsequently evaluated in an in vitro inflammation model using lipopolysaccharide (LPS)-stimulated murine RAW 264.7 macrophages.
Seeds of Moringa oleifera ecotypes were obtained from four different parts of the world: India (the variety PKM1), Paraguay, Mozambique and Pakistan, and sown in 10 L plastic pots containing peat substrate, gravel and nursery soil (1:1:1). One-month-old seedlings were then grown outdoor in a common garden located at the University of Florence in Sesto Fiorentino (Florence, Italy) (43°81′ N 11°19′ E) for three months (from June to August). Plants were regularly irrigated, and leaves were collected at the end of August. Fresh leaves of each ecotype were collected and put in liquid nitrogen: part of these leaves were stored at −80°C, whereas the other part was dried in oven at 65°C for 4 days. The ratio of fresh weight/dry weight was then calculated for each ecotype. Two commercial powders of moringa leaves (Just Moringa and Wissa) were purchased in Pakistan.
Voucher specimens were deposited at the Agricultural-Forest Florence (FIAF) herbarium, where the Moringa oleifera leaves were verified by botanical experts.
2.2 Preparation of Ethanolic Extracts and HPLC Analysis
Fresh (5 g) and dried leaf material (1 g) and commercial powders (1 g) were extracted three times with a mixture of 75% EtOH/25% H2O acidified to pH 2.5 with formic acid. The supernatant was partitioned with n-hexane to remove chlorophylls and carotenoids, then reduced to dryness under vacuum and rinsed with 1 mL of water and 500 μL of DMSO.
Aliquots of these extracts were then diluted 10 times before HPLC injection; 5 μL were injected into a Perkin Elmer Flexar liquid chromatography equipped with a quaternary 200Q/410 pump and an LC 200 diode array detector (all from Perkin Elmer, Bradford, CT, USA), using a Agilent® Zorbax® SB-18 column (250 × 4.6 mm, 5 μm), kept at 30°C and following the method described in [13].
Phenylpropanoids, consisting of caffeic acid, apigenin, quercetin and kaempferol derivatives, were identified based on their retention times and spectral characteristics of authentic standards (Extrasynthese, Lyon-Nord, Genay, France and Sigma Aldrich, Milan, Italy). For the analysis of cyanogenic compounds, the wavelength was set at 227 nm, and the eluents were (A) acidified water (at pH 2.5 adjusted with HCOOH) and (B) acetonitrile (at pH 2.5 adjusted with HCOOH). The following solvent gradient (v/v) was applied: 0–3 min (3% B), 3–46 min (3–80% B), 47–60 min (80–3% B).
Cyanogenic glycosides were identified based on their retention times and the spectral characteristics of glucomoringin and glucotropaeolin (Extrasynthese, Lyon-Nord, Genay, France and Sigma Aldrich, Milan, Italy). All the compounds are reported as μmol g−1 DW. For cells treatment, each ethanolic extract was dissolved in H2O + DMSO (50%) and diluted in complete cell culture medium to obtain the appropriate concentrations to be tested with a final concentration of DMSO <0.1%.
RAW 264.7 murine macrophages (ATCC, Rockville, MD, USA) were cultured in Dulbecco’s Modified Eagle Medium (DMEM; Euroclone, Milan, Italy) supplemented with 10% fetal bovine serum, 1% L-glutamine, and 1% penicillin/streptomycin (all from Carlo Erba Reagents, Milan, Italy). Cells were maintained at 37°C in a humidified atmosphere with 5% CO2.
Cells were seeded in 96-well plates at a density of 5 × 10³ cells/well and incubated for 24 h. Treatments with MO extract (0.5–25 μM, expressed as total phenolic content), quercetin-3-O-glucoside (1.2–120 μM), or rutin (1.8–180 μM) were then applied for an additional 24 h. Rutin (quercetin-3-O-rutinoside) was used as a reference flavonoid due to the unavailability of quercetin sophoroside. Cell viability was evaluated using the MTS assay (Promega, Madison, WI, USA). Absorbance was measured at 490 nm, and results were expressed as percentage of viable cells relative to untreated controls.
2.5 LPS-Induced Inflammation in RAW 264.7
RAW 264.7 cells were plated in 24-well plates (1 × 10⁵ cells/well) and allowed to adhere for 24 h. Inflammation was induced by lipopolysaccharide (LPS, 1 μg/mL), administered alone or in combination with MO extract (0.5–5 μM) or selected pure compounds. Celecoxib (3 μM) was used as a positive control. After 18 h of incubation, culture supernatants were collected for nitric oxide (NO) and Prostaglandin E2 (PGE2) measurements, while cells were harvested for gene expression analysis.
2.6 Quantification of NO Production
NO production was assessed by quantifying nitrite accumulation in the culture medium using the Griess reaction. Supernatants (100 μL) were mixed with Griess reagent (1% sulfanilamide and 0.1% N-[1-naphthyl] ethylenediamine hydrochloride in 2.5% phosphoric acid) and incubated at room temperature for 30 min. Absorbance was recorded at 540 nm using a VICTOR 3 Wallac 1421 microplate reader (PerkinElmer, Ramsey, MN, USA), and nitrite concentrations were calculated using a sodium nitrite standard curve.
PGE2 levels were measured in the cell media, using an ELISA kit (Cayman, Ann Arbor, MI, USA) according to the manufacturer’s specifications.
2.8 RNA Extraction and Quantitative Real-Time PCR
Total RNA was extracted using TRIzol reagent following standard procedures. RNA concentration and purity were assessed spectrophotometrically, and first-strand cDNA was synthesized using the RevertAid RT Kit (Thermo Scientific, Waltham, MA, USA) according to the manufacturer’s protocol. Quantitative real-time PCR was performed using SsoAdvanced Universal SYBR Green Supermix (Bio-Rad) on a Rotor-Gene® Q system (Qiagen). Amplification conditions consisted of an initial denaturation at 95°C for 30 s, followed by 35 cycles at 95°C for 15 s and 60°C for 30 s. Relative gene expression of Cox-2 and iNOS was normalized to Rplp1 and calculated using the 2−ΔΔCt method. Primer sequences are reported in Table 1.
Table 1: Primer sequences.
| Gene | Primer Forward | Primer Reverse |
|---|---|---|
| Rplp1 | ATCTACTCCGCCCTCATCCT | CAGATGAGGCTCCCAATGTT |
| Cox-2 | TCCTCCTGGAACATGGACTC | CCCCAAAGATAGCATCTGGA |
| iNOS | AGACCTCAACAGAGCCCTCA | GCAGCCTCTTGTCTTTGACC |
2.9 Immunocytofluorescence for Inducible Nitric Oxide Synthase (iNOS)
Cells grown on poly-D-lysine-coated glass dishes were treated as described above, fixed with 4% paraformaldehyde, and permeabilized with Triton X-100. After blocking, cells were incubated with an anti-iNOS primary antibody (1:100; BD Transduction Laboratories, Lexington, KY, USA), followed by an Alexa Fluor 488-conjugated secondary antibody (1:200; Invitrogen, Milan, Italy). Nuclei were counterstained with DAPI. Fluorescence images were acquired using an Olympus BX63 microscope with a metal halide lamp and an Olympus XM10 digital camera.
Statistical analyses were performed using GraphPad Prism software (version 10.6.0; GraphPad Software, San Diego, CA, USA). Data were analyzed by one-way ANOVA followed by Tukey’s post hoc test (Table 2 and Table 3; results expressed as mean ± SD from three replicates) or by Dunnett’s multiple comparison test (Fig. 1, Fig. 2 and Fig. 3; data presented as mean ± SEM from three independent experiments). Statistical significance was defined as p < 0.05.
Table 2: HPLC quantification of main polyphenols in MO leaf extracts.
| Sample | Caffeic Acids | Apigenin Derivatives | Quercetin Derivatives | Kaempferol Derivatives | Total Phenolic Content |
|---|---|---|---|---|---|
| India_dried | 7.62 ± 0.68b | 1.24 ± 0.11d | 16.93 ± 1.52ab | 4.08 ± 0.37e | 29.87 ± 2.69b |
| Paraguay_dried | 9.99 ± 0.90a | 1.50 ± 0.13c | 18.67 ± 1.68a | 6.19 ± 0.56d | 36.34 ± 3.27a |
| Mozambique_dried | 8.81 ± 0.79a | 1.80 ± 0.16c | 10.49 ± 1.03d | 15.42 ± 1.93b | 36.52 ± 3.92a |
| Pakistan_dried | 5.99 ± 0.54c | 1.04 ± 0.09d | 12.76 ± 1.15c | 10.23 ± 0.92c | 30.01 ± 2.70ab |
| Just moringa | 4.30 ± 0.39d | 1.02 ± 0.09d | 13.41 ± 1.21c | 12.21 ± 0.65b | 30.94 ± 2.33ab |
| WISSA | 4.46 ± 0.40d | 2.04 ± 0.18c | 13.71 ± 1.23bc | 9.18 ± 0.83c | 29.40 ± 2.65b |
| India_fresh | 3.81 ± 0.34de | 1.09 ± 0.10de | 15.92 ± 1.43b | 4.88 ± 0.44e | 25.70 ± 2.31b |
| Paraguay_fresh | 3.54 ± 0.32e | 3.84 ± 0.35a | 17.78 ± 1.60ab | 6.44 ± 0.58d | 31.60 ± 2.84a |
| Mozambico_fresh | 2.13 ± 0.19f | 0.91 ± 0.08e | 9.26 ± 0.83d | 21.55 ± 1.94a | 33.85 ± 3.05a |
| Pakistan_fresh | 2.65 ± 0.24f | 2.79 ± 0.25b | 13.63 ± 1.58c | 9.94 ± 0.50c | 29.01 ± 2.57b |
Table 3: HPLC quantification of main cyanogenic glycosides in MO leaf extracts.
| Sample | G1 | Gluco Moringin | Gluco Tropaeolin | G2 | G3 | G4 | G5 | G6 | Total Cyanogenic Glucosides |
|---|---|---|---|---|---|---|---|---|---|
| India_dried | 1.76 ± 0.30c | 7.81 ± 1.23b | 0.53 ± 0.11a | 0.47 ± 0.09b | 4.64 ± 0.76d | 0.49 ± 0.08d | 0.27 ± 0.03d | 0.18 ± 0.04c | 35.50 ± 2.64a |
| Paraguay_dried | 1.94 ± 0.21c | 11.67 ± 0.82a | 0.60 ± 0.36a | 0.13 ± 0.03d | 4.17 ± 0.31d | 3.45 ± 0.27a | nd | nd | 21.95 ± 1.88bc |
| Mozambique_dried | 3.002 ± 0.28b | 7.06 ± 0.61b | 0.53 ± 0.11a | 0.39 ± 0.05b | 2.59 ± 0.30f | 3.88 ± 0.30a | nd | nd | 17.46 ± 1.62d |
| Pakistan_dried | 1.79 ± 0.24c | 2.90 ± 0.24e | 0.35 ± 0.04b | 0.30 ± 0.03c | 2.29 ± 0.20f | 0.45 ± 0.03d | nd | nd | 8.08 ± 0.75e |
| Just moringa | 4.63 ± 0.31a | 7.69 ± 0.42b | 0.62 ± 0.06a | 0.49 ± 0.03b | 3.51 ± 0.19e | 2.32 ± 0.13b | 0.31 ± 0.03d | nd | 19.56 ± 1.11c |
| WISSA | 3.24 ± 0.16b | 7.79 ± 0.25b | 0.74 ± 0.14a | 0.28 ± 0.02c | 3.51 ± 0.1e | 0.45 ± 0.03d | 0.14 ± 0.02e | nd | 16.14 ± 0.70d |
| India_fresh | 1.35 ± 0.05d | 8.05 ± 0.84b | 0.23 ± 0.10d | 1.99 ± 0.03a | 19.09 ± 0.41a | 0.36 ± 0.05e | 1.37 ± 0.09c | 2.07 ± 0.18a | 34.50 ± 0.68a |
| Paraguay_fresh | 3.04 ± 0.24b | 5.93 ± 0.24c | 0.41 ± 0.10b | 2.02 ± 0.23a | 6.46 ± 0.14c | nd | 2.68 ± 0.16a | 1.85 ± 0.14ab | 22.39 ± 0.88b |
| Mozambico_fresh | 1.74 ± 0.08c | 10.82 ± 0.43a | 0.17 ± 0.03d | 1.96 ± 0.05a | 17.71 ± 0.65b | 0.35 ± 0.02e | 1.39 ± 0.11c | 1.57 ± 0.14b | 35.70 ± 1.25a |
| Pakistan_fresh | 1.87 ± 0.07c | 3.11 ± 0.06d | 0.26 ± 0.06d | 1.93 ± 0.07a | 5.89 ± 0.08d | 0.62 ± 0.01c | 1.64 ± 0.09b | 1.66 ± 0.16b | 16.98 ±0.21d |
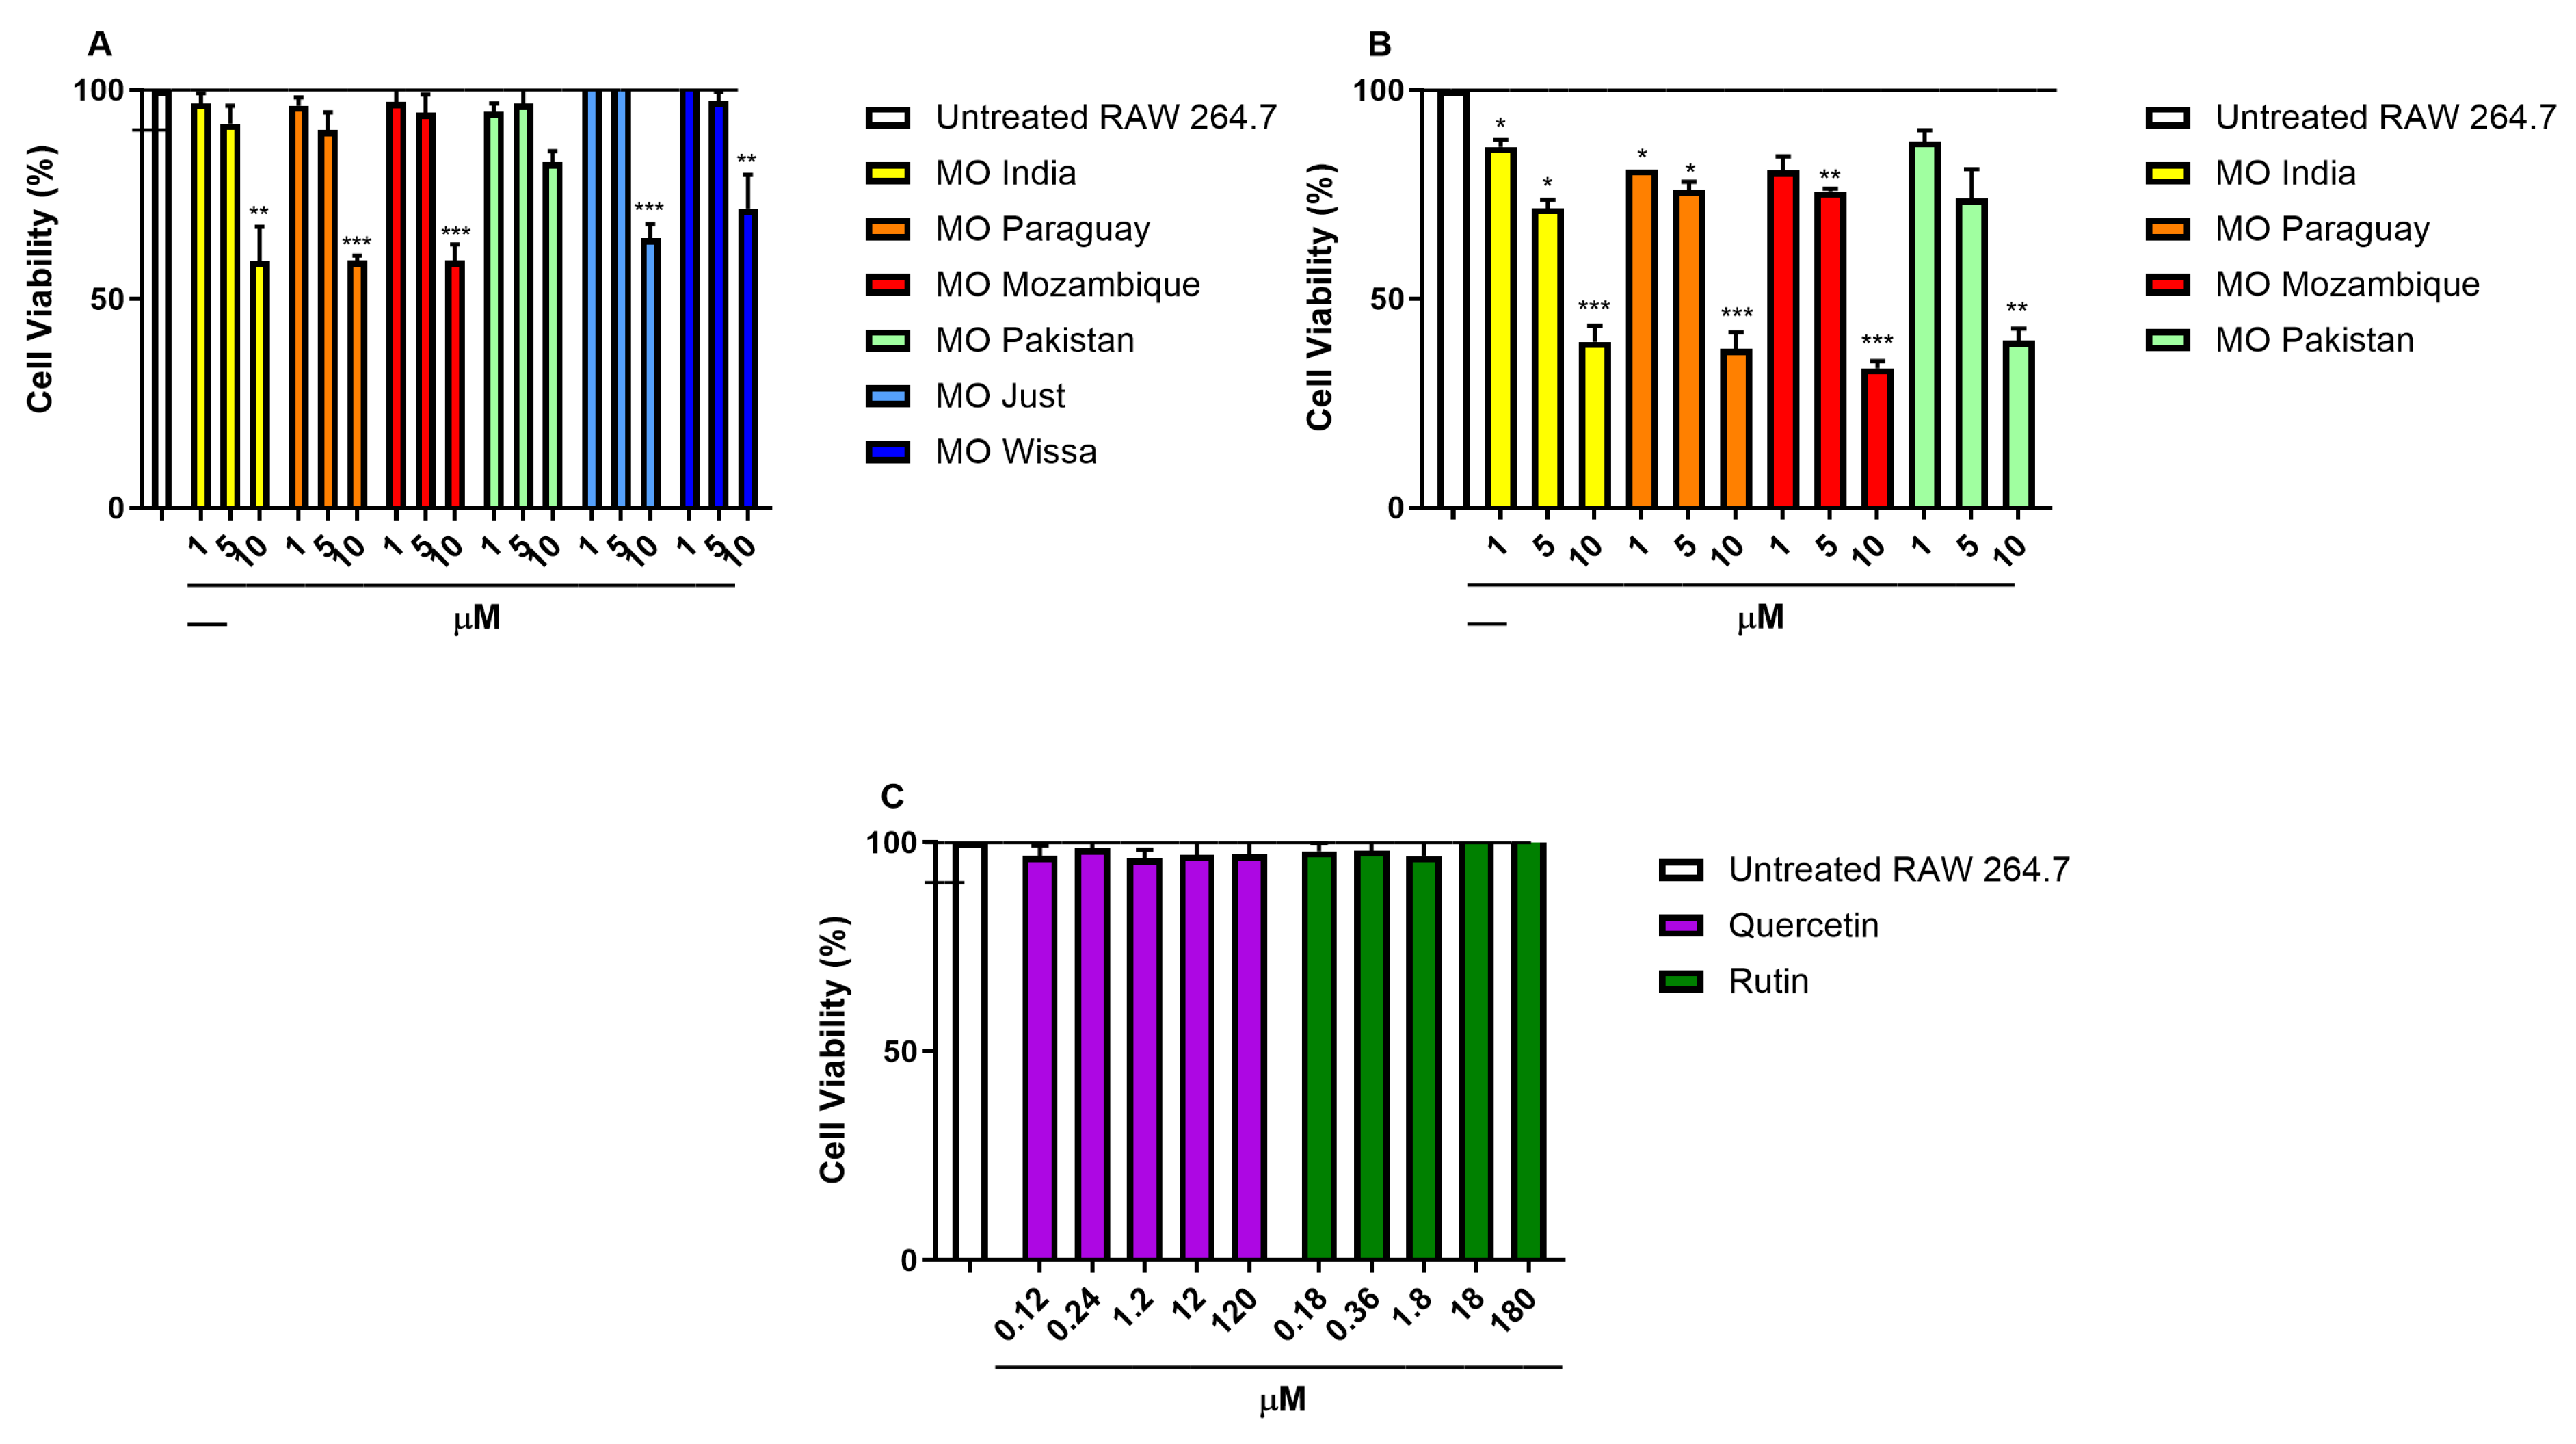
Figure 1: Effect of different extracts from dried (A), fresh (B) MO leaves and of pure compounds (C) on RAW 264.7 viability. *p < 0.05, **p < 0.01 and ***p < 0.001 vs. unexposed cells by one-way ANOVA and Dunnett’s multiple comparisons test. Data are expressed as mean ± SEM of three independent experiments.
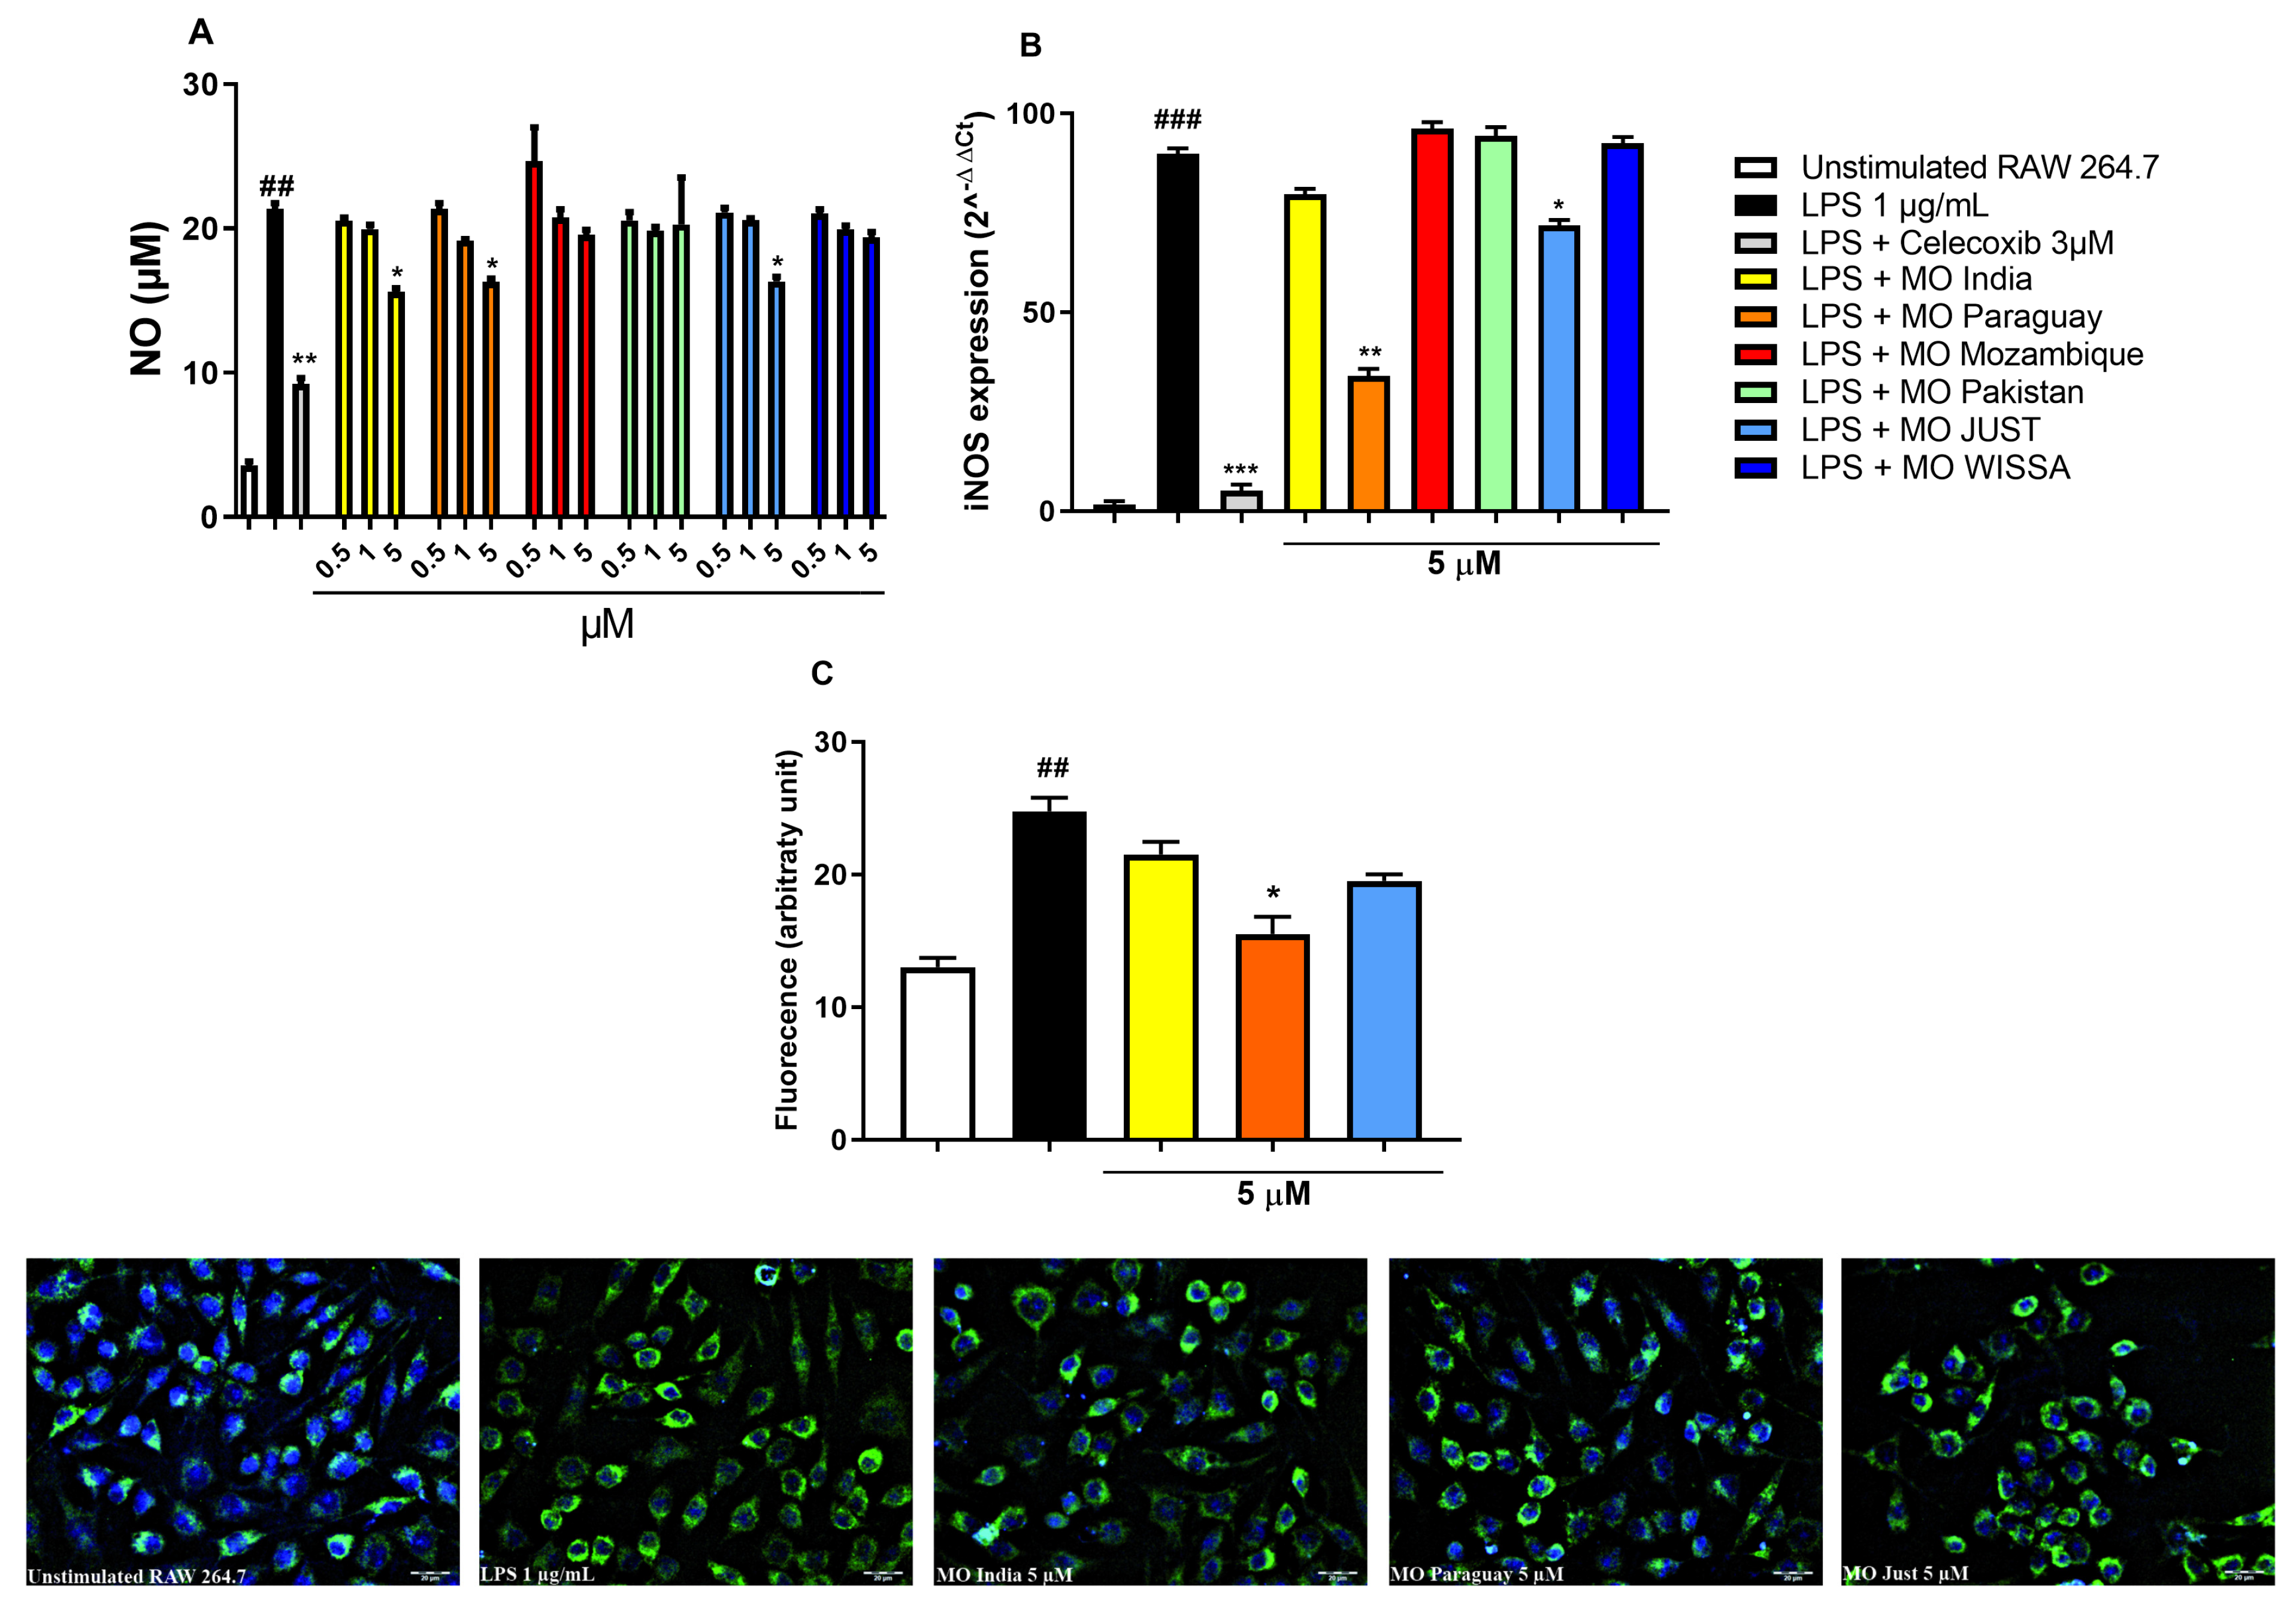
Figure 2: Effect of ethanolic extracts from MO leaves or celecoxib on nitric oxide (NO) release (A), inducible nitric oxide synthase (iNOS) gene (B) and protein (C) expression in RAW 264.7 macrophages stimulated with 1 μg/mL lipopolysaccharide (LPS) for 18 h. ##p < 0.01 and ###p < 0.001 vs. unstimulated RAW 264.7 cells. *p < 0.05, **p < 0.01 and ***p < 0.001 vs. LPS by one-way ANOVA and Dunnett’s multiple comparisons test; Data are expressed as the mean ± SEM of three independent experiments.
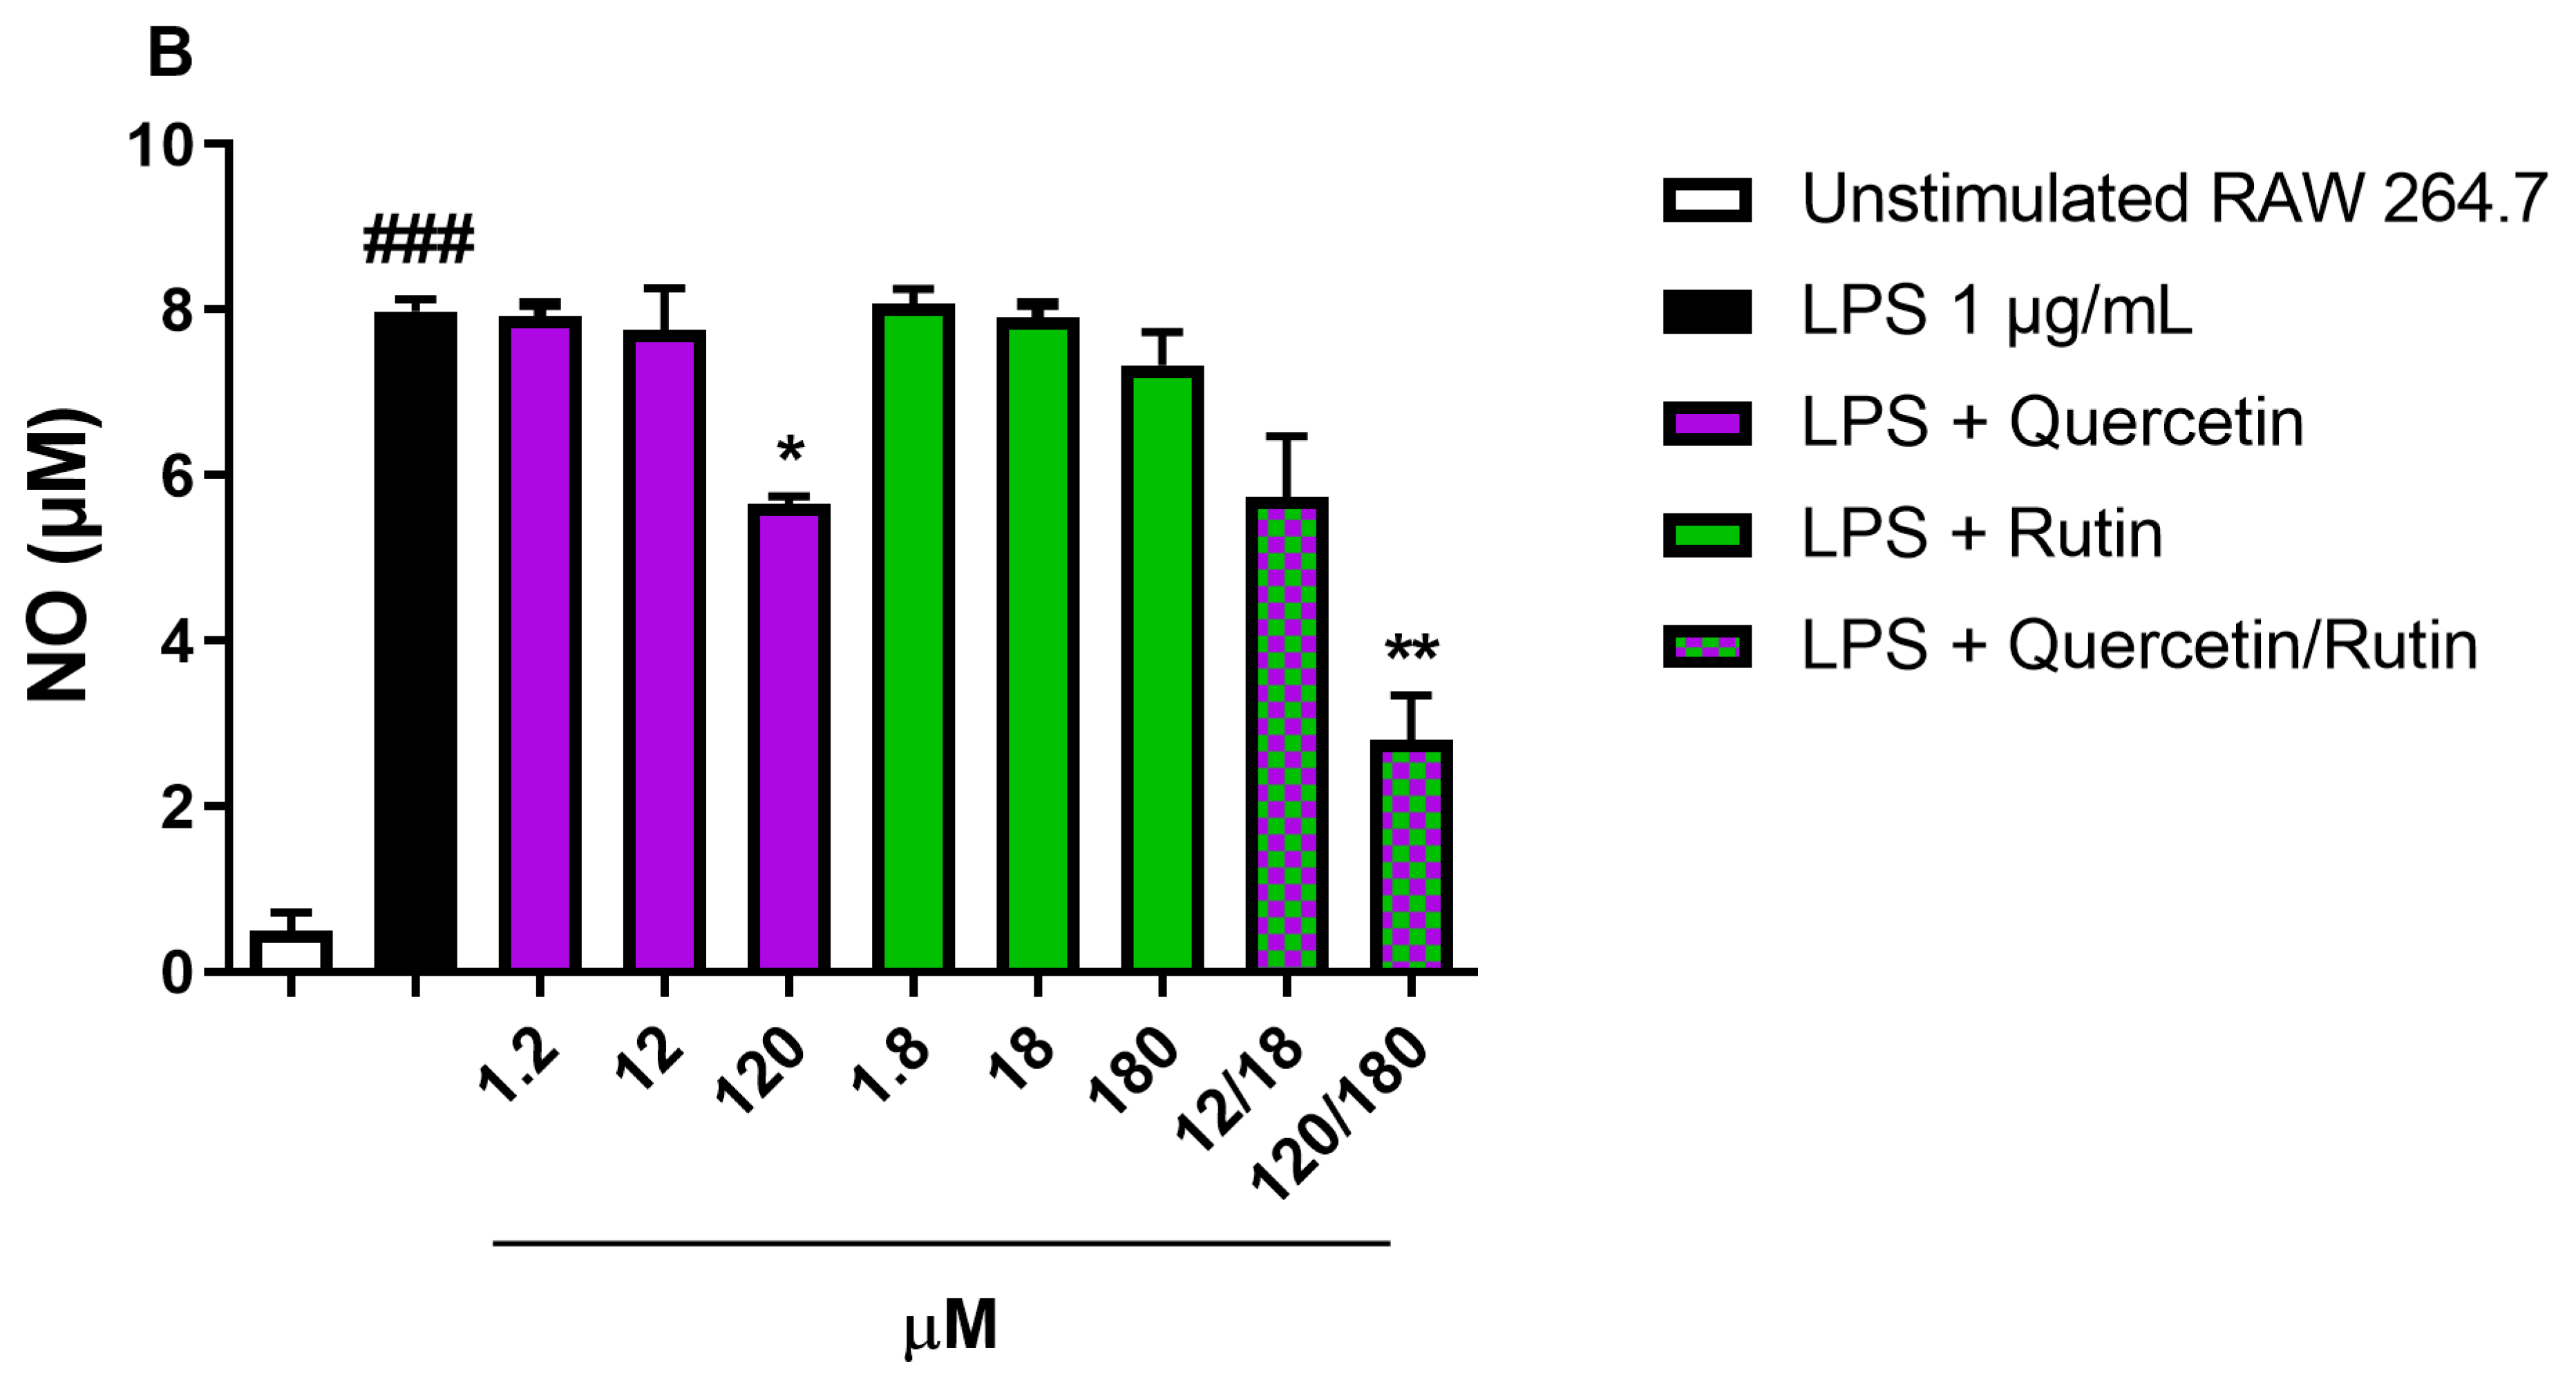
Figure 3: Effect of Quercetin-3-O-glucoside and Rutin tested at the same concentrations observed in the ethanolic extracts and at higher concentrations on NO release in RAW 264.7 stimulated with LPS 1 μg/mL for 18 h. ###p < 0.001 vs. unstimulated RAW 264.7 cells. *p < 0.05 and **p < 0.01 vs. LPS by one-way ANOVA and Dunnett’s Multiple Comparisons test; Data are expressed as mean ± SEM of three independent experiments.
The total phenolic content in the ethanolic extracts ranged from 25 and 36 μmol·g−1 DW and the most abundant compounds were caffeic acid, apigenin, quercetin and kaempferol derivatives (Table 2 and Table S1, Fig. S1). Differences among the polyphenolic profiles of different MO ecotypes were observed: extracts from dried leaves of India and Paraguay were richer in quercetin and caffeic acid derivatives while Mozambique, Pakistan and Just Moringa (one of the two commercial powders) had the highest amount of kaempferol derivatives.
The analysis allowed us to identify eight different cyanogenic glycosides: glucomoringin, glucotropaeolin and further 6 compounds (named G1–G6). Glucotropaeolin was found at low concentration, probably because it is present in higher quantities in seeds than in leaves [14], while the compounds G3 and glucomoringin were the most abundant cyanogenic glycosides in all the extracts. In the fresh samples, the ecotype with the highest content of glucomoringin was Mozambique, while in dried samples it was Paraguay. The highest amount of total cyanogenic glycosides was found in fresh leaves of Mozambique and India ecotypes (Table 2 and Fig. S2).
As reported in Fig. 1, extracts from the two commercial powders and from dried MO leaves reduced cell viability at concentration of 10 μM of total phenolic compounds (Fig. 1A) while were not toxic at lower concentrations. On the contrary, extracts from fresh leaves (Fig. 1B) were 19–43% more cytotoxic when tested at the same concentrations.
To investigate the basis of this differential cytotoxicity, we determined the levels of cyanogenic glycosides, known components of MO leaves [14,15]. Cyanogenic glycosides were detected in all extracts and those from fresh leaves were particularly rich in compounds G2, G3, G5 and G6 (Table 3).
Due to the elevated cytotoxicity of the fresh leaf extracts, no further experiments were conducted. Based on the MTS results, we selected 5 μM as the highest non-toxic concentration to be used in additional experiments.
LPS-treatment significantly stimulated NO production in RAW 264.7 cells (p < 0.01) (Fig. 2A). This effect was significantly counteracted by exposing the cells to Celecoxib 3 μM, a well-known anti-inflammatory drug (p < 0.01). MO extracts from India, Paraguay and Just Moringa were able to counteract NO production only at the highest concentration tested (p < 0.05) while other MO extracts (Mozambique, Pakistan and WISSA) had no effect at any concentration tested.
MO extracts from Paraguay and Just Moringa were able to significantly reduce LPS-induced iNOS gene overexpression (p < 0.01 and p < 0.05, respectively) (Fig. 2B). Immunofluorescence staining for iNOS protein revealed that LPS-treatment significantly increased the iNOS protein expression (p < 0.01) (Fig. 2C): only MO extract from Paraguay was able to significantly counteract this effect (p < 0.05), while Just Moringa reduced iNOS protein overexpression without reaching statistical significance (Fig. 2C). At 5 μM of total phenolic compounds, none of the extracts tested showed effects on COX-2 gene expression and on PGE2 release (data not shown).
To better understand which molecules were mainly responsible of the effects previously observed, we tested two quercetin derivatives, more abundant in the most effective MO leave extract (Paraguay). Quercetin-3-O-glucoside and Rutin did not show effects on cells viability at any concentration tested (Fig. 1C).
As reported in Fig. 3, Quercetin-3-O-glucoside and Rutin, at the concentrations found in the Paraguay extract (1.2 μM and 1.8 μM, respectively) had no effect on LPS-induced NO production. When we increased the concentration up to 100 times, only Quercetin-3-O-glucoside was able to reduce NO production (p < 0.05). The greatest reduction in NO production was observed when we combined Quercetin-3-O-glucoside and Rutin at the highest concentration tested (120 μM and 180 μM, respectively; p < 0.01).
The present study aimed to compare the phytochemical composition and anti-inflammatory activity of ethanolic extracts obtained from fresh and dried leaves of four Moringa oleifera ecotypes (India, Paraguay, Mozambique, and Pakistan), all cultivated under the same outdoor conditions in Sesto Fiorentino, near Florence. The rationale for investigating different ecotypes is based on previous evidence demonstrating high genetic variability and phenotypic plasticity within M. oleifera, which are key factors for adaptation to diverse environmental conditions and may lead to differences in biological activity [13].
HPLC analyses revealed that the accumulation of polyphenolic compounds in MO leaves is largely determined by genetic factors, as distinct ecotypes retained different polyphenolic profiles despite being grown under identical environmental conditions [14,15]. Consistent with our findings, previous studies have highlighted the intrinsic variability among M. oleifera ecotypes in their responses to abiotic stresses, emphasizing the importance of genetic diversity for species adaptation [13]. Regarding the two commercial powders, Just Moringa and WISSA, their origin is unknown; however, phytochemical characterization suggests that their profiles differ from those of the cultivated ecotypes. While their overall polyphenolic compositions were similar, Just Moringa contained higher levels of kaempferol derivatives than WISSA.
Extracts obtained from fresh MO leaves exhibited significantly greater cytotoxicity than those derived from dried leaves, likely due to differences in cyanogenic glucoside content. These nitrogen-containing secondary metabolites are involved in hydrogen cyanide production, a well-established plant defense mechanism against herbivores [16]. Several studies have reported their antiproliferative and growth-inhibitory effects both in vitro and in vivo [17,18]. Moreover, a recent report highlighted potential toxicity associated with MO consumption, including anemia linked to hydrogen cyanide production, which led the Brazilian Health Regulatory Agency (ANVISA) to ban its use as a food product [19,20].
The anti-inflammatory activity of the extracts was markedly influenced by their polyphenolic composition. Ethanolic extracts from the Paraguay ecotype and Just Moringa—both enriched in quercetin derivatives and caffeic acids—were the most effective in counteracting activation of the pro-inflammatory iNOS–NO axis [21].
Despite the presence of caffeic acids, none of the extracts significantly reduced COX-2 expression or PGE2 levels. Reported inhibitory effects of caffeic acids on COX-2 generally occur at concentrations higher than those used in the present study and often require pretreatment [22,23]. It is therefore plausible that effects observed at higher concentrations are mainly attributable to the antioxidant and free radical-scavenging properties of polyphenols, whereas modulation of intracellular signaling pathways may be more relevant at lower concentrations. In addition, compound bioavailability may be influenced by the nature of sugar moiety, as previously demonstrated in studies on the antiproliferative activity of quercetin derivatives, where the presence of rutinose or rhamnose attenuated quercetin-induced apoptosis [24]. The contribution of other bioactive constituents present in the extracts cannot be excluded. Notably, the Paraguay extract was also the richest in glucomoringin, which has demonstrated anti-inflammatory activity in several experimental models, primarily through its hydrolysis product, glucomoringin isothiocyanate [25]. Furthermore, these effects may be enhanced by synergistic interactions between glucosinolates and quercetin derivatives, as previously reported for Camelina sativa extracts [26].
Because the main difference between active and inactive MO extracts targeting the iNOS–NO axis was the concentration of quercetin derivatives, we evaluated the effects of two representative compounds: quercetin-3-O-glucoside and rutin (quercetin-3-O-rutinoside). Neither compound exhibited anti-inflammatory effects at concentrations comparable to those present in the ethanolic extracts (1.2 and 1.8 μM). Significant inhibition of NO production was observed only at higher concentrations and when the compounds were combined. Consistent with previous reports, the anti-inflammatory activity of quercetin typically occurs at concentrations ranging from 25 to 100 μM [27,28,29]. These findings support the hypothesis that the anti-inflammatory activity of MO extracts is primarily attributable to the phytocomplex rather than to individual constituents. Using a similar experimental approach, we previously demonstrated that a methanolic extract of the marine microalga Tisochrysis lutea exerted stronger anti-inflammatory effects than fucoxanthin alone [11].
Growing evidence supports the concept that phytocomplexes may exert greater preventive and therapeutic effects than isolated compounds, particularly when they simultaneously modulate multiple molecular targets and/or act through additive or synergistic mechanisms [11]. Furthermore, given that previous genetic analyses revealed significant differences between the India and Paraguay ecotypes [13], our results reinforce the importance of considering ecotypic variability in studies investigating the in vivo activity of phytocomplexes. Future studies should therefore consider potential ecotype-dependent effects when evaluating additional pharmacological properties of M. oleifera extracts.
Overall, our findings demonstrate that the phenolic profiles of Moringa oleifera leaves from different ecotypes grown under the same environmental conditions remain distinct, at least in the first generation of plants grown from seeds of different origins. We also show that the ecotype-dependent polyphenolic phytocomplex significantly influences anti-inflammatory activity. In vitro toxicity data further indicate that products containing fresh leaves require careful safety evaluation. Altogether, these results underscore the importance of reporting both the origin and phytochemical composition of MO-based products, as their bioactivity and safety profiles cannot be generalized.
Acknowledgement:
Funding Statement: The authors received no specific funding for this study.
Author Contributions: Conceptualization, all authors; methodology, Elisabetta Bigagli, Mario D’Ambrosio, Cecilia Brunetti, Lorenzo Cinci and Cristina Luceri; validation, Elisabetta Bigagli, Mario D’Ambrosio and Lorenzo Cinci; formal analysis, Mario D’Ambrosio, Elisabetta Bigagli and Cristina Luceri; investigation, Mario D’Ambrosio, Lorenzo Cinci and Cecilia Brunetti; resources, Cristina Luceri, Cecilia Brunetti, Edgardo Giordani and Francesco Ferrini; writing—original draft preparation, Mario D’Ambrosio, Elisabetta Bigagli and Cristina Luceri; writing—review and editing, all authors; supervision, Cristina Luceri; funding acquisition, Cristina Luceri. All authors reviewed the results and approved the final version of the manuscript.
Availability of Data and Materials: All the data that supports the findings of this study are available in the article or its Supplementary Materials.
Ethics Approval: Not applicable.
Conflicts of Interest: The authors declare no conflicts of interest to report regarding the present study.
Supplementary Materials: The supplementary material is available online at https://www.techscience.com/doi/10.32604/phyton.2026.073250/s1.
References
1. Padayachee B , Baijnath H . An overview of the medicinal importance of Moringaceae. J Med Plants Res. 2012; 6( 48): 5831– 9. doi:10.5897/JMPR12.1187. [Google Scholar] [CrossRef]
2. Sena LP , Vanderjagt DJ , Rivera C , Tsin AT , Muhamadu I , Mahamadou O , et al. Analysis of nutritional components of eight famine foods of the Republic of Niger. Plant Foods Hum Nutr. 1998; 52( 1): 17– 30. doi:10.1023/a:1008010009170. [Google Scholar] [CrossRef]
3. Anwar F , Latif S , Ashraf M , Gilani AH . Moringa oleifera: a food plant with multiple medicinal uses. Phytother Res. 2007; 21( 1): 17– 25. doi:10.1002/ptr.2023. [Google Scholar] [CrossRef]
4. Nouman W , Basra SMA , Siddiqui MT , Yasmeen A , Gull T , Alcayde MAC . Potential of Moringa oleifera L. as livestock fodder crop: a review. Turk J Agric For. 2014; 38: 1– 14. doi:10.3906/tar-1211-66. [Google Scholar] [CrossRef]
5. Hufford KM , Mazer SJ . Plant ecotypes: genetic differentiation in the age of ecological restoration. Trends Ecol Evol. 2003; 18( 3): 147– 55. doi:10.1016/S0169-5347(03)00002-8. [Google Scholar] [CrossRef]
6. Hamanishi ET , Barchet GLH , Dauwe R , Mansfield SD , Campbell MM . Poplar trees reconfigure the transcriptome and metabolome in response to drought in a genotype- and time-of-day-dependent manner. BMC Genom. 2015; 16( 1): 329. doi:10.1186/s12864-015-1535-z. [Google Scholar] [CrossRef]
7. Ashraf MA , Iqbal M , Rasheed R , Hussain I , Riaz M , Arif MS . Environmental stress and secondary metabolites in plants: an overview. In: Ahmad P , Ahanger MA , Singh VP , Tripathi DK , Alam P , Alyemen MN , editors. Plant metabolites and regulation under environmental stress. Amsterdam, The Netherlands: Academic Press; 2018. doi:10.1016/B978-0-12-812689-9.00008-X. [Google Scholar] [CrossRef]
8. Pandey KB , Rizvi SI . Plant polyphenols as dietary antioxidants in human health and disease. Oxid Med Cell Longev. 2009; 2( 5): 270– 8. doi:10.4161/oxim.2.5.9498. [Google Scholar] [CrossRef]
9. Vergara-Jimenez M , Almatrafi MM , Fernandez ML . Bioactive components in Moringa Oleifera leaves protect against chronic disease. Antioxidants. 2017; 6( 4): 91. doi:10.3390/antiox6040091. [Google Scholar] [CrossRef]
10. Bigagli E , Cinci L , Paccosi S , Parenti A , D’Ambrosio M , Luceri C . Nutritionally relevant concentrations of resveratrol and hydroxytyrosol mitigate oxidative burst of human granulocytes and monocytes and the production of pro-inflammatory mediators in LPS-stimulated RAW 264.7 macrophages. Int Immunopharmacol. 2017; 43: 147– 55. doi:10.1016/j.intimp.2016.12.012. [Google Scholar] [CrossRef]
11. Bigagli E , D’Ambrosio M , Cinci L , Niccolai A , Biondi N , Rodolfi L , et al. A comparative in vitro evaluation of the anti-inflammatory effects of a Tisochrysis lutea extract and fucoxanthin. Mar Drugs. 2021; 19( 6): 334. doi:10.3390/md19060334. [Google Scholar] [CrossRef]
12. Azlan UK , Mediani A , Rohani ER , Tong X , Han R , Misnan NM , et al. A comprehensive review with updated future perspectives on the ethnomedicinal and pharmacological aspects of Moringa oleifera. Molecules. 2022; 27( 18): 5765. doi:10.3390/molecules27185765. [Google Scholar] [CrossRef]
13. Brunetti C , Gori A , Moura BB , Loreto F , Sebastiani F , Giordani E , et al. Phenotypic plasticity of two M. oleifera ecotypes from different climatic zones under water stress and re-watering. Conserv Physiol. 2020; 8( 1): 1– 15. doi:10.1093/conphys/coaa028. [Google Scholar] [CrossRef]
14. Te L , Sin A , Amonum J , Et T , Agbidye FS . Phytochemical properties of Ceiba petandra (kapok tree), Moringa oleifera (moringa) and Cymbopogon citratus (lemon grass) collected from a home garden in Igbor, Gwer East, Benue State, Nigeria. Int J Complement Altern Med. 2020; 13( 2): 62– 7. doi:10.15406/ijcam.2020.13.00494. [Google Scholar] [CrossRef]
15. Bennett RN , Mellon FA , Foidl N , Pratt JH , Dupont MS , Perkins L , et al. Profiling glucosinolates and phenolics in vegetative and reproductive tissues of the multi-purpose trees Moringa oleifera L. (horseradish tree) and Moringa stenopetala L. J Agric Food Chem. 2003; 51( 12): 3546– 53. doi:10.1021/jf0211480. [Google Scholar] [CrossRef]
16. Divekar PA , Narayana S , Divekar BA , Kumar R , Gadratagi BG , Ray A , et al. Plant secondary metabolites as defense tools against herbivores for sustainable crop protection. Int J Mol Sci. 2022; 23( 5): 2690. doi:10.3390/ijms23052690. [Google Scholar] [CrossRef]
17. Kitic D , Miladinovic B , Randjelovic M , Szopa A , Sharifi-Rad J , Calina D , et al. Anticancer potential and other pharmacological properties of Prunus armeniaca L.: an updated overview. Plants. 2022; 11( 14): 1885. doi:10.3390/plants11141885. [Google Scholar] [CrossRef]
18. Oluwaniyi OO , Obi BC . Phytochemical, anti-nutritional and toxicity assessment of Moringa oleifera seeds, stem bark and leaves using brine shrimp (artemia salina) assay. Jordan J Chem. 2018; 13( 3): 171– 8. [Google Scholar]
19. Asare GA , Gyan B , Bugyei K , Adjei S , Mahama R , Addo P , et al. Toxicity potentials of the nutraceutical Moringa oleifera at supra-supplementation levels. J Ethnopharmacol. 2012; 139( 1): 265– 72. doi:10.1016/j.jep.2011.11.009. [Google Scholar] [CrossRef]
20. Anvisa Gov.br—Brazil Services and Information. 2019 [cited 2025 Jan 1]. Available from: https://www.gov.br/anvisa/pt-br/assuntos/noticias-anvisa/2019/proibidosalimentos-com-moringa-oleifera. [Google Scholar]
21. Paikra BK , Dhongade HKJ , Gidwani B . Phytochemistry and pharmacology of Moringa oleifera Lam. J Pharmacopunct. 2017; 20( 3): 194– 200. doi:10.3831/KPI.2017.20.022. [Google Scholar] [CrossRef]
22. Yang WS , Jeong D , Yi YS , Park JG , Seo H , Moh SH , et al. IRAK1/4-targeted anti-inflammatory action of caffeic acid. Mediat Inflamm. 2013; 2013( 1): 518183. doi:10.1155/2013/518183. [Google Scholar] [CrossRef]
23. Jang G , Lee S , Hong J , Park B , Kim D , Kim C . Anti-inflammatory effect of 4,5-dicaffeoylquinic acid on RAW264.7 cells and a rat model of inflammation. Nutrients. 2021; 13( 10): 3537. doi:10.3390/nu13103537. [Google Scholar] [CrossRef]
24. You HJ , Ahn HJ , Ji GE . Transformation of rutin to antiproliferative quercetin-3-glucoside by Aspergillus niger. J Agric Food Chem. 2010; 58( 20): 10886– 92. doi:10.1021/jf102871g. [Google Scholar] [CrossRef]
25. Zhang T , Zhao L , Xu M , Jiang P , Zhang K . Moringin alleviates DSS-induced ulcerative colitis in mice by regulating Nrf2/NF-κB pathway and PI3K/AKT/mTOR pathway. Int Immunopharmacol. 2024; 134: 112241. doi:10.1016/j.intimp.2024.112241. [Google Scholar] [CrossRef]
26. Das N , Berhow MA , Angelino D , Jeffery EH . Camelina sativa defatted seed meal contains both alkyl sulfinyl glucosinolates and quercetin that synergize bioactivity. J Agric Food Chem. 2014; 62( 33): 8385– 91. doi:10.1021/jf501742h. [Google Scholar] [CrossRef]
27. Kim OK , Murakami A , Nakamura Y , Ohigashi H . Screening of edible Japanese plants for nitric oxide generation inhibitory activities in RAW 264.7 cells. Cancer Lett. 1998; 125( 1–2): 199– 207. doi:10.1016/s0304-3835(97)00513-2. [Google Scholar] [CrossRef]
28. Liang YC , Huang YT , Tsai SH , Lin-Shiau SY , Chen CF , Lin JK . Suppression of inducible cyclooxygenase and inducible nitric oxide synthase by apigenin and related flavonoids in mouse macrophages. Carcinogenesis. 1999; 20( 10): 1945– 52. doi:10.1093/carcin/20.10.1945. [Google Scholar] [CrossRef]
29. Anand David AV , Arulmoli R , Parasuraman S . Overviews of biological importance of quercetin: a bioactive flavonoid. Pharmacogn Rev. 2016; 10( 20): 84– 9. doi:10.4103/0973-7847.194044. [Google Scholar] [CrossRef]
Cite This Article
 Copyright © 2026 The Author(s). Published by Tech Science Press.
This work is licensed under a Creative Commons Attribution 4.0 International License , which permits unrestricted use, distribution, and reproduction in any medium, provided the original work is properly cited.
 Downloads
 Citation Tools