
 Submit a Paper
 Propose a Special lssue
 Open Access
ARTICLE
An Optimized System of Random Forest Model by Global Harmony Search with Generalized Opposition-Based Learning for Forecasting TBM Advance Rate
1 School of Resources and Safety Engineering, Central South University, Changsha, 410083, China
2 School of Civil and Environmental Engineering, University of Technology Sydney, New South Wales, Australia
3 Centre for Advanced Modelling and Geospatial Information Systems, School of Civil and Environmental Engineering, Faculty of Engineering and Information Technology, University of Technology Sydney, New South Wales, Australia
4 Civil and Infrastructure Engineering Discipline, School of Engineering, Royal Melbourne Institute of Technology (RMIT), Melbourne, Victoria, 3001, Australia
* Corresponding Authors: Jian Zhou. Email: ,
(This article belongs to the Special Issue: Meta-heuristic Algorithms in Materials Science and Engineering)
Computer Modeling in Engineering & Sciences 2024, 138(3), 2873-2897. https://doi.org/10.32604/cmes.2023.029938
Received 15 March 2023; Accepted 20 July 2023; Issue published 15 December 2023
 View Full Text
 Download PDF
Abstract
As massive underground projects have become popular in dense urban cities, a problem has arisen: which model predicts the best for Tunnel Boring Machine (TBM) performance in these tunneling projects? However, performance level of TBMs in complex geological conditions is still a great challenge for practitioners and researchers. On the other hand, a reliable and accurate prediction of TBM performance is essential to planning an applicable tunnel construction schedule. The performance of TBM is very difficult to estimate due to various geotechnical and geological factors and machine specifications. The previously-proposed intelligent techniques in this field are mostly based on a single or base model with a low level of accuracy. Hence, this study aims to introduce a hybrid random forest (RF) technique optimized by global harmony search with generalized opposition-based learning (GOGHS) for forecasting TBM advance rate (AR). Optimizing the RF hyper-parameters in terms of, e.g., tree number and maximum tree depth is the main objective of using the GOGHS-RF model. In the modelling of this study, a comprehensive database with the most influential parameters on TBM together with TBM AR were used as input and output variables, respectively. To examine the capability and power of the GOGHS-RF model, three more hybrid models of particle swarm optimization-RF, genetic algorithm-RF and artificial bee colony-RF were also constructed to forecast TBM AR. Evaluation of the developed models was performed by calculating several performance indices, including determination coefficient (R2), root-mean-square-error (RMSE), and mean-absolute-percentage-error (MAPE). The results showed that the GOGHS-RF is a more accurate technique for estimating TBM AR compared to the other applied models. The newly-developed GOGHS-RF model enjoyed R2 = 0.9937 and 0.9844, respectively, for train and test stages, which are higher than a pre-developed RF. Also, the importance of the input parameters was interpreted through the SHapley Additive exPlanations (SHAP) method, and it was found that thrust force per cutter is the most important variable on TBM AR. The GOGHS-RF model can be used in mechanized tunnel projects for predicting and checking performance.Keywords
The population is growing at a rapid pace, which necessitates countries setting the stage for development, particularly in sectors such as tunnel construction and underground spaces. In the process of constructing a tunnel, two methods are commonly used by engineers: tunnel boring machine (TBM) and drilling-blasting [1]. The drilling-blasting method has been well-recognized as a highly workable method with relatively low costs and high efficiency; however, this traditional method can adversely affect the rock-mass around the excavation area and the adjacent environment [2–5].
In recent decades, many projects involving tunnel construction have implemented TBMs. This excavation method is becoming increasingly popular, particularly in the case of projects within dense urban regions with low excavation depth and high levels of risk induced by the external loading of neighboring structures [6,7]. The implementation of TBMs in tunnel construction projects has a number of advantages, including a higher advance rate, lower labour intensity, controlling the stability of the adjacent rock masses, not creating ground vibration and undesirable cavities, being safer for workers to work with, higher efficiency, etc., [8–12]. On the other hand, TBM suffers from sensitivity to geological conditions; in adverse geological situations, TBM cannot work in a flexible way [13,14]. In fact, if there is any unknown geological information at the front of the tunnel face during the excavating operation, the performance of the TBM may be reduced [15]. Although these machines have been designed to work in different ground conditions, their performance level in complex geological conditions is still a great challenge for practitioners and researchers since the users are not able to change the relevant TBM specifications for different ground conditions [2,16,17]. For that reason, to effectively control the efficiency of any tunnel construction operation, it is of high importance and advantage to accurately predict the TBM’s performance in complex geological conditions [18–21].
The prediction of TBM performance such as penetration rate and advance rate (AR) has been considered a vital task for many researchers. Some researchers proposed empirical equations for the aforementioned task [22] using a single parameter or a combination of several factors related to TBM specifications and/or rock properties. However, a low and moderate level of prediction performance has been reported for the proposed empirical equations [20]. This may have different reasons, such as considering only one or two important relevant parameters [23]. Apart from these techniques, statistical-based models that work on the basis of mathematical rules have been used by some other researchers to predict TBM performance [18]. However, since TBM performance and its mechanism are highly nonlinear problems, the statistical techniques are not effective enough. In addition, their level of accuracy in this regard is just average, which is not good for the mentioned problem [20].
With the rapid advancement of artificial intelligence (AI) technology, an increasing number of machine learning (ML) techniques have been introduced into various engineering applications [24–26], particularly in the fields of geotechnical engineering and geology. These cutting-edge techniques provide researchers and engineers with powerful tools, enabling them to analyze and predict critical parameters and performance in engineering projects more accurately. Recently, numerous researchers have suggested different AI and ML techniques for the evaluation of TBM performance [6,10,11,27–32]. For instance, five supervised learning models (i.e., chi-squared automatic interaction detection, classification and regression trees, artificial neural network (ANN), k-nearest neighbor (KNN), and support vector machine (SVM)) were used in the study conducted by Xu et al. [33] to predict the TBM penetration rate. The results of the five models were compared to each other, and KNN was found to be the optimum model for the task defined. In another investigation, with the use of the gene expression programming method, Armaghani et al. [17] attempted to determine an effective equation for the prediction of the TBM penetration rate during a case study on the excavation operations in a tunnel in Malaysia. They succeeded in achieving an acceptable performance prediction (i.e., a coefficient of determination, R2, of 0.850) for the TBM penetration rate. In addition, the group method of data handling was used by Koopialipoor et al. [34] as a soft computing model in order to estimate the TBM performance in tunnel excavating projects. An advanced ANN model (also referred to as deep neural network) was developed by Koopialipoor et al. [35] for the estimation of the TBM’s performance. The results showed 93% accuracy with the coefficient of determination, R2 = 0.934 and root-mean-square-error (RMSE = 0.032).
Furthermore, for the prediction of the TBM performance, Li et al. [9] used several AI techniques and big data when working on the case of the Yin-Song Diversion Project (China) with a tunnel of 72.1 km length. The TBM performance in their research was examined in real-time. They used the long short-term memory (LSTM) model with the aim of estimating the total thrust and cutter head torque of the TBM in a variety of geological settings. The obtained results showed that LSTM provided 84.99% and 83.96% of accuracy in thrust prediction and cutter head torque prediction, respectively. In another work, Zhang et al. [36] attempted to find out how different geological conditions affect the TBM performance (for instance, the cutterhead speed, cutterhead torque, AR, and thrust). To this end, they performed a study on a tunnel located in China with the use of AI techniques and big data. In similar research, Yu et al. [7] introduced a semi-supervised model for the prediction of the type of rock mass prior to the use of TBM for tunneling projects. To do this, they developed the stacked sparse autoencoder and deep neural network models. Their developed model attained a high level of accuracy; however, the stacked sparse autoencoder showed a disadvantage in comparison with deep neural networks, which was the higher computation cost. Some other techniques, such as genetic programming (GP), polynomial neural network, extreme gradient boosting, fuzzy and neuro-fuzzy, and Bayesian optimization have been used successfully in the literature in the area of TBM performance [10,27,30,37,38]. As a summary, it is important to mention that ML and AI algorithms have solved many problems in the various fields of science and engineering [39–43].
The literature presented above showed the implementation of AI and ML techniques in the prediction of geotechnical problems, especially in TBM projects for the prediction of TBM performance. However, many of the proposed models in this area are considered single or base intelligence techniques, and as a fact, the performance of base models can be improved using powerful optimization algorithms. According to the above reviews, this study aims to propose hybrid intelligent techniques where the base model is the random forest (RF). In this way, different heuristic algorithms, including the genetic algorithm (GA), artificial bee colony (ABC), particle swarm optimization (PSO), and global harmony search with generalized opposition-based learning (GOGHS), as powerful optimization techniques were selected. Therefore, four new models, i.e., GOGHS-RF, PSO-RF, GA-RF and ABC-RF are employed to predict the TBM AR in a variety of geological conditions. Then, the same models are evaluated and discussed to introduce the best RF-optimized technique in estimating TBM AR. These models are recognized as state-of-the-art intelligent control systems that can be effectively applied to tunnel construction projects.
Selangor is one of the most developed states in Malaysia and has the highest population density in the country. To this end, there is a large demand for water supply to support the residents in the area. The Pahang-Selangor Raw Water Transfer (PSRWT) project aims to divert water supply from Pahang to Selangor through the tunnel excavated using three TBMs. Of the total 44.6 km of tunnel distance, 39.4 km of tunnelling work has been excavated using the mentioned TBMs.
The PSRWT project has been undertaken in Peninsular Malaysia, located between Pahang and Selangor states. Pahang State is located to the east of Selangor State and has a lot of excess water resources in comparison with the state’s water demand. The objective of this project is to transfer 1890 million litres of water diverted from the Sematan River in Pahang to the South Klang Valley region in Selangor. The flow of the Sematan River is extracted to the reservoir by the pumping station next to the intake via a pipe to a connecting basin at the tunnel inlet. The connecting basin diverts the raw water to the outlet-connecting basin with the aid of gravity flow. Subsequently, the raw water will be transferred to the water treatment plant to purify it before it can be dispatched to the residents in the Klang Valley area. Fig. 1 shows the location of the PSRWT tunnel project in Peninsular Malaysia.
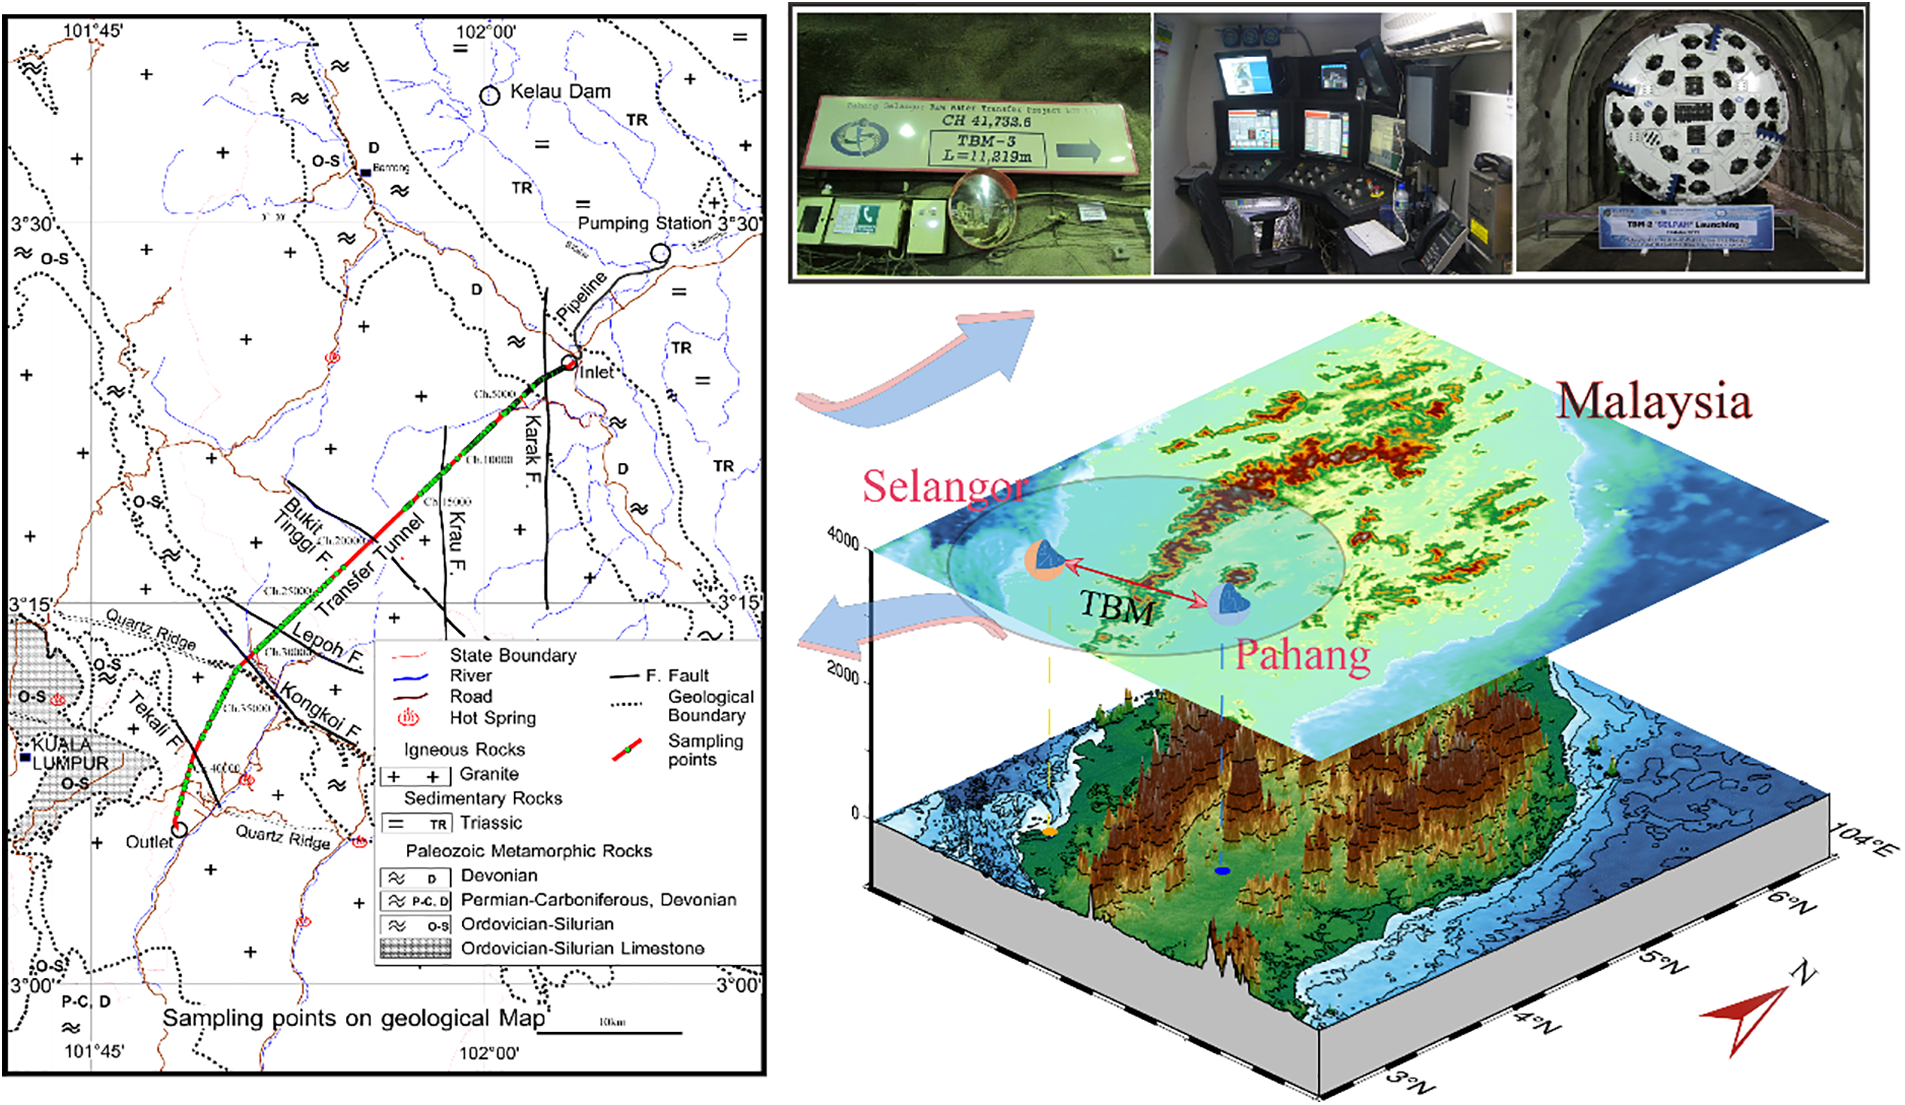
Figure 1: Location of the PSRWT tunnel project in Peninsular Malaysia Source: Resourced from [30]
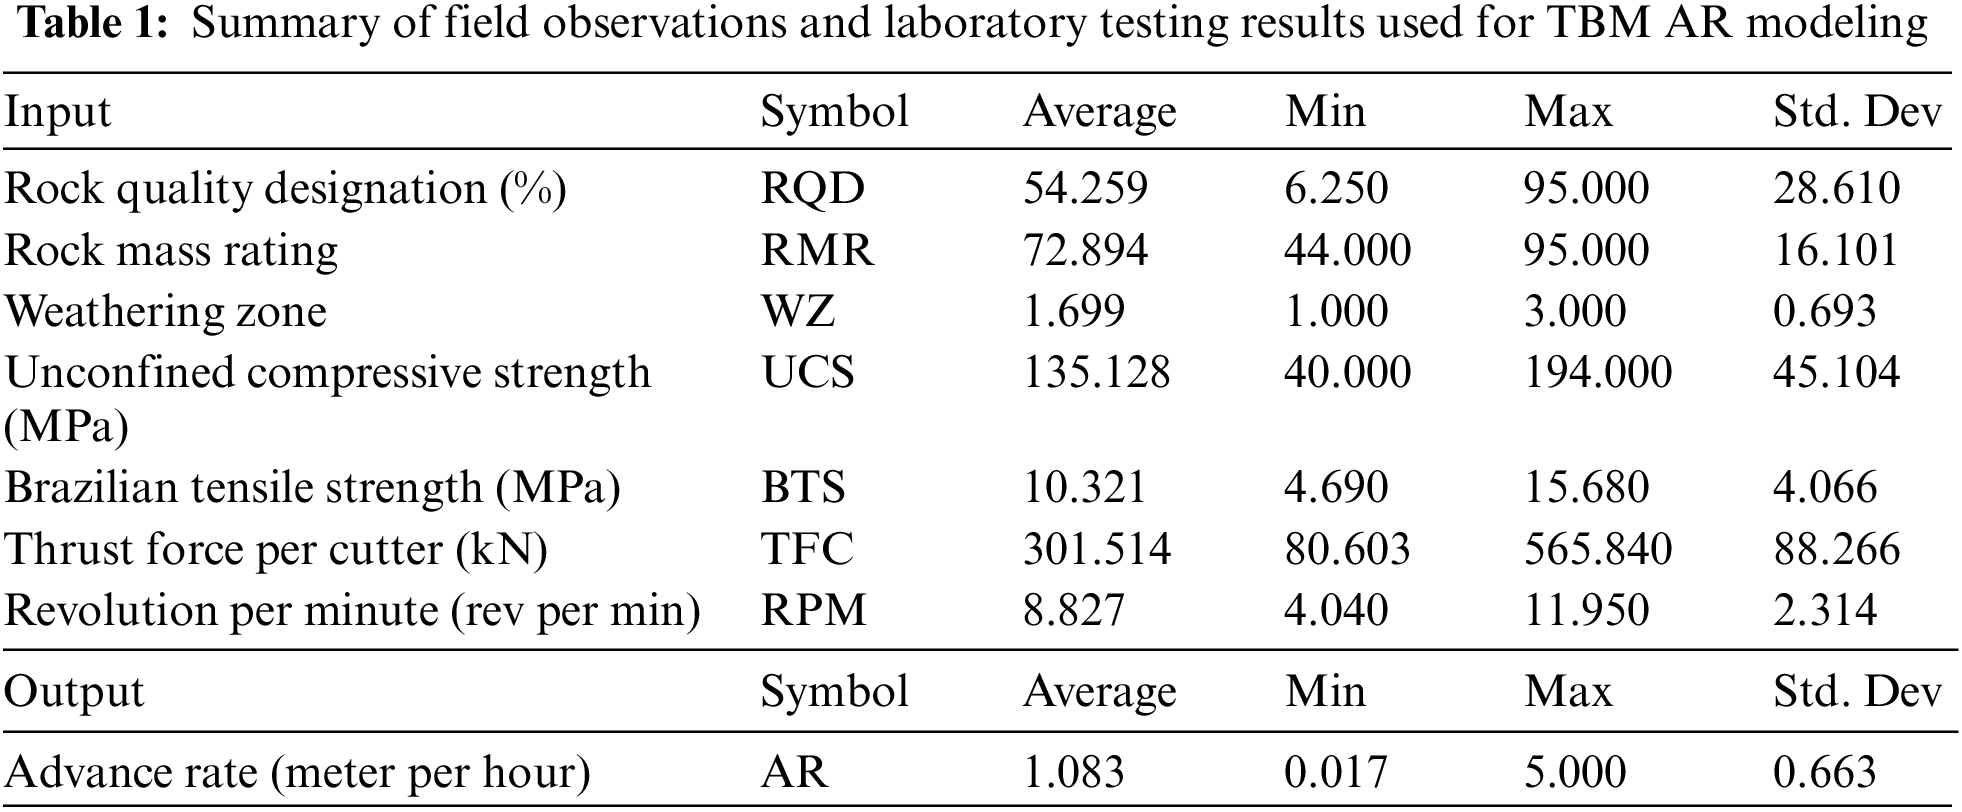
Field observation was done for the PSRWT project in the middle of 2013 to assess the rock mass properties along the alignment of the tunnel. Rock mass classification is an essential parameter to be assessed during the preliminary design or planning of the project [44]. During the field observation of the rock mass properties, several parameters, including rock quality designation (RQD), rock mass rating (RMR), and weathering zone (WZ), were observed. These rock mass properties were observed and recorded for each panel, which was an average of 10 m. Together with these parameters, rock material properties should be measured, as they are considered significant parameters for TBM performance estimation [45,46]. To do this, many block samples, which were of the granite type, were collected from the site. In the laboratory, uniaxial compressive strength (UCS) and Brazilian tensile strength (BTS) tests were conducted [47]. The geometry and sizing of the samples, together with testing procedures, are specified in the International Society for Rock Mechanics [48] and the same was used in this study. Apart from rock mass and material properties, machine (TBM) specifications need to be considered as effective factors in TBM performance prediction. Therefore, for each panel, thrust force per cutter (TFC) and revolution per minute (RPM) values, together with AR values, were recorded. In this way, the study considered the effects of all three important categories of the most significant features on machine performance, which are machine factors and material/mass properties of the rock. About 13 km of the mentioned tunnel were considered and observed during data collection for this project, and a total of 1286 data points were prepared for the purpose of TBM performance modelling and introducing an optimized RF technique in this field. Table 1 presents a summary of the parameters and data samples used in this study for the said purpose. In this table, values of 1–3 for WZ are referred to as fresh granite, slightly weathered granite, and moderately weathered granite, respectively. A number of seven parameters were selected, measured, and used as inputs in this research to forecast TBM AR values.
In addition, the binary continuous distribution of the seven input variables through the TBM AR cut, and the analysis of their outliers are clearly visible in the multivariate box line plot displayed in Fig. 2. According to this figure, all variables show no outliers when the AR values are in the range of 4–5 m/h. More information about the data used in this study can be found in the correlation matrix plot of the characteristic variables with the TBM AR (Fig. 3). Significantly high negative or positive values of the correlation coefficients between the variables may affect the performance of the mode. From Fig. 3, it is possible to know the relationship between AR and the pairwise correlation coefficients between the influencing variables, as well as the respective marginal frequency distributions. It can be observed that the parameter TFC (CC = 0.892) is highly correlated with AR.
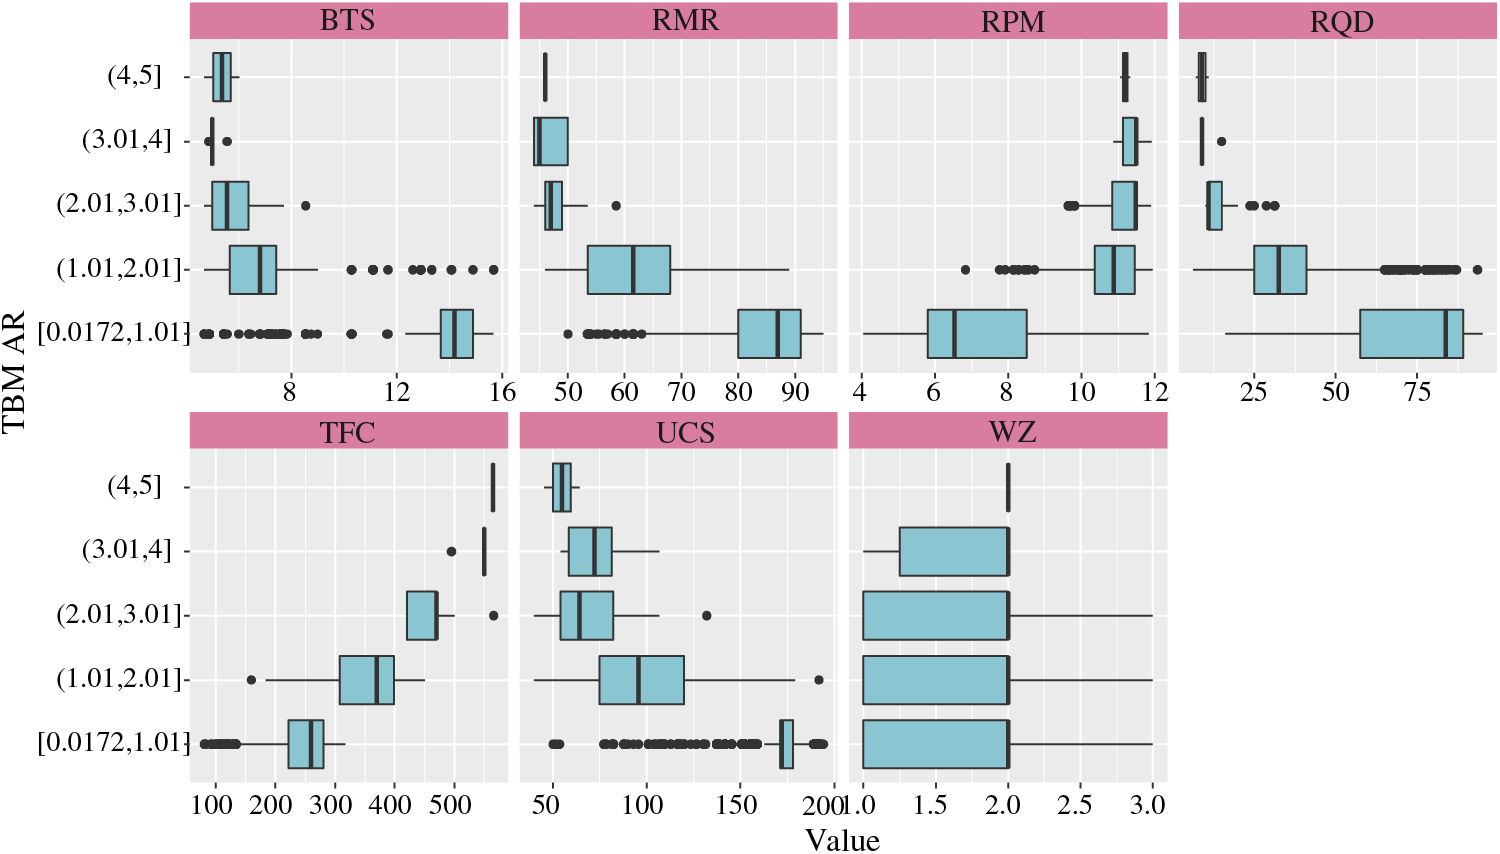
Figure 2: Binary continuous distribution of the seven input variables with system output
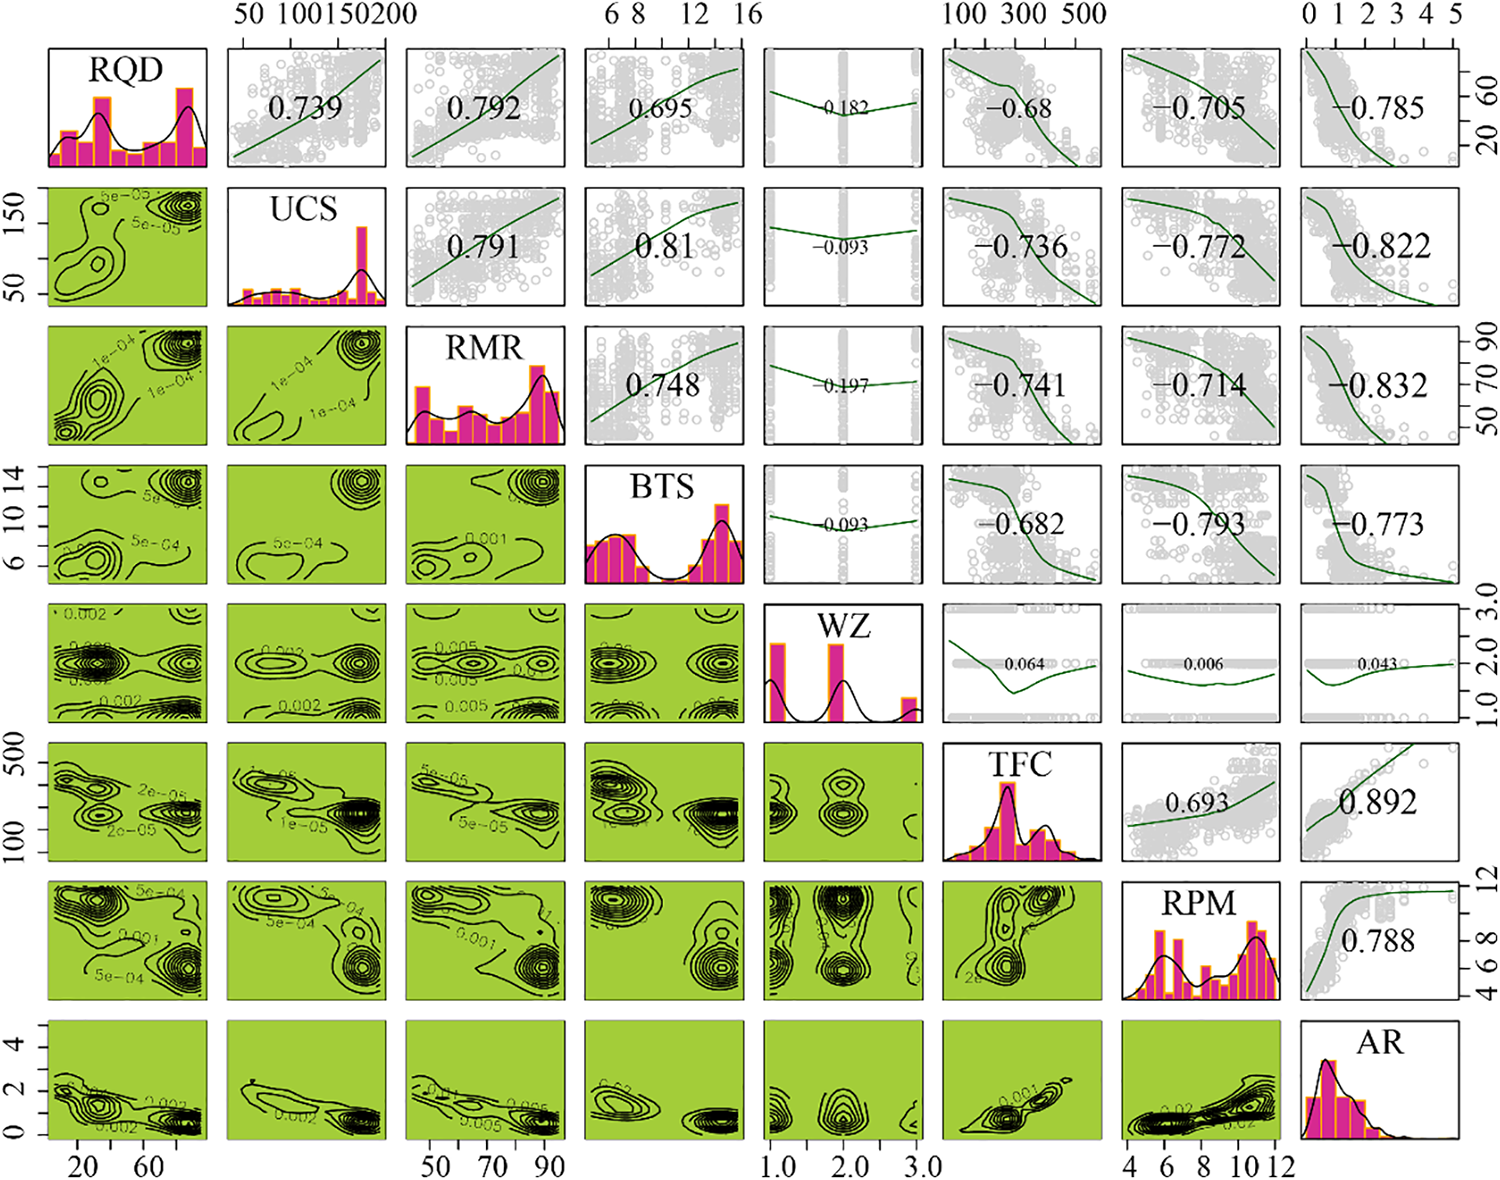
Figure 3: Correlation matrix plot of the characteristic variables with the TBM AR
3 GOGHS-RF for TBM AR Prediction
Harmony search (HS) is one of the meta-heuristic algorithms that simulates the procedure of harmony production [49]. Each harmony in HS represents a possible solution, and this algorithm will randomly generate HMS harmonies into the harmony memory (HM) during the running process (it is like population in GA or particle size in PSO). The initialized HM(t) is expressed as follows:
where,
where, the lower and upper bounds of the search space are presented by LBj and UBj, respectively.
After initialization, HS will enter the optimization loop, which mainly includes three search rules: pitch adjustment, random sampling, and memory consideration. Based on these three rules, four additional parameters need to be defined in HS, i.e., the harmony memory considering rate (HMCR), the pitch adjust rate (PAR), the bandwidth (BW) and the maximal iteration number (T). The function of these three search rules is to generate a new harmony vector
In the traditional HS algorithm, the search direction is random and unpredictable. Although this feature makes it more difficult for this algorithm to miss the real optimal answer in the search space, the excessively random search direction will greatly reduce the convergence speed of the algorithm and make it unable to deal with complex problems, effectively. When the practical problem is complex enough, an improved HS algorithm, called novel global HS (NGHS) [50], may be a more suitable choice than the traditional HS. Unlike the HS algorithm, which randomly selects harmony vectors from HM, the selected object of NGHS is always the best harmony vector existing in HM. In addition, NGHS introduces the probability of genetic mutation Pm to carry out genetic mutation operations, which is essentially similar to the process of random selection using the probability of 1-HMCR in HS [50].
The improved harmony search algorithm, NGHS, can greatly increase the exploitation capability of the overall model to meet the needs of the mentioned problems. However, to further improve the global search ability of the model, the generalized opposition-based learning (GOBL) plan is introduced, which was developed by Wang et al. [51]. An optimization framework combining GOBL and NGHS is built, which is the proposed GOGHS algorithm in this research [52]. There are two significant advantages to this framework. Firstly, it balances the relationship between the exploitation and exploration abilities of the HS algorithm. Secondly, it can effectively improve the probability of HS finding the optimal solution. The GOGHS core (i.e., the evolutionary process) consists of the following four steps [52].
Step 1. According to the running program of NGHS, GOGHS will first generate a new harmony V.
Step 2. Based on the GOGHS strategy, the generalized opposition-based solution OV (OV = [ov1, ov2, …, ovD]) corresponding to the candidate solution V will be generated. The expression of ovj is as follows:
where, k refers to the random generalized opposition-based factor. In Eq. (3), the maximum and minimum of the jth dimension are presented using
Once ovj goes beyond the range defined by LBj and UBj, the value of ovj will be expressed as follows:
Step 3. The third step is to evaluate V and OV and compare the advantages and disadvantages of these two solutions to select a better BV solution.
Step 4. When the search process goes to generation t, according to the information conveyed by the fitness function f(x) in GOGHS, there will be a worst solution
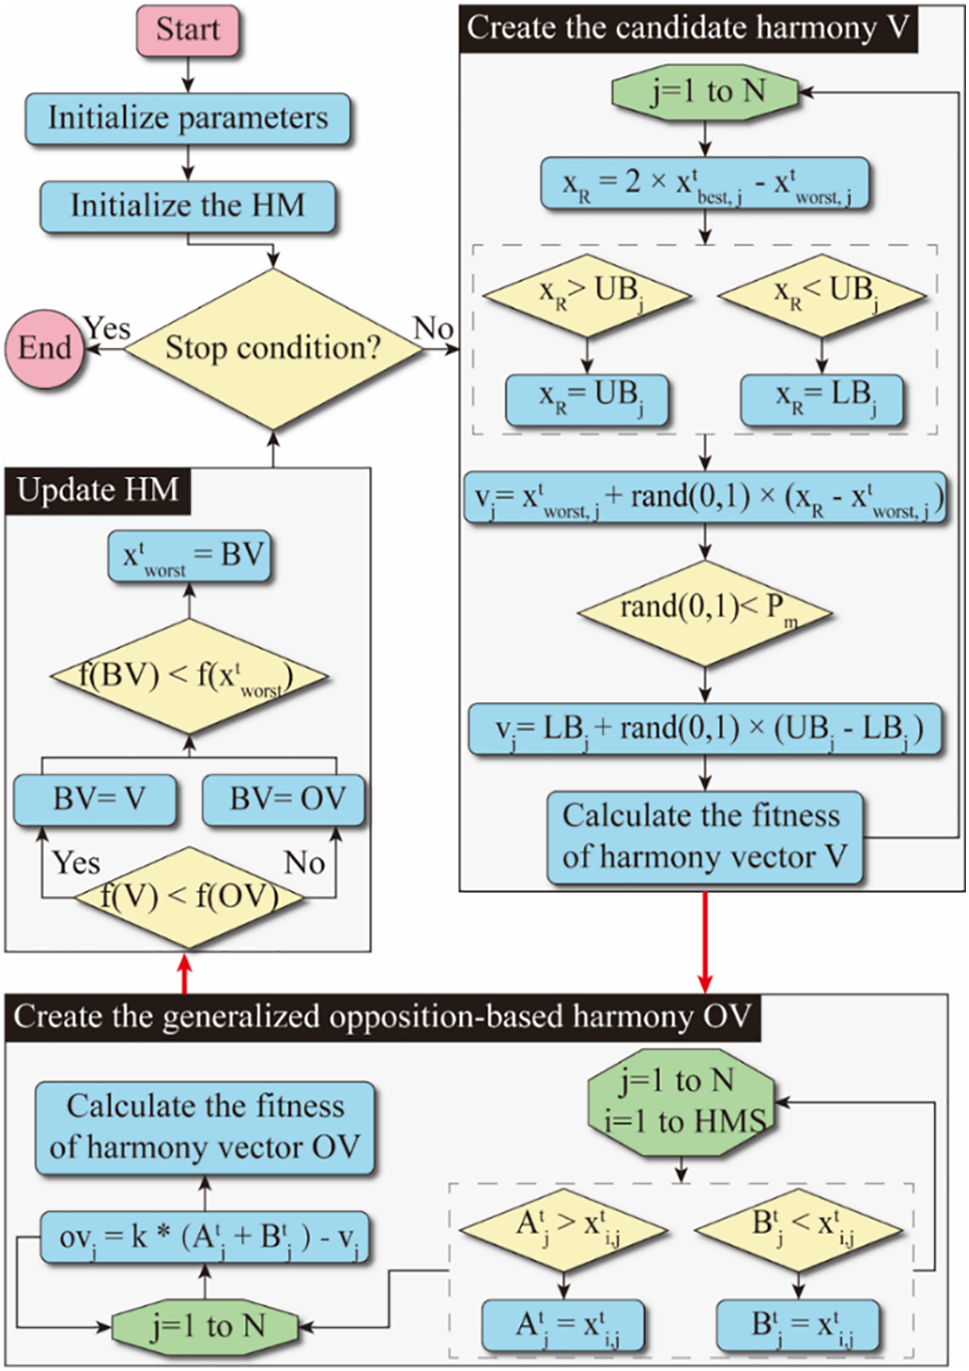
Figure 4: Framework of GOGHS algorithm
The decision tree is a simple and widely used model that branches by impurity calculation and can be used to deal with classification and regression problems. The Random Forest (RF) model is an integrated predictive algorithm proposed by Breiman [54] based on decision tree, which belongs to the integrated learning Bagging algorithm. Additionally, RF is considered an ensemble ML technique that utilizes a group of learners to apply their individual learning results to have a better result and performance. There are two types of ensemble learning: one is the boosting type, and the other is the bagging type. RF is a widely used bagging integration algorithm whose base evaluators are decision trees [54,55].
RF can improve the decision tree building and performance. For ordinary decision tree building, it selects an optimal feature among all sample features P on the node through the calculation to carry out the sub-tree partitioning. While RF is constructed by randomly selecting a part of the sample features n on the node (certainly, n is less than P) to construct the best partition. It can further enhance the generalization ability of the model and make it perform better. Finally, the computational results of the large number of decision trees constructed are comprehensively considered to obtain the final decision. The structural process of the RF model [56] is shown in Fig. 5.
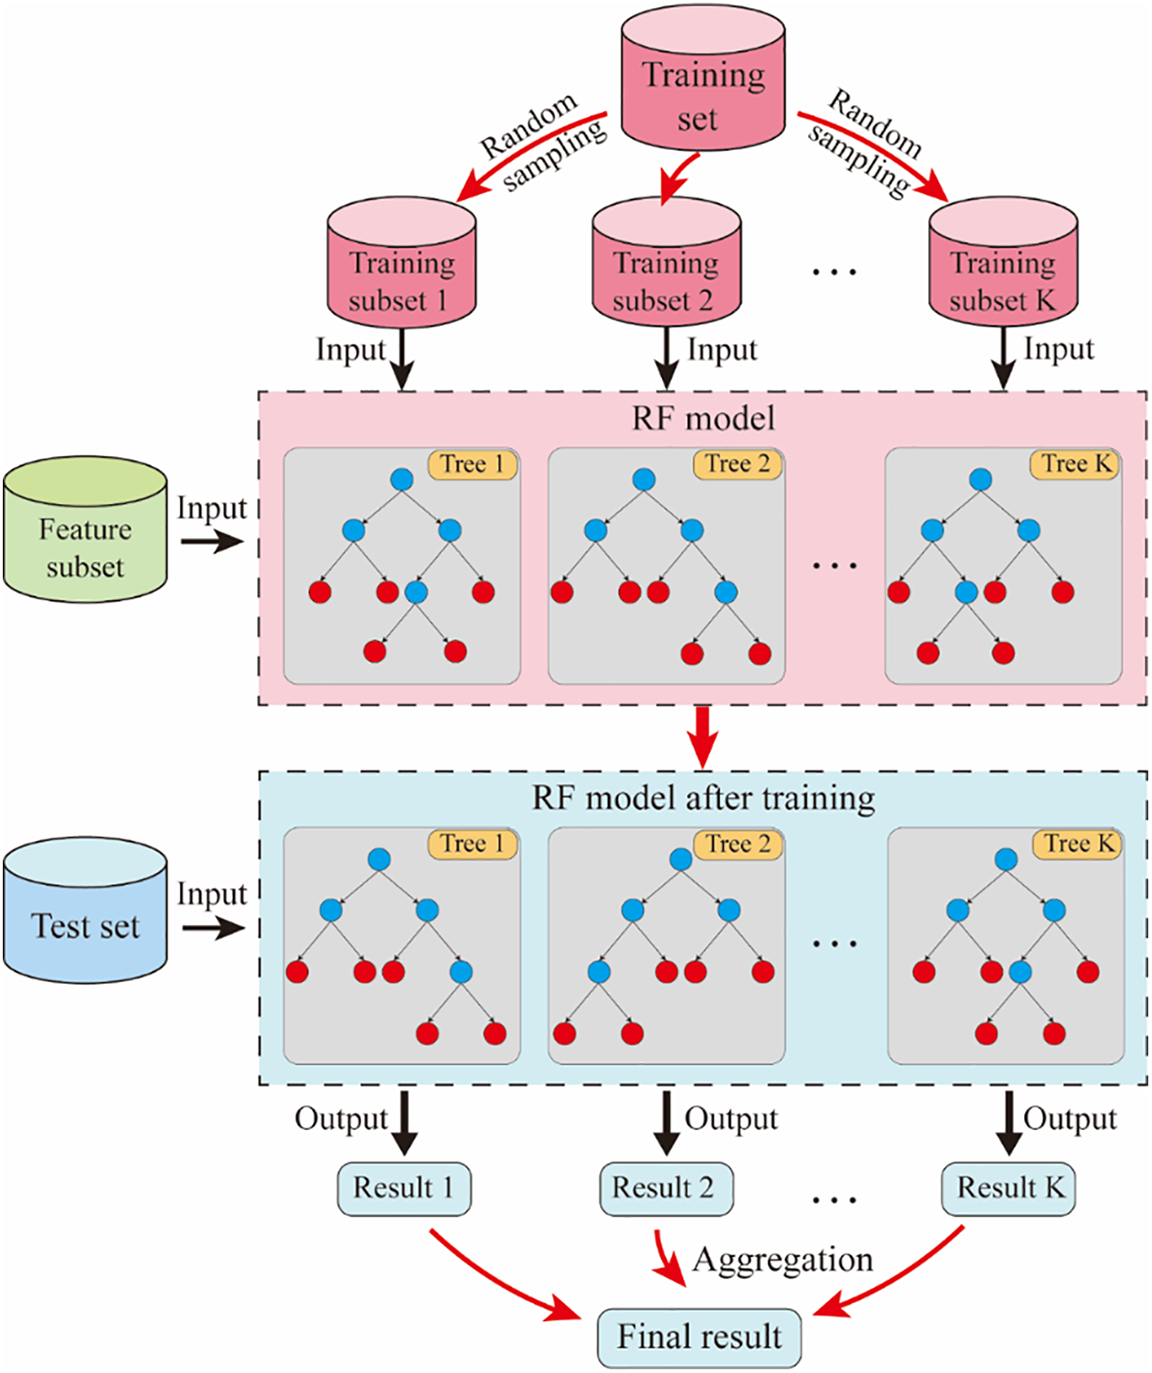
Figure 5: Structural process of RF model
3.3 GOGHS-Based RF for TBM AR Prediction
In this study, GOGHS was applied to the parameter optimization of the RF prediction model. PSO, GA, and ABC optimization approaches were also used for comparison purposes. The main process for using the mentioned approaches is as follows:
(i) Data division/preparation: In this stage, the entire dataset should be divided into model training data and model test data. The division ratio should be based on the suggestions from previous investigations.
(ii) Initialization parameters: Set the parameters of the optimization method.
(iii) Fitness evaluation and update parameters: Compute the fitness function and optimize its parameter values according to the fitness.
(iv) Status check: When the optimal shutdown requirements are met, the best parameters are obtained.
The study decided to use the relevant index determination coefficient (R2), root-mean-square error (RMSE), and mean absolute percentage error (MAPE) to assess the performance of the proposed models [14,57–59]. In regression, R2 is a statistical measure that the regression prediction is close to the true data point. R2 = 1 means that the regression prediction fits the data perfectly. RMSE is a measure of the size of the data prediction error. MAPE is a prediction accuracy index and 0% means that the model is perfect. In the following equation, where Xi−m is the measured AR value, Xi−p is the predicted AR value,
4.1 Models Performance Comparison and Analysis
The RF is highly effective for processing high-dimensional data and handling nonlinear problems. As each tree is constructed independently, RF is quite robust in identifying outliers and avoiding overfitting [54,55]. Additionally, it achieves superior predictive performance, outperforming many other similar predictive models [60].
To develop a hybrid TBM AR prediction model based on RF, this study combined the improved GOGHS meta-heuristic optimization method with RF and performed corresponding AR prediction tests. Then, according to the Pareto principle, the AR database in this study was randomly divided into two data sets at a division ratio of 80%/20%. 80% of the data was used for the TBM AR prediction training, and 20% of the data was used for the AR prediction test. This model considers the previously mentioned seven influencing factors (UCS, RQD, RPM, RMR, BTS, WZ, and TFC) as input parameters, with AR serving as the output parameter. According to the RF tuning experience and literature theoretical reference, this study selected the number of trees (n_estimators), the maximum tree depth (max_depth) and the minimum number of samples of leaf nodes (min_samples_leaf) as the three main parameters of the model for training. To evaluate the performance of the AR prediction models, performance indicators, i.e., RMSE, R2, and MAPE were used to evaluate the developed models.
As part of the model optimization, an exploration was conducted into the effect of population size, a crucial parameter in meta-heuristic algorithms [23]. Therefore, this study delves into the role of population size in influencing the performance of the GOGHS optimization method. For this purpose, population sizes of 20, 40, 80, 100, and 200 were selected for modeling the GOGHS-RF. Fig. 6 displays an iterative curve obtained based on the optimized fitness value corresponding to each population size. By the time the iteration reaches about 60, it becomes apparent that the fitness curves of different population sizes have reached their respective stable states. This pattern in Fig. 6 suggests that an optimal population size exists that would maximize the performance of the GOGHS-RF model. To further explore this concept, a performance comparison was carried out using different population sizes, with results detailed in Table 2. From this table, it is evident that the model’s performance for different population values was quite satisfactory. However, to determine the optimal population size, a further analysis of the comprehensive performance of all constructed models under different populations was conducted, as depicted in Fig. 7. The results, depicted in Fig. 7, make it clear that the optimal population size for the model is 100. The performance metrics for the model at this population size during the training and test stages were as follows: (R2 = 0.9937, RMSE = 0.0529, MAPE = 5.9810 for training, and R2 = 0.9844, RMSE = 0.081, MAPE = 11.8260 for testing).
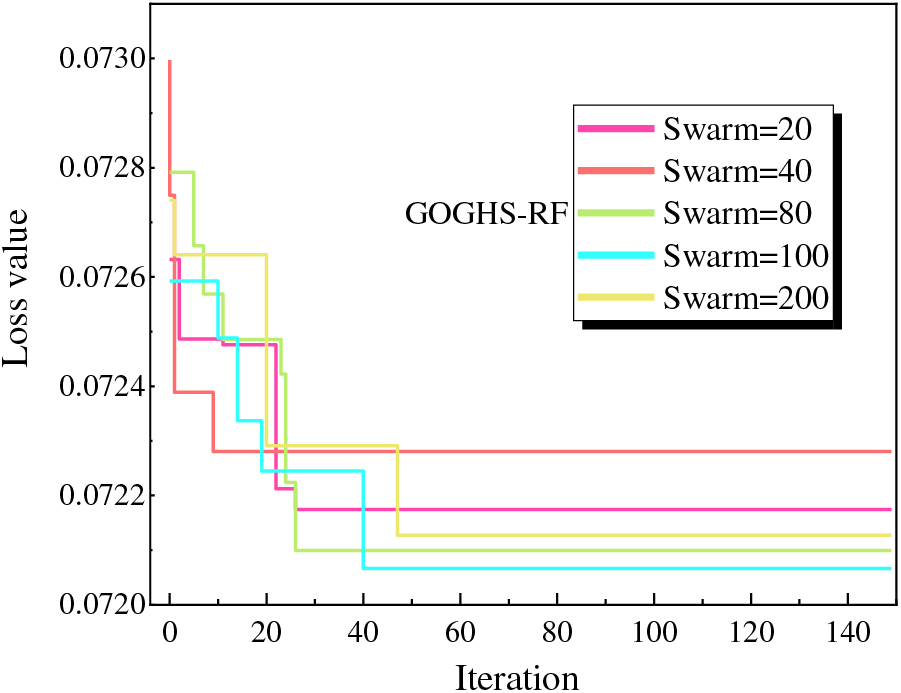
Figure 6: Fitness curves of GOGHS-RF model based on different population sizes
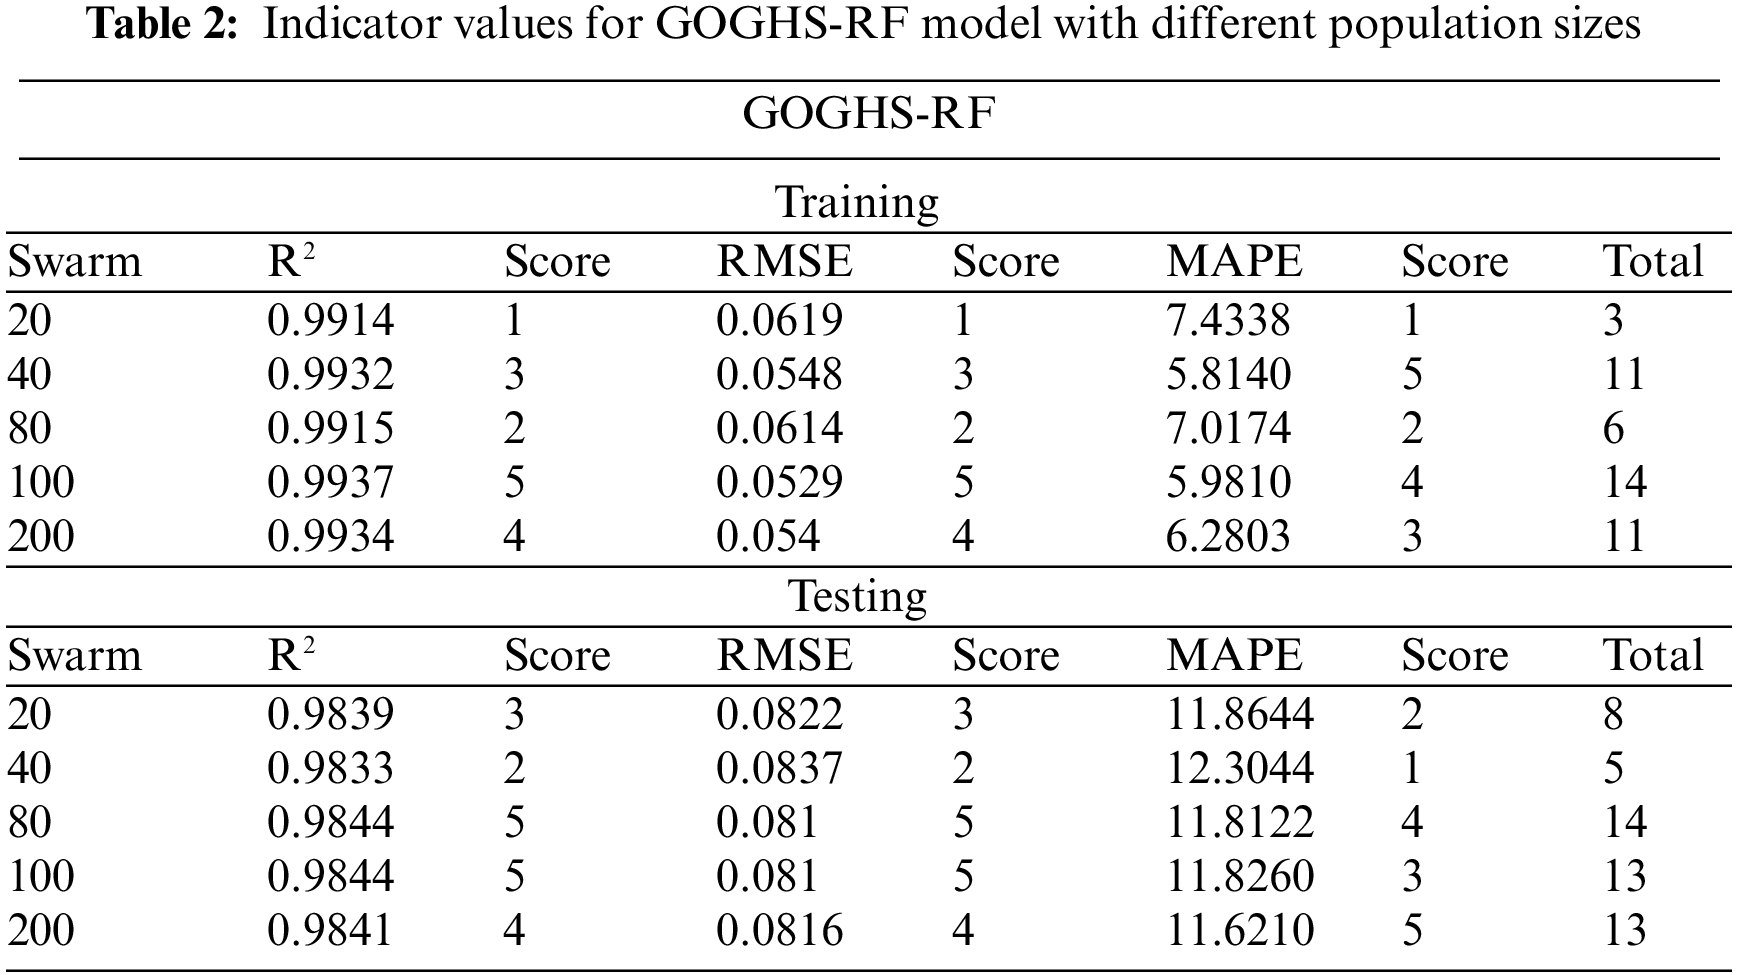
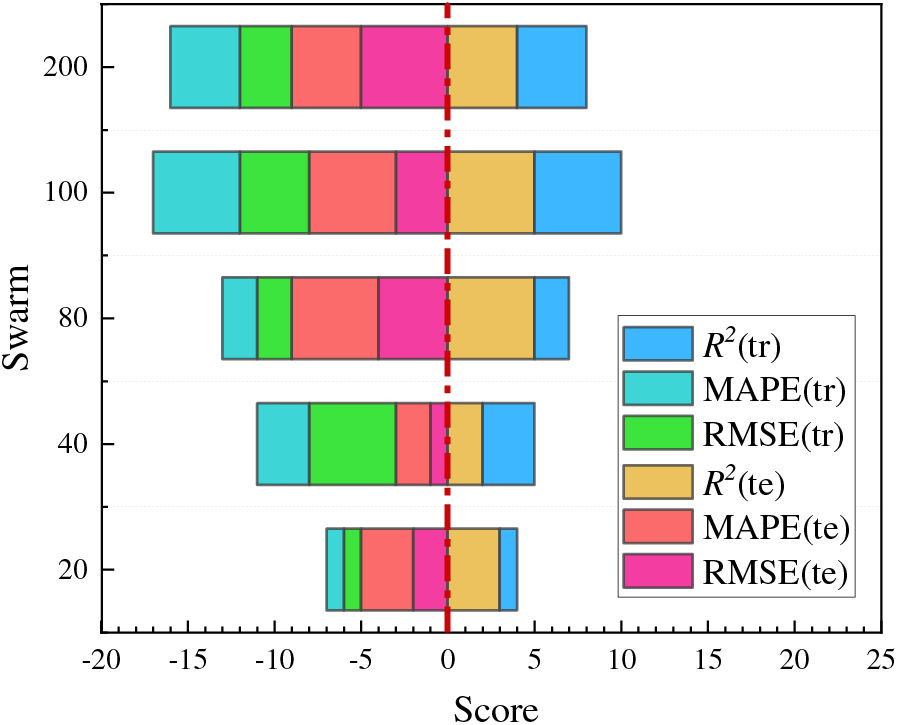
Figure 7: Cumulative scores with different population sizes of GOGHS-RF model
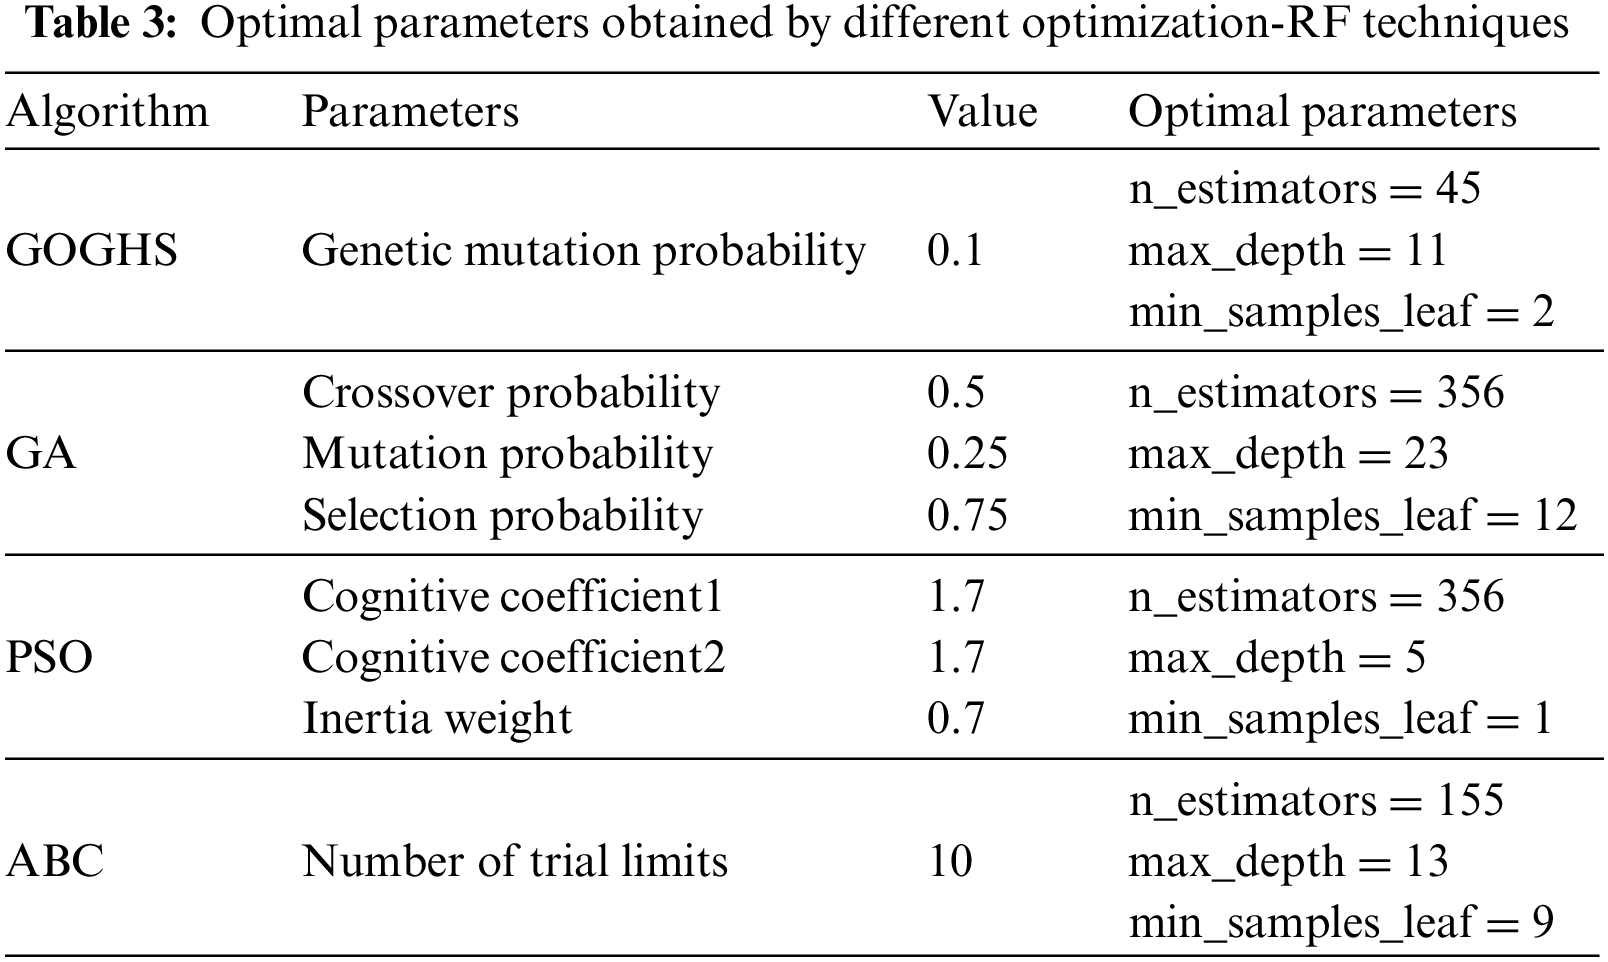
Building on the understanding of population size’s impact on the GOGHS-RF model, this research also developed three common RF-based meta-heuristic algorithm models for the same problem, namely GA-RF, ABC-RF, and PSO-RF. Then, the performance results of these optimized hybrid models and other single models were compared with the main predictive model in this study. It is worth noting that the modelling procedures of these optimization methods are not discussed in this article, and only their results are given. More details related to their modelling procedure and building are available in the original literatures. In all the above-mentioned hyper-parameter adjustment processes, a 5-fold cross-validation resampling technique was applied to increase model performance and reliability. The setting parameters of each optimization algorithm and their used hyper-parameter combinations for each model to predict TBM AR are listed in Table 3. Based on this table, the GOGHS-RF model receives the best testing performance (R2 = 0.9844, RMSE = 0.081 and MAPE = 11.8260) under the best parameter combination (n_estimators = 45, max_depth = 11 and min_samples_leaf = 2). In addition, the GA-RF model got the corresponding test results (R2 = 0.9777, RMSE = 0.0967 and MAPE = 13.9562) under the parameter combination (n_estimators = 356, max_depth = 23 and min_samples_leaf = 12); the PSO-RF model got the best test performance (R2 = 0.978, RMSE = 0.0961 and MAPE = 14.9889) under the parameter combination (n_estimators = 356, max_depth = 5 and min_samples_leaf = 1); and the ABC-RF model got the best test results (R2 = 0.9799, RMSE = 0.0919 and MAPE = 13.2602) according to the parameter combination (n_estimators = 155, max_depth = 13 and min_samples_leaf = 9).
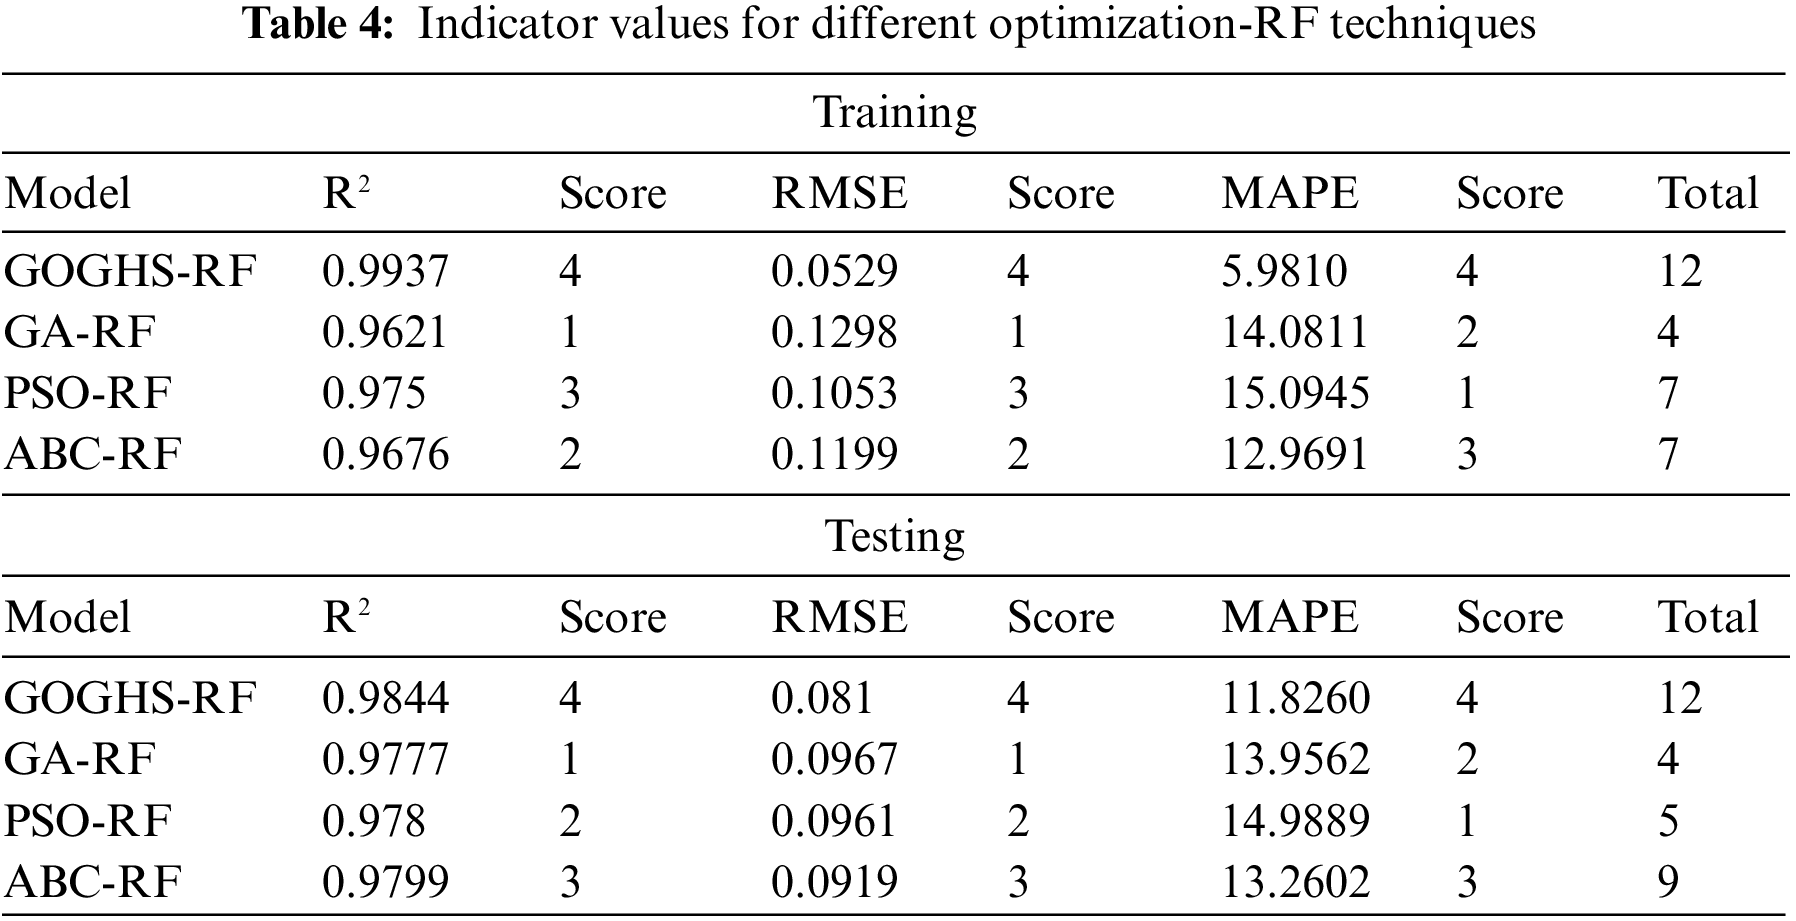
Following the optimization outcomes of these models detailed in Table 3, a deeper examination into the detailed index values and peculiarities of the four hybrid models based on RF was conducted. It is evident in Table 4 that the test set accuracy of the three hybrid models (GA-RF/ABC-RF/PSO-RF) seems to be higher than the accuracy of the training set. However, generally, prediction models may be more accurate for the training set. An analysis of the reasons for this discrepancy is provided here. Firstly, it might be due to the fact that the four RF models employed different optimization methods, leading to varying performances on the training and test sets. Among them, the GOGHS-RF model performed better on the training set, as the GOGHS optimization resulted in better fitting effects on the training set, indicating that GOGHS is a more effective parameter optimization method when compared. This implies that the GOGHS-RF model has better generalization ability, adapting well to both the training and test sets. On the other hand, the other three hybrid RF models (GA-RF/ABC-RF/PSO-RF) did not overfit the training data and exhibited good generalization effects on unseen data, which might have led to better performance on the test set. This suggests that the GOGHS-RF model achieved a better balance between model complexity and overfitting, enabling it to perform excellently on the training set while maintaining good generalization ability. The other three models (GA-RF/ABC-RF/PSO-RF) might have had slightly imbalanced performance between the training and test sets.
Furthermore, to evaluate the comprehensive performance of these hybrid models, scoring was done for performance on the training and test sets, and these scores are displayed in Fig. 8. The results indicate that the GOGHS-RF model achieved the best comprehensive score, followed by the high comprehensive score for the ABC-RF model. In conclusion, the GOGHS-RF model might have performed better in aspects such as hyperparameter optimization, data distribution adaptation, model stability, and overfitting control, potentially resulting in better performance in practical applications.
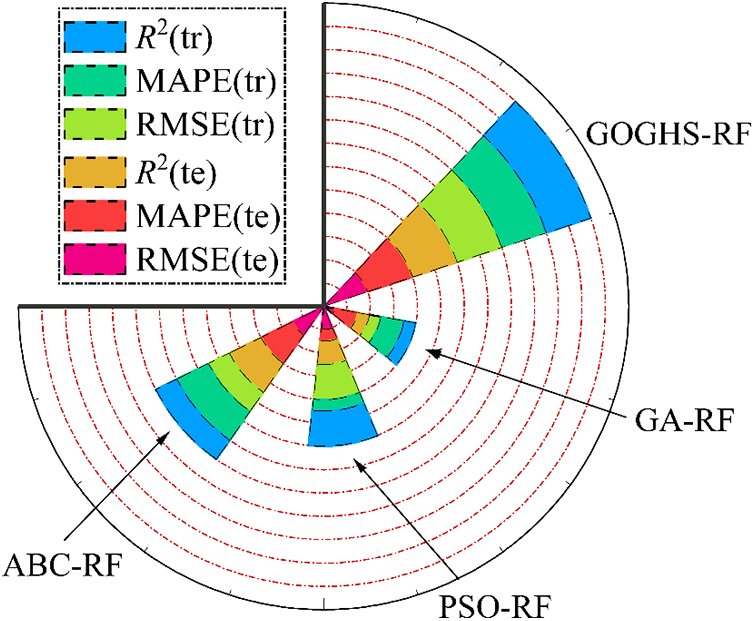
Figure 8: Comprehensive performance evaluation of the proposed hybrid-RF models
Building on these comprehensive performance results, the scatter plot analyses presented were further conducted in Figs. 9 and 10 to compare the learning efficiency of these models in capturing the relationship between input and output variables. The analysis in Figs. 9 and 10 revealed that the GOGHS-RF is superior at learning the relationship between input and output. This was shown by comparing the predicted training and test AR values from the hybrid RF models with the actual AR values. Most data instances are distributed near the perfect regression line (x = y line). From the perspective of the coefficient of determination, GOGHS-RF demonstrates a better learning effect among the four hybrid RF models. The training set (R2: 0.9937) and the test set (R2: 0.9844) exhibit a high coefficient of determination; the RMSE value is very low (training set: 0.0529 and test set: 0.081). Additionally, the MAPE values are also very low for the GOGHS-RF model (training set: 5.9810 and test set: 11.8260). The performance comparison of the GOGHS-RF model with the other hybrid models indicates that the model is well-trained and effectively avoids under-fitting and over-fitting. The results show that the R2 values of the four hybrid models are generally above 0.96, representing a high level of prediction accuracy. Furthermore, the scatter plot analysis included two equations, one linear and one nonlinear, proposed by Armaghani et al. [61] for performance comparison, demonstrating that the prediction performance of the hybrid RF-based models is superior, particularly for the GOGHS-RF model, as its predicted and actual points almost perfectly fall on the x = y line. This also reflects the effective optimization of the GOGHS method on the RF model and the high regression performance of GOGHS-RF on the entire data set.
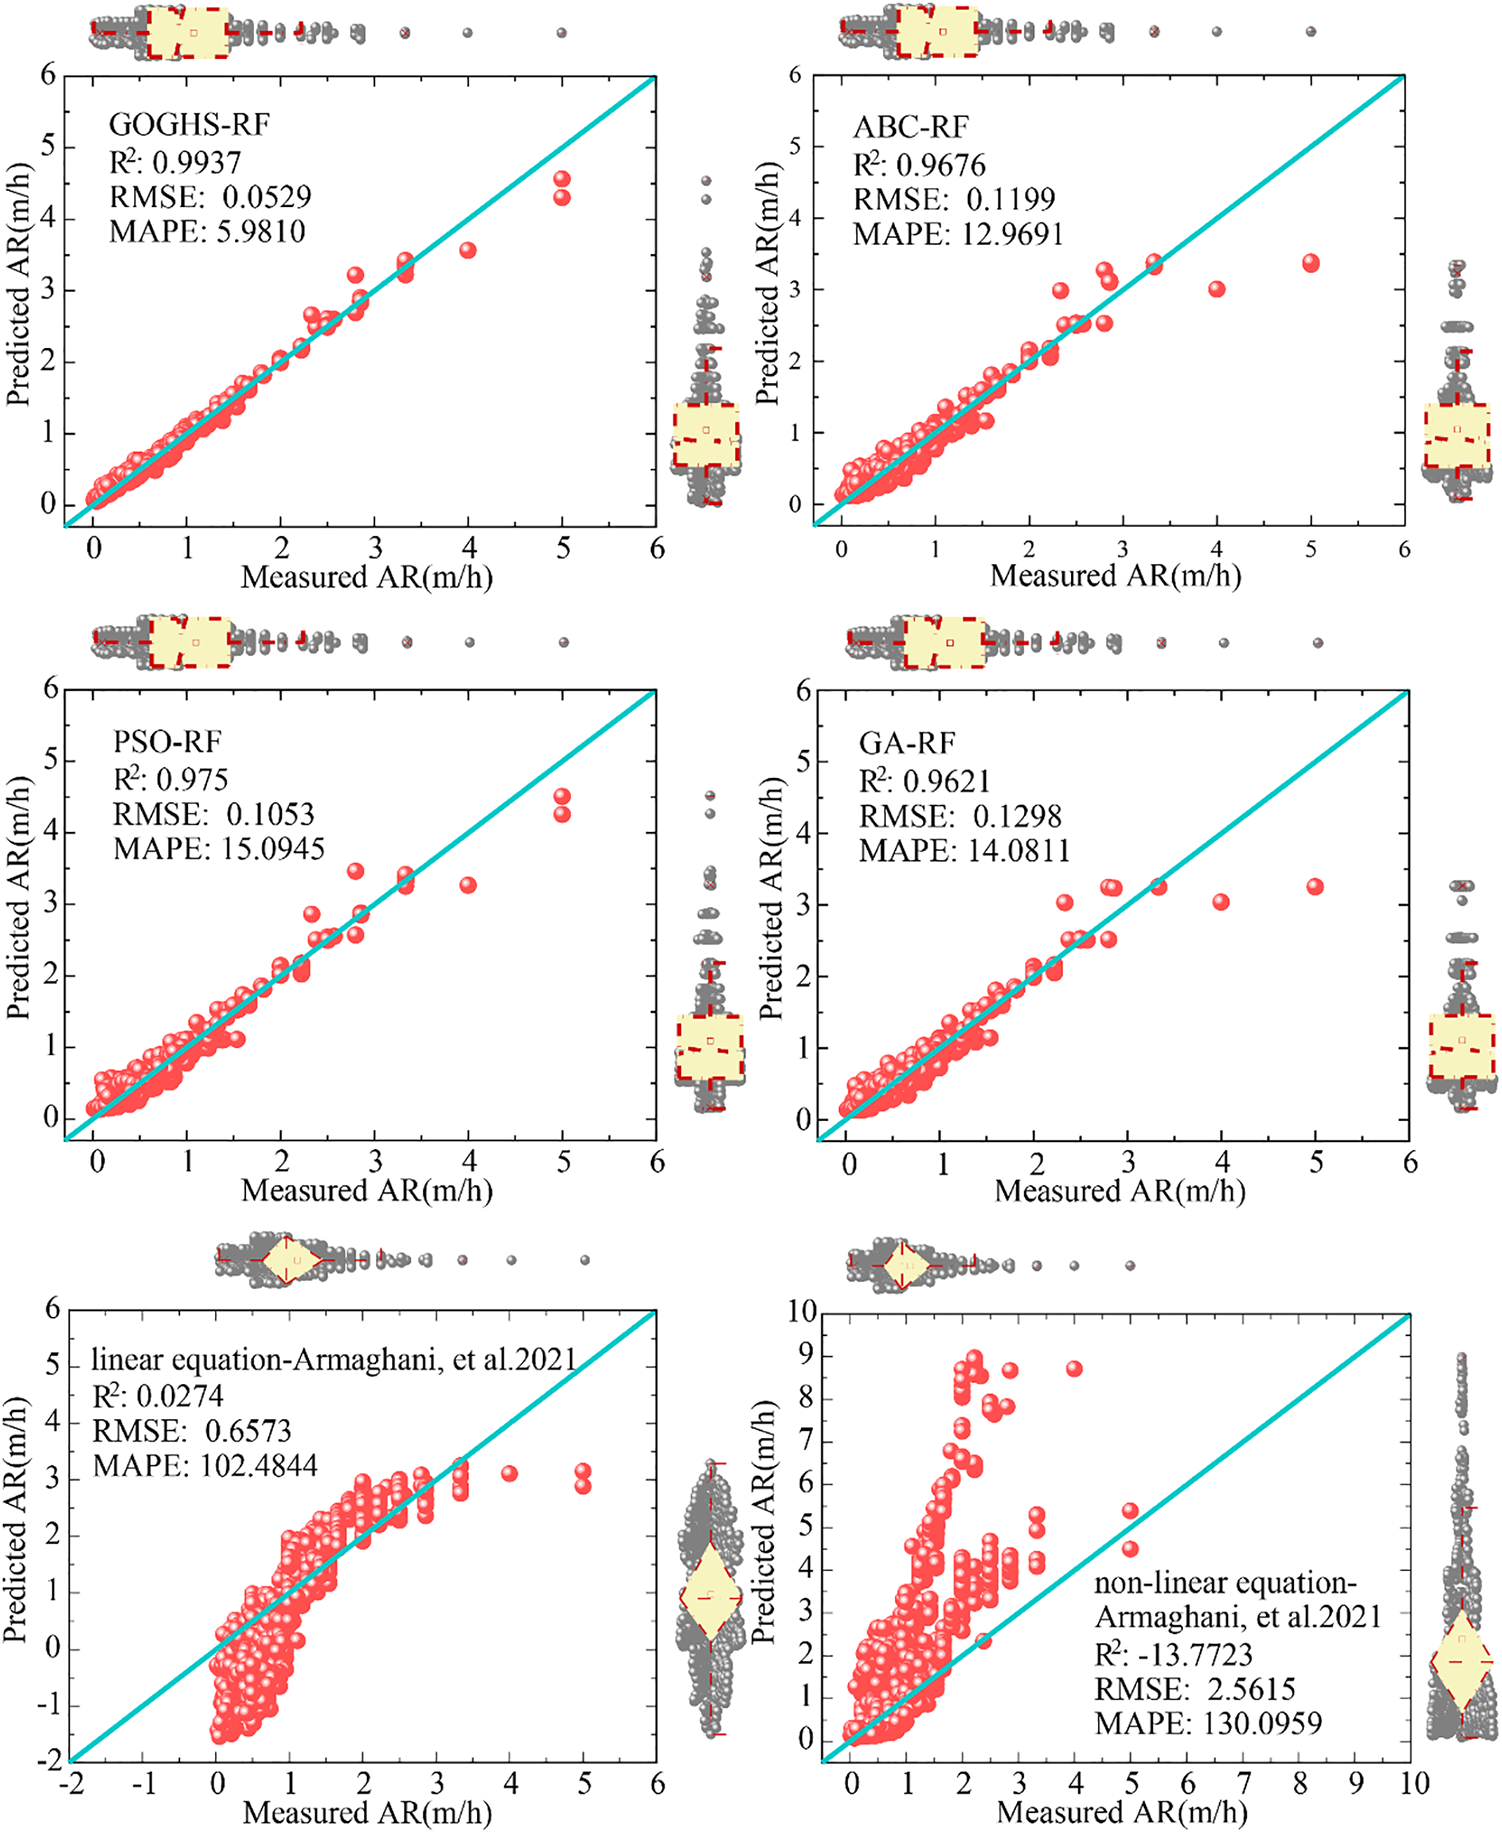
Figure 9: Scatter plot of AR predictions for the GOGHS-RF hybrid model and the comparative models on the training set
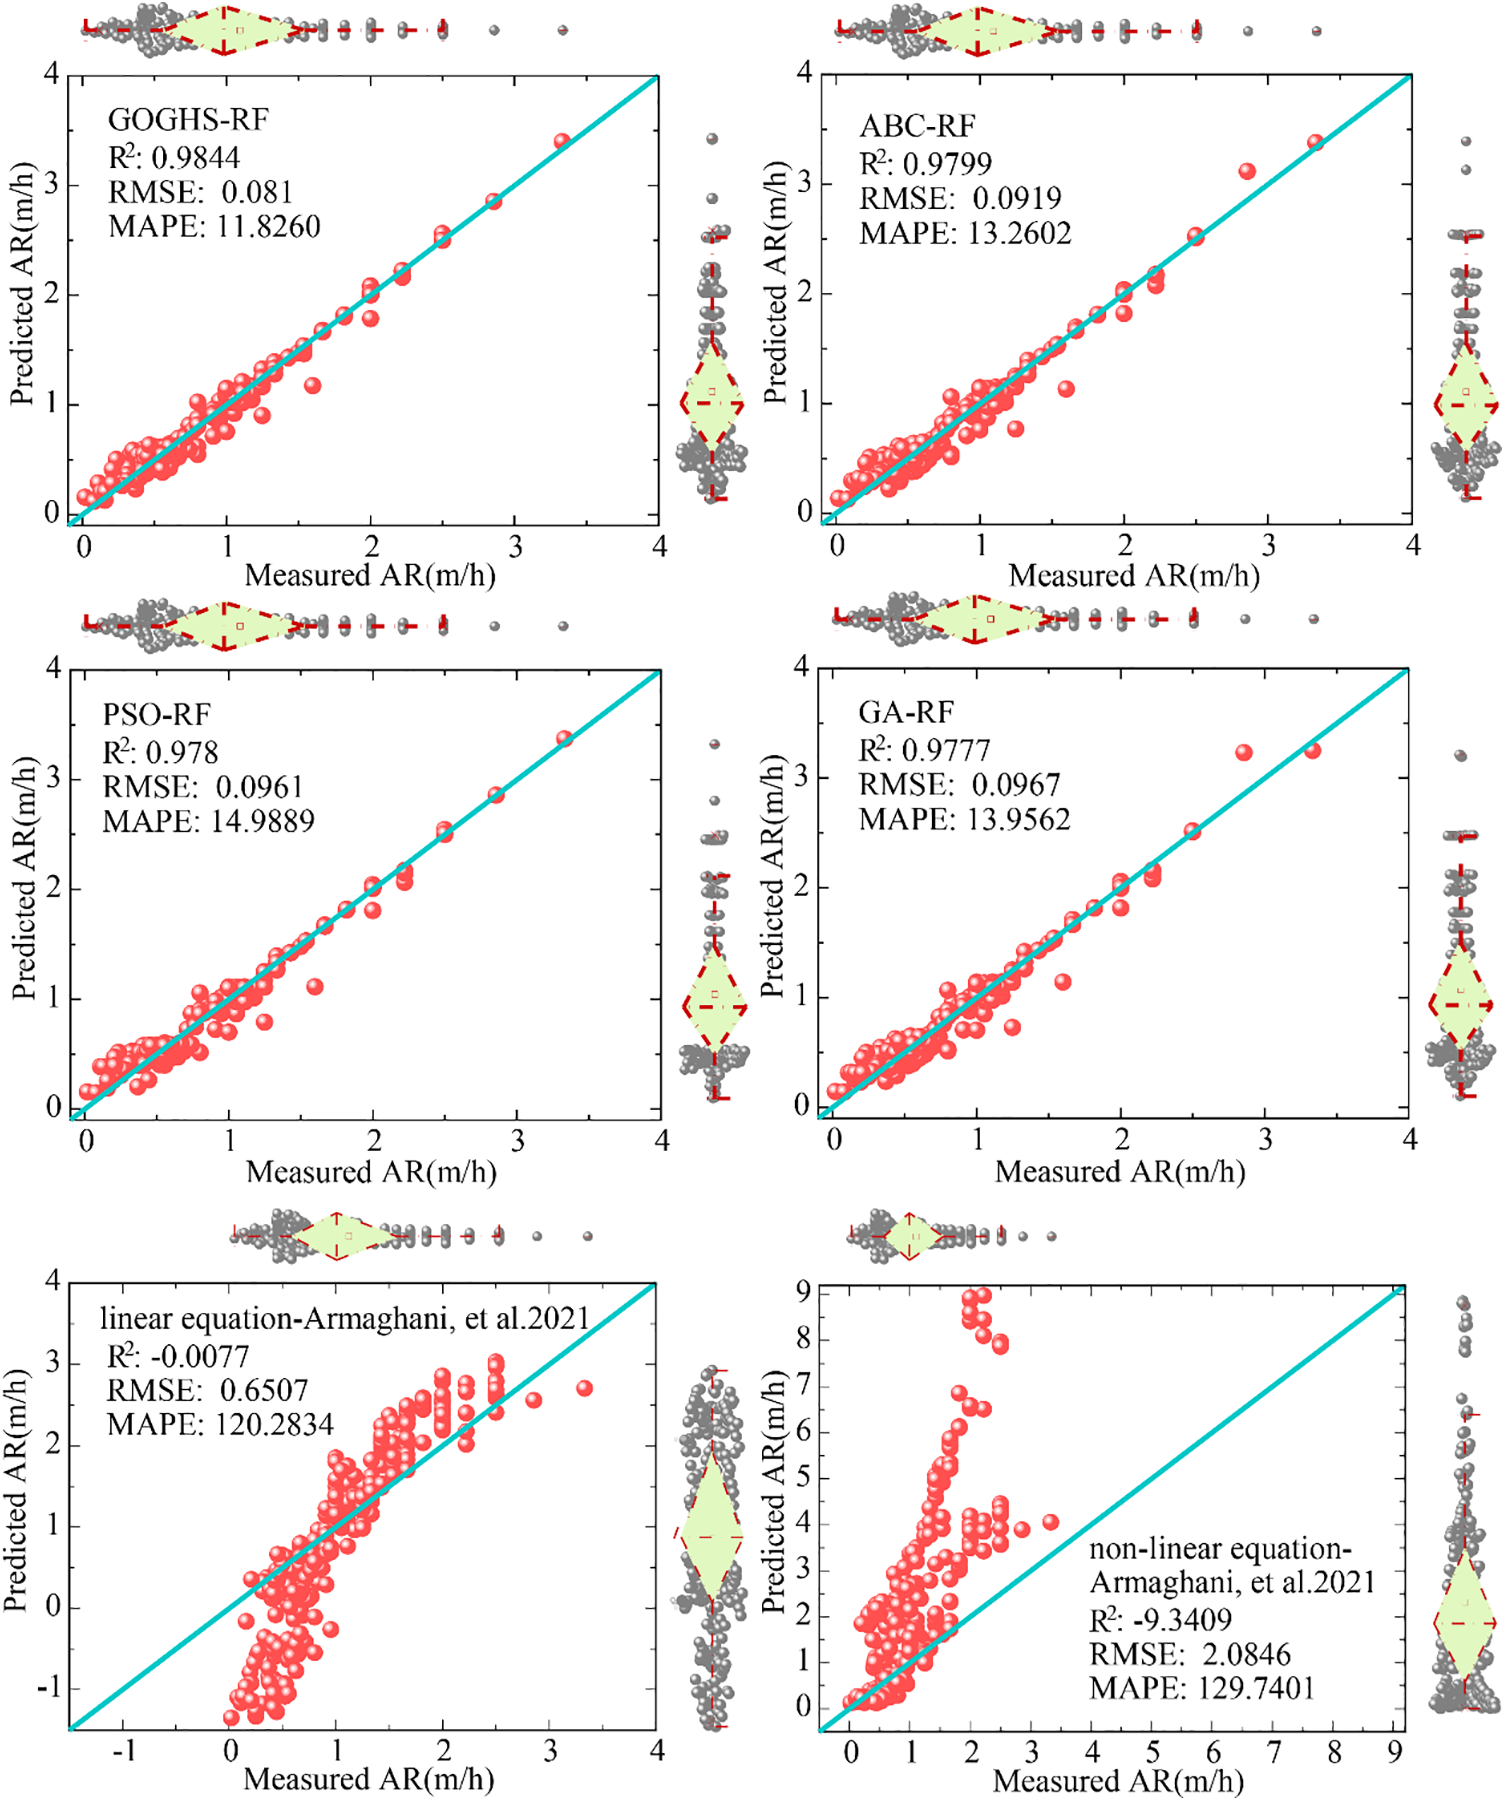
Figure 10: Scatter plot of AR predictions for the GOGHS-RF hybrid model and the comparative models on the test set
In view of the above discussion, this part vividly illustrates the effectiveness of these optimization methods for RF optimization from various perspectives in Fig. 11. As can be seen in Fig. 11a, the hybrid RF models perform far better than the singular RF model, especially the optimization effect of GOGHS is most pronounced. Fig. 11b demonstrates the prediction error changes of the GOGHS-RF model for the test data set, indicating a significant prediction accuracy of the model with a generally steady overall error. Then, the GOGHS-RF model with the best test performance is verified on the entire data set. As shown in Fig. 11c, the prediction error is extremely small. It confirms that the GOGHS-RF model has excellent performance in data learning and proves that it has better versatility and robustness. Therefore, GOGHS-RF can be selected and introduced as the best method for TBM AR prediction in this study.
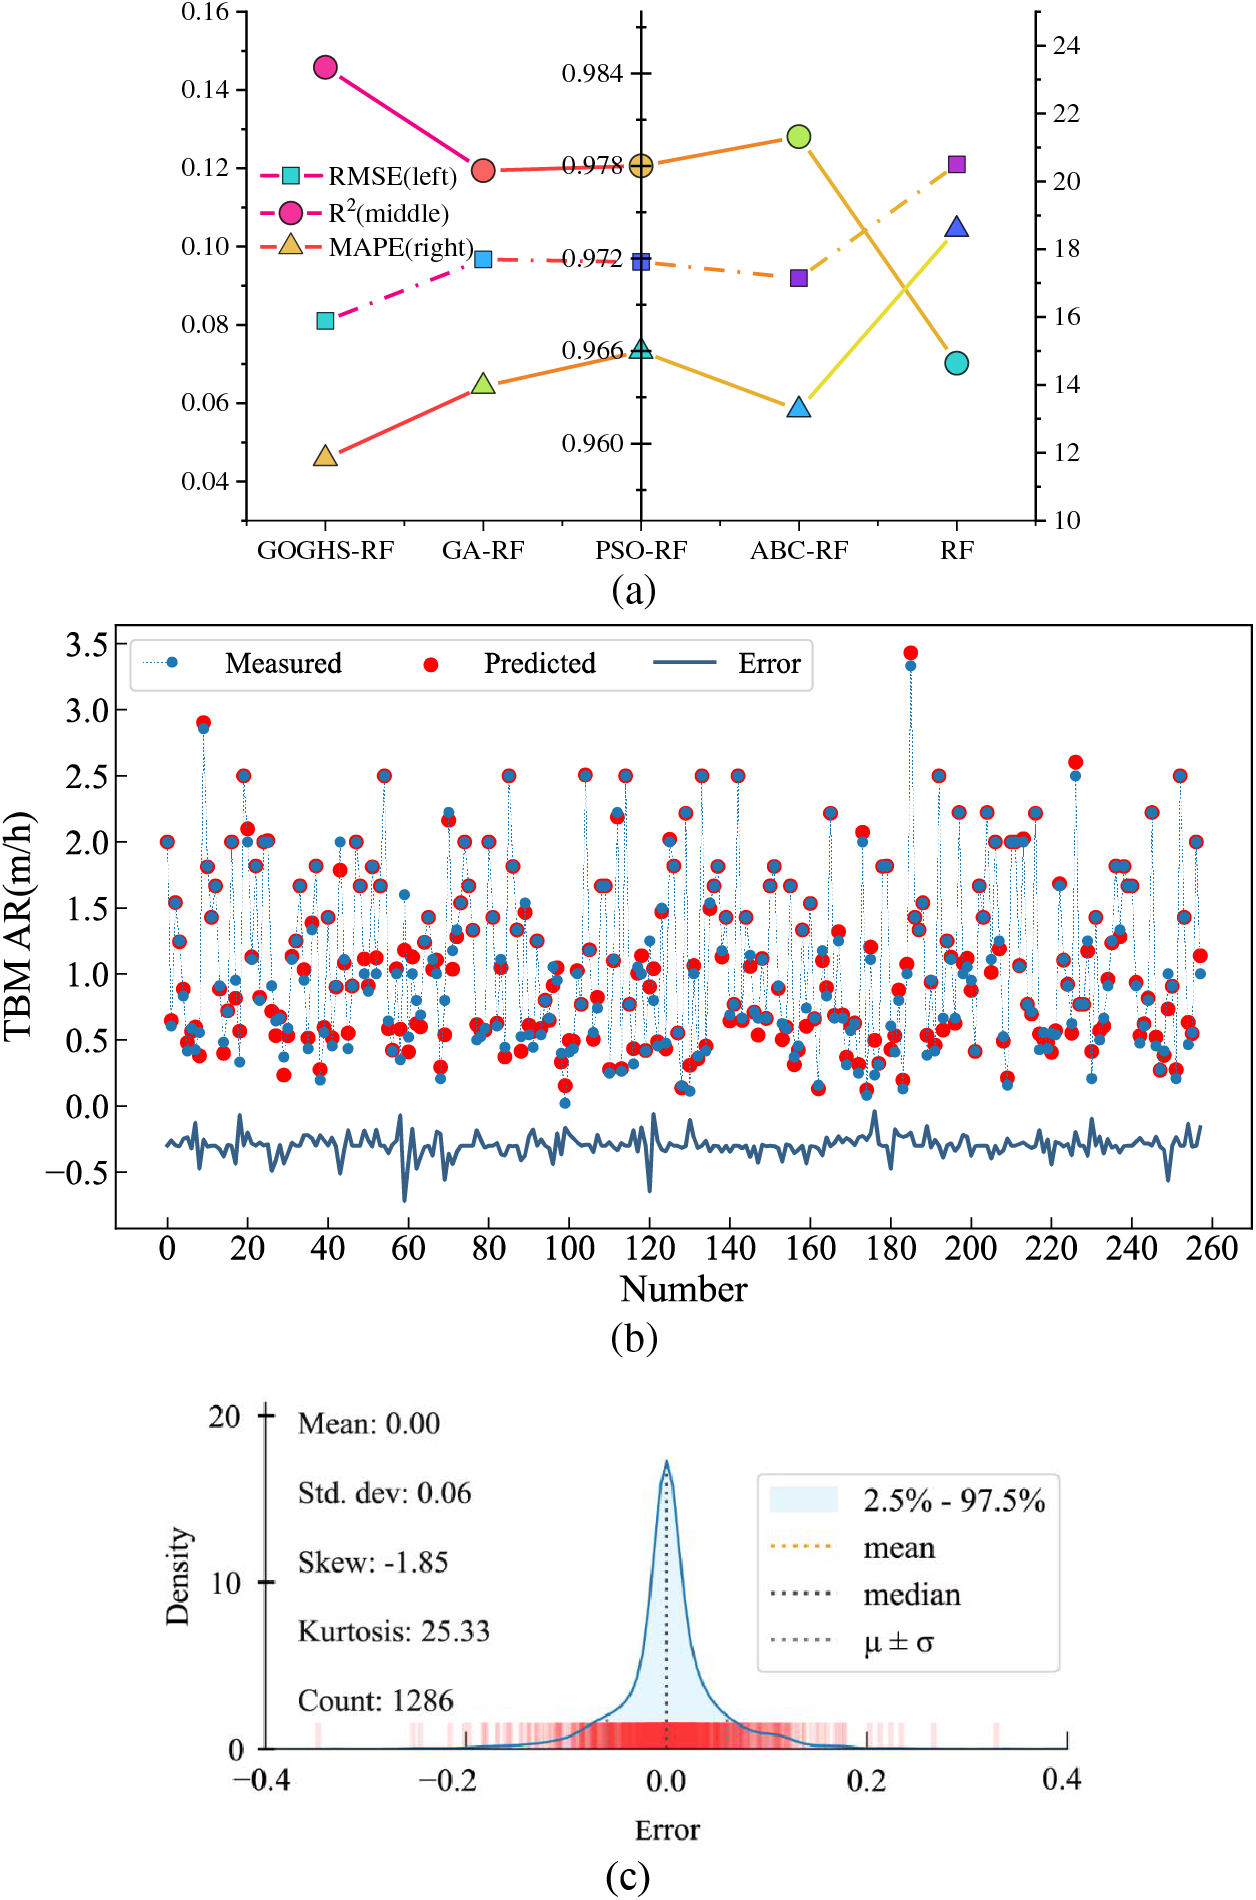
Figure 11: Model performance. (a) Three-axis diagram of evaluation indicators; (b) Performance of the best GOGHS-RF on the test set; (c) Error analysis of the best GOGHS-RF on the entire data set
To effectively compare the simulation effects of different models, relying solely on scatter diagrams may not be intuitive enough. The Taylor diagram is a way to intuitively compare models [62]. It provides a visual framework for comparing model results with observations and displays three evaluation indicators on a single graph. Fig. 12 shows a Taylor diagram showing the prediction accuracy of different models under the same input combination. In this study, whether it is the RF-based hybrid model or the single model, the GOGHS-RF model is closer to the reference point and has better performance than other models.
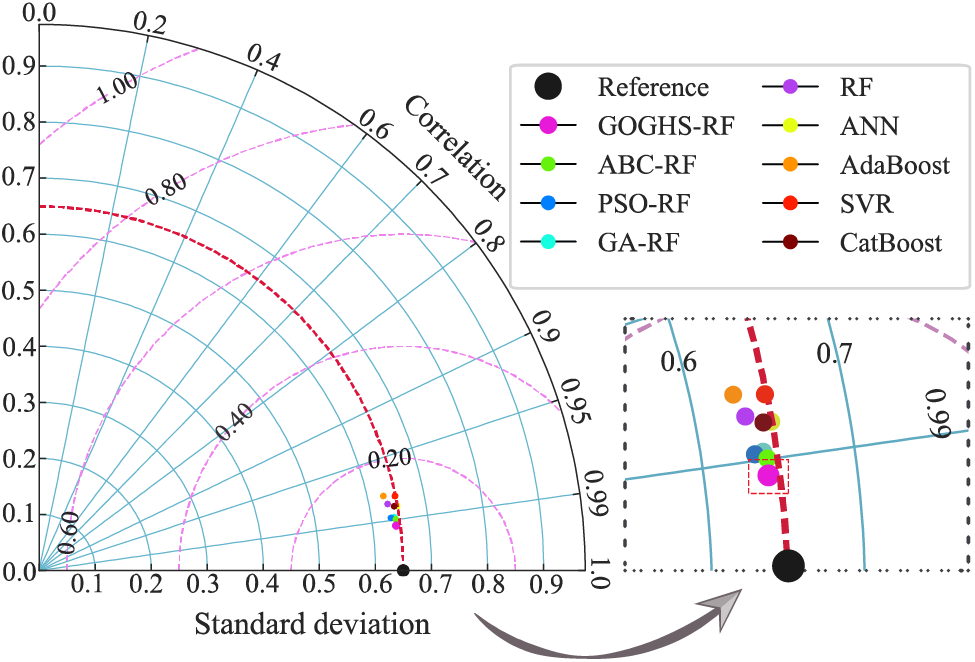
Figure 12: Performance evaluation of the nine ML models used: Taylor diagram involving standard deviation and correlation coefficient
In intelligence and simulation work, it is very important to maintain and increase the performance prediction if a new model is proposed. In addition, it is also important to decrease the number of features or inputs compared to previous related works. Considering the previous studies similar to this one, it can be seen that the model presented in this study is more accurate and applicable. For example, the same data was used by Zhou et al. [23] to predict the same output, which is TBM AR. They developed different SVM-based metaheuristic models and received a lower performance prediction than the one proposed in this study. The best model developed by Zhou et al. [23] provided a performance capacity with R2 = 0.962 and 0.972, and RMSE = 0.127 and 0.116 for train and test stages, respectively. In contrast, this study developed the GOGHS-RF model, which achieved R2 = 0.9937 and 0.9844 for the train and test stages, respectively. In another work, Armaghani et al. [11] used the same input parameters as in this study, together with quartz content, to estimate TBM AR. They combined models of ANN with PSO/imperialist competitive algorithm and obtained R2 = 0.958 and 0.961 for the train and test stages, respectively. The advantages of the present study lie in: (1) performance prediction, (2) the number of factors used as inputs. It is obvious that the developed GOGHS-RF model predicts TBM AR more accurately and better than the PSO-ANN model that Armaghani et al. [11] published. In addition, this study used 7 input variables, while Armaghani et al. [11] used 8 input variables, making their model more complex. On the other hand, Koopialipoor et al. [34] introduced a GP model to predict TBM AR with the same inputs except WZ. However, they received a low performance prediction (R2 = 0.897 and 0.916 for train and test stages, respectively) compared to this study. Therefore, it can be concluded that this study and its newly developed model, i.e., GOGHS-RF, make a significant contribution to the literature and can be introduced as a practical and accurate technique in mechanized tunnel excavation.
The predictive accuracy of the GOGHS-RF model depends on the input variables used (RQD, UCS, RMR, BTS, WZ, TFC, and RPM). It is meaningful to identify relatively valid and relatively invalid parameters [63]. To do that, the SHAP (SHapley Additive Explanations) method was utilized to reveal the importance of the parameters and their contribution to TBM AR prediction. SHAP is a contribution analysis method based on game theory, which quantitatively presents the functional contribution of complex learning model by calculating shapley value [64,65]. In the following equation, where N represents the set of all features in the data set, S is the set after index i is removed, the importance of feature i to the model output is represented by Φi, xs represents the vector of input features in set S, and the contribution of features is calculated with the corresponding function q.
The results of the significance of the inducing factors were obtained according to the Shapley value (Fig. 13). Most of the selected variables are not negligible for AR prediction, and TFC is the most significant parameter (this is consistent with the conclusion by Zhou et al. [23]). Other parameters (namely RPM, UCS, RQD, BTS, RMR, and WZ) are the next important parameters. By calculating the Shapley value of the sample to summarize the salient features of the model, the predictor variable TFC has a score of 0.4245. Similarly, the variable RPM has a score of 0.1409, the variable UCS has a score of 0.0366, the variable RQD has a score of 0.0292, the variable BTS has a score of 0.0250, the variable RMR has a score of 0.0119, and the variable WZ has a score of 0.0015. The score of TFC is much higher than the other input parameters.
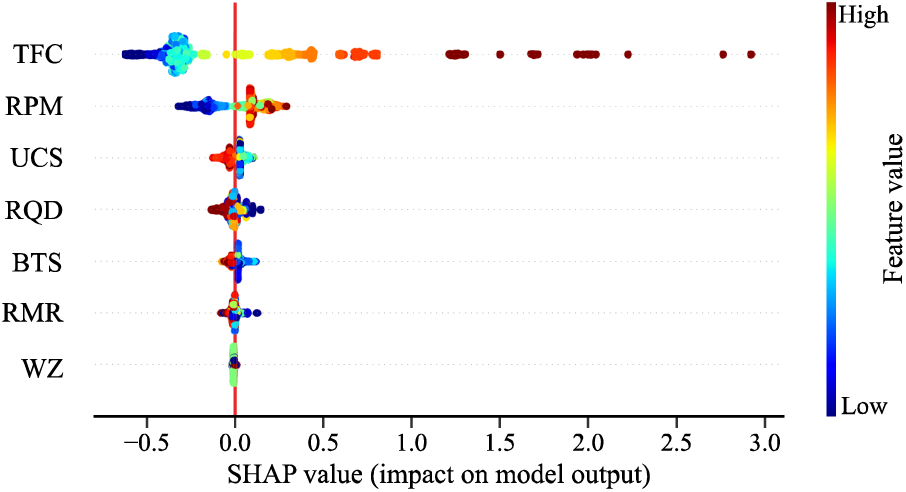
Figure 13: Importance analysis of input parameters in AR prediction
Following the evaluation of the overarching significance of the influencing factors using Shapley values, the analysis now shifts its lens to a finer scale. The investigation is further narrowed down to an individual test sample to probe the singular effects of these parameters on the prediction. This section performed a detailed analysis of the fifth test sample, and Fig. 14 displays the significant parameters used for individual prediction. The prediction starts with the base value, and the parameters are used as the driving force predicted by the model. Red represents driving force, and blue represents resistance. According to the results in the figure, the average output of the model is about 1.083. The overall contribution of these parameters reduces the output value, and the final output is 0.62.
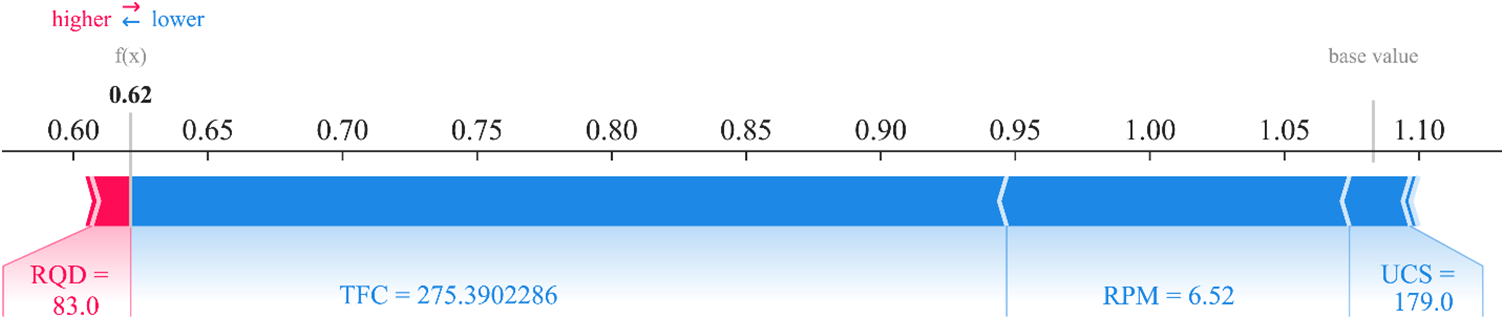
Figure 14: Predictive interpretation of test sample
To gain a deeper understanding of the interaction between variables, the most significant feature, i.e., TFC, can be plotted based on the SHAP values. According to Fig. 15, the x-axis and z-axis depict the TFC values and the SHAP values, respectively, while the y-axis represents the RPM values. It can be seen that the greatest impact on TBM AR prediction occurs when TFC and RPM are large. The same trend can be found in the study conducted by Armaghani et al. [2]. It should be mentioned that similar analyses can be implemented using other input variables. This can be further studied by other researchers in the coming relevant investigations in the area of TBM performance.
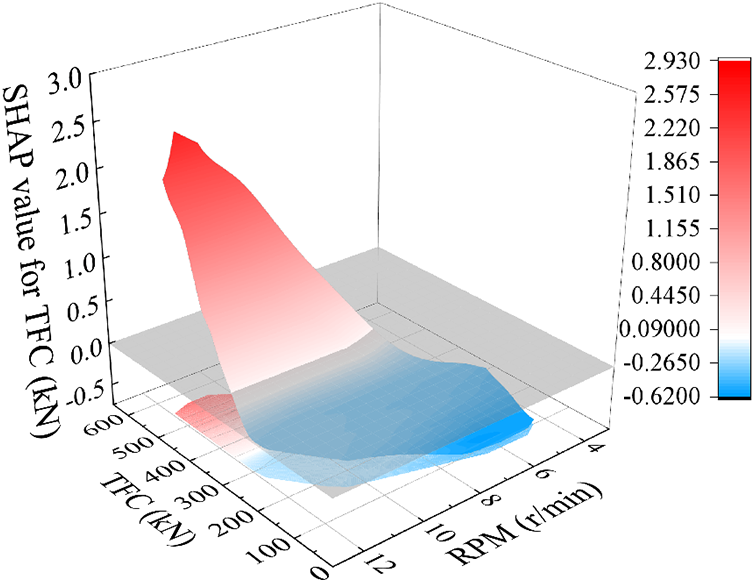
Figure 15: The interactive effects of TFC and RPM on AR prediction
Previous studies have observed that the RF model has been applied as a standalone predictive technique in only a few instances of TBM construction research. Therefore, this study aimed to develop new metaheuristic optimization-based hybrid RF models to predict TBM performance (i.e., AR). Following the construction of the model and multiple tests, the GOGHS algorithm—with its enhanced global search capability based on HS improvement—was identified as the optimal algorithm for adjusting the hyperparameters of RF. The predictive capacity of the GOGHS-RF model was systematically verified using a variety of evaluation indicators and compared with three other metaheuristic-based models, i.e., GA-RF, PSO-RF, and ABC-RF. This comparison underscored the distinct advantages of the GOGHS algorithm over the other three tuning strategies.
In this context, the study further examined the performance of the GOGHS-RF model. Performance indexes (R2, RMSE, and MAPE) and a comprehensive ranking system were utilized to assess modeling capacity. GOGHS-RF achieved an R2 of 0.9937 on the training set and 0.9844 on the test set in the model comparison. Additionally, the index values for RMSE and MAPE on the training and test sets were 0.0529 (0.081) and 5.9810 (11.8260), respectively. The results indicated an excellent regression effect, and the prediction error of GOGHS-RF on the entire TBM dataset was extremely small, demonstrating its outstanding learning performance. The GOGHS-RF model obtained the most comprehensive prediction performance among all proposed RF-based models based on these metric values. This highlights the strong merit-seeking capability of the GOGHS method in this study and its high potential for engineering applications. Moreover, a Taylor diagram was used to compare the performances of CatBoost, ANN, SVM, AdaBoost, and the hybrid RF models, with the results also showcasing the excellent performance of GOGHS-RF. Lastly, a Shapley-value was employed to study and analyze the relative importance of the influencing variables of TBM AR. Based on the optimal RF model, the input parameter importance was scored and ranked, with the results revealing that TFC had the highest importance score of 0.4245. TFC was found to be the most crucial factor affecting TBM AR, aligning with previous findings and the relevance of the input parameter statistics.
In the end, intelligent hybrid RF-based models have shown significant promise in predicting TBM excavation performance. Among them, the proposed GOGHS-RF model exhibited satisfactory data learning capability and predictive performance. Despite limitations and shortcomings, such as poor data quality and an insufficient sample size, the approach holds potential for broader application in rock mechanics and engineering geology. Future studies could address these limitations by implementing data cleaning techniques, feature selection, and incorporating more available data to enhance model performance.
Acknowledgement: The authors express their appreciation to the National Natural Science Foundation of China, and the Distinguished Youth Science Foundation of Hunan Province of China.
Funding Statement: This research was funded by the National Natural Science Foundation of China (Grant 42177164), and the Distinguished Youth Science Foundation of Hunan Province of China (2022JJ10073).
Author Contributions: Study conception and design: Yingui Qiu, Jian Zhou; data collection: Danial Jahed Armaghani; methodology: Yingui Qiu, Shuai Huang; visualization analysis: Yingui Qiu, Jian Zhou; analysis and interpretation of results: Yingui Qiu; writing—review & editing: Yingui Qiu, Danial Jahed Armaghani, Biswajeet Pradhan, Annan Zhou, Jian Zhou; draft manuscript preparation: Yingui Qiu, Shuai Huang, Danial Jahed Armaghani, Biswajeet Pradhan, Annan Zhou, Jian Zhou. All authors reviewed the results and approved the final version of the manuscript.
Availability of Data and Materials: All relevant data generated throughout this study are included in this article.
Conflicts of Interest: The authors declare that they have no known competing financial interests or personal relationships that could have appeared to influence the work reported in this paper.
References
1. Chapman, D. N., Metje, N., Stark, A. (2017). Introduction to tunnel construction. London: CRC Press. https://doi.org/10.1201/9781315273495 [Google Scholar] [CrossRef]
2. Armaghani, D. J., Mohamad, E. T., Narayanasamy, M. S., Narita, N., Yagiz, S. (2017). Development of hybrid intelligent models for predicting TBM penetration rate in hard rock condition. Tunnelling and Underground Space Technology, 63, 29–43. https://doi.org/10.1016/j.tust.2016.12.009 [Google Scholar] [CrossRef]
3. Koopialipoor, M., Jahed Armaghani, D., Haghighi, M., Ghaleini, E. N. (2019). A neuro-genetic predictive model to approximate overbreak induced by drilling and blasting operation in tunnels. Bulletin of Engineering Geology and the Environment, 78, 981–990. https://doi.org/10.1007/s10064-017-1116-2 [Google Scholar] [CrossRef]
4. Yang, H., Wang, H., Zhou, X. (2016). Analysis on the rock-cutter interaction mechanism during the TBM tunneling process. Rock Mechanics and Rock Engineering, 49, 1073–1090. https://doi.org/10.1007/s00603-015-0796-9 [Google Scholar] [CrossRef]
5. Yang, H., Wang, H., Zhou, X. (2016). Analysis on the damage behavior of mixed ground during TBM cutting process. Tunnelling and Underground Space Technology, 57, 55–65. https://doi.org/10.1016/j.tust.2016.02.014 [Google Scholar] [CrossRef]
6. Samaei, M., Ranjbarnia, M., Nourani, V., Naghadehi, M. Z. (2020). Performance prediction of tunnel boring machine through developing high accuracy equations: A case study in adverse geological condition. Measurement, 152, 107244. https://doi.org/10.1016/j.measurement.2019.107244 [Google Scholar] [CrossRef]
7. Yu, H., Tao, J., Qin, C., Xiao, D., Sun, H. et al. (2021). Rock mass type prediction for tunnel boring machine using a novel semi-supervised method. Measurement, 179, 109545. https://doi.org/10.1016/j.measurement.2021.109545 [Google Scholar] [CrossRef]
8. Maidl, B., Schmid, L., Ritz, W., Herrenknecht, M. (2008). Hardrock tunnel boring machines. Berlin: John Wiley & Sons. https://doi.org/10.1002/9783433600122 [Google Scholar] [CrossRef]
9. Li, J., Li, P., Guo, D., Li, X., Chen, Z. (2021). Advanced prediction of tunnel boring machine performance based on big data. Geoscience Frontiers, 12(1), 331–338. https://doi.org/10.1016/j.gsf.2020.02.011 [Google Scholar] [CrossRef]
10. Zhou, J., Qiu, Y., Zhu, S., Armaghani, D. J., Khandelwal, M. et al. (2021). Estimation of the TBM advance rate under hard rock conditions using XGBoost and Bayesian optimization. Underground Space, 6(5), 506–515. https://doi.org/10.1016/j.undsp.2020.05.008 [Google Scholar] [CrossRef]
11. Armaghani, D. J., Koopialipoor, M., Marto, A., Yagiz, S. (2019). Application of several optimization techniques for estimating TBM advance rate in granitic rocks. Journal of Rock Mechanics and Geotechnical Engineering, 11(4), 779–789. https://doi.org/10.1016/j.jrmge.2019.01.002 [Google Scholar] [CrossRef]
12. Yang, H., Liu, J., Liu, B. (2018). Investigation on the cracking character of jointed rock mass beneath TBM disc cutter. Rock Mechanics and Rock Engineering, 51, 1263–1277. https://doi.org/10.1007/s00603-017-1395-8 [Google Scholar] [CrossRef]
13. Ramoni, M., Anagnostou, G. (2010). Tunnel boring machines under squeezing conditions. Tunnelling and Underground Space Technology, 25(2), 139–157. https://doi.org/10.1016/j.tust.2009.10.003 [Google Scholar] [CrossRef]
14. Xu, C., Liu, X., Wang, E., Wang, S. (2021). Prediction of tunnel boring machine operating parameters using various machine learning algorithms. Tunnelling and Underground Space Technology, 109, 103699. https://doi.org/10.1016/j.tust.2020.103699 [Google Scholar] [CrossRef]
15. Hassanpour, J., Rostami, J., Zhao, J. (2011). A new hard rock TBM performance prediction model for project planning. Tunnelling and Underground Space Technology, 26(5), 595–603. https://doi.org/10.1016/j.tust.2011.04.004 [Google Scholar] [CrossRef]
16. Benardos, A. G., Kaliampakos, D. C. (2004). Modelling TBM performance with artificial neural networks. Tunnelling and Underground Space Technology, 19(6), 597–605. https://doi.org/10.1016/j.tust.2004.02.128 [Google Scholar] [CrossRef]
17. Jahed Armaghani, D., Faradonbeh, R. S., Momeni, E., Fahimifar, A., Tahir, M. M. (2018). Performance prediction of tunnel boring machine through developing a gene expression programming equation. Engineering with Computers, 34, 129–141. https://doi.org/10.1007/s00366-017-0526-x [Google Scholar] [CrossRef]
18. Yagiz, S., Gokceoglu, C., Sezer, E., Iplikci, S. (2009). Application of two non-linear prediction tools to the estimation of tunnel boring machine performance. Engineering Applications of Artificial Intelligence, 22(4–5), 808–814. https://doi.org/10.1016/j.engappai.2009.03.007 [Google Scholar] [CrossRef]
19. Yagiz, S., Karahan, H. (2011). Prediction of hard rock TBM penetration rate using particle swarm optimization. International Journal of Rock Mechanics and Mining Sciences, 48(3), 427–433. https://doi.org/10.1016/j.ijrmms.2011.02.013 [Google Scholar] [CrossRef]
20. Grima, M. A., Bruines, P. A., Verhoef, P. N. W. (2000). Modeling tunnel boring machine performance by neuro-fuzzy methods. Tunnelling and Underground Space Technology, 15(3), 259–269. https://doi.org/10.1016/S0886-7798(00)00055-9 [Google Scholar] [CrossRef]
21. Salimi, A., Esmaeili, M. (2013). Utilising of linear and non-linear prediction tools for evaluation of penetration rate of tunnel boring machine in hard rock condition. International Journal of Mining and Mineral Engineering, 4(3), 249–264. https://doi.org/10.1504/IJMME.2013.053172 [Google Scholar] [CrossRef]
22. Sanio, H. P. (1985). Prediction of the performance of disc cutters in anisotropic rock. International Journal of Rock Mechanics and Mining Sciences & Geomechanics Abstracts, 22(3), 153–161. Pergamon. https://doi.org/10.1016/0148-9062(85)93229-2 [Google Scholar] [CrossRef]
23. Zhou, J., Qiu, Y., Zhu, S., Armaghani, D. J., Li, C. et al. (2021). Optimization of support vector machine through the use of metaheuristic algorithms in forecasting TBM advance rate. Engineering Applications of Artificial Intelligence, 97, 104015. https://doi.org/10.1016/j.engappai.2020.104015 [Google Scholar] [CrossRef]
24. Ke, B., Khandelwal, M., Asteris, P. G., Skentou, A. D., Mamou, A. et al. (2021). Rock-burst occurrence prediction based on optimized Naïve Bayes models. IEEE Access, 9, 91347–91360. https://doi.org/10.1109/ACCESS.2021.3089205 [Google Scholar] [CrossRef]
25. Zhang, Y., Xiong, Z., Liang, Z., She, J., Ma, C. (2023). Structural damage identification system suitable for old arch bridge in rural regions: Random forest approach. Computer Modeling in Engineering & Sciences, 136(1), 447–469. https://doi.org/10.32604/cmes.2023.022699 [Google Scholar] [CrossRef]
26. Thi, H., Dam, N. D., Bui, Q. T., Al-Ansari, N., Costache, R. et al. (2023). Prediction of flash flood susceptibility of hilly terrain using deep neural network: A case study of Vietnam. Computer Modeling in Engineering & Sciences, 135(3), 2219–2241. https://doi.org/10.32604/cmes.2023.022566 [Google Scholar] [CrossRef]
27. Zhou, J., Qiu, Y., Armaghani, D. J., Zhang, W., Li, C. et al. (2021). Predicting TBM penetration rate in hard rock condition: A comparative study among six XGB-based metaheuristic techniques. Geoscience Frontiers, 12(3), 101091. https://doi.org/10.1016/j.gsf.2020.09.020 [Google Scholar] [CrossRef]
28. Jahed Armaghani, D., Azizi, A. (2021). A comparative study of artificial intelligence techniques to estimate TBM performance in various weathering zones. Applications of Artificial Intelligence in Tunnelling and Underground Space Technology, 55–70. https://doi.org/10.1007/978-981-16-1034-9_4 [Google Scholar] [CrossRef]
29. Zeng, J., Roy, B., Kumar, D., Mohammed, A. S., Armaghani, D. J. et al. (2021). Proposing several hybrid PSO-extreme learning machine techniques to predict TBM performance. Engineering with Computers, 1–17. https://doi.org/10.1007/s00366-020-01225-2 [Google Scholar] [CrossRef]
30. Zhou, J., Yazdani Bejarbaneh, B., Jahed Armaghani, D., Tahir, M. M. (2020). Forecasting of TBM advance rate in hard rock condition based on artificial neural network and genetic programming techniques. Bulletin of Engineering Geology and the Environment, 79, 2069–2084. https://doi.org/10.1007/s10064-019-01626-8 [Google Scholar] [CrossRef]
31. Yang, H., Wang, Z., Song, K. (2020). A new hybrid grey wolf optimizer-feature weighted-multiple kernel-support vector regression technique to predict TBM performance. Engineering with Computers, 1–17. https://doi.org/10.1007/s00366-020-01217-2 [Google Scholar] [CrossRef]
32. Yagiz, S., Karahan, H. (2015). Application of various optimization techniques and comparison of their performances for predicting TBM penetration rate in rock mass. International Journal of Rock Mechanics and Mining Sciences, 80, 308–315. https://doi.org/10.1016/j.ijrmms.2015.09.019 [Google Scholar] [CrossRef]
33. Xu, H., Zhou, J., Asteris, G., Jahed Armaghani, D., Tahir, M. M. (2019). Supervised machine learning techniques to the prediction of tunnel boring machine penetration rate. Applied Sciences, 9(18), 3715. https://doi.org/10.3390/app9183715 [Google Scholar] [CrossRef]
34. Koopialipoor, M., Nikouei, S. S., Marto, A., Fahimifar, A., Jahed Armaghani, D. et al. (2019). Predicting tunnel boring machine performance through a new model based on the group method of data handling. Bulletin of Engineering Geology and the Environment, 78, 3799–3813. https://doi.org/10.1007/s10064-018-1349-8 [Google Scholar] [CrossRef]
35. Koopialipoor, M., Tootoonchi, H., Jahed Armaghani, D., Tonnizam Mohamad, E., Hedayat, A. (2019). Application of deep neural networks in predicting the penetration rate of tunnel boring machines. Bulletin of Engineering Geology and the Environment, 78, 6347–6360. https://doi.org/10.1007/s10064-019-01538-7 [Google Scholar] [CrossRef]
36. Zhang, Q., Liu, Z., Tan, J. (2019). Prediction of geological conditions for a tunnel boring machine using big operational data. Automation in Construction, 100, 73–83. https://doi.org/10.1016/j.autcon.2018.12.022 [Google Scholar] [CrossRef]
37. Ghasemi, E., Yagiz, S., Ataei, M. (2014). Predicting penetration rate of hard rock tunnel boring machine using fuzzy logic. Bulletin of Engineering Geology and the Environment, 73, 23–35. https://doi.org/10.1007/s10064-013-0497-0 [Google Scholar] [CrossRef]
38. Harandizadeh, H., Armaghani, D. J., Asteris, P. G., Gandomi, A. H. (2021). TBM performance prediction developing a hybrid ANFIS-PNN predictive model optimized by imperialism competitive algorithm. Neural Computing and Applications, 33, 16149–16179. https://doi.org/10.1007/s00521-021-06217-x [Google Scholar] [CrossRef]
39. Asteris, P. G., Koopialipoor, M., Armaghani, D. J., Kotsonis, E. A., Lourenço, P. B. (2021). Prediction of cement-based mortars compressive strength using machine learning techniques. Neural Computing and Applications, 33(19), 13089–13121. https://doi.org/10.1007/s00521-021-06004-8 [Google Scholar] [CrossRef]
40. Asteris, P. G., Mamou, A., Hajihassani, M., Hasanipanah, M., Koopialipoor, M. et al. (2021). Soft computing based closed form equations correlating L and N-type Schmidt hammer rebound numbers of rocks. Transportation Geotechnics, 29, 100588. https://doi.org/10.1016/j.trgeo.2021.100588 [Google Scholar] [CrossRef]
41. Khade, S., Gite, S., Thepade, S. D., Pradhan, B., Alamri, A. (2023). Iris liveness detection using fragmental energy of haar transformed iris images using ensemble of machine learning classifiers. Computer Modeling in Engineering & Sciences, 136(1), 323–345. https://doi.org/10.32604/cmes.2023.023674 [Google Scholar] [CrossRef]
42. Gavriilaki, E., Asteris, P. G., Touloumenidou, T., Koravou, E. E., Koutra, M. et al. (2021). Genetic justification of severe COVID-19 using a rigorous algorithm. Clinical Immunology, 226, 108726. https://doi.org/10.1016/j.clim.2021.108726 [Google Scholar] [PubMed] [CrossRef]
43. Zhang, P., Wu, H. N., Chen, R. P., Dai, T., Meng, F. Y. et al. (2020). A critical evaluation of machine learning and deep learning in shield-ground interaction prediction. Tunnelling and Underground Space Technology, 106, 103593. https://doi.org/10.1016/j.tust.2020.103593 [Google Scholar] [CrossRef]
44. Sapigni, M., Berti, M., Bethaz, E., Busillo, A., Cardone, G. (2002). TBM performance estimation using rock mass classifications. International Journal of Rock Mechanics and Mining Sciences, 39(6), 771–788. https://doi.org/10.1016/S1365-1609(02)00069-2 [Google Scholar] [CrossRef]
45. Eftekhari, M., Baghbanan, A., Bayati, M. (2010). Predicting penetration rate of a tunnel boring machine using artificial neural network. ISRM International Symposium—6th Asian Rock Mechanics Symposium, OnePetro. [Google Scholar]
46. Yagiz, S. (2009). Assessment of brittleness using rock strength and density with punch penetration test. Tunnelling and Underground Space Technology, 24(1), 66–74. https://doi.org/10.1016/j.tust.2008.04.002 [Google Scholar] [CrossRef]
47. Armaghani, D. J., Tonnizam Mohamad, E., Momeni, E., Monjezi, M., Sundaram Narayanasamy, M. (2016). Prediction of the strength and elasticity modulus of granite through an expert artificial neural network. Arabian Journal of Geosciences, 9, 1–16. https://doi.org/10.1007/s12517-015-2057-3 [Google Scholar] [CrossRef]
48. Hatheway, A. W. (2009). The complete ISRM suggested methods for rock characterization, testing and monitoring; 1974–2006. Environmental and Engineering Geoscience, 15, 47–48. https://doi.org/10.2113/gseegeosci.15.1.47 [Google Scholar] [CrossRef]
49. Geem, Z. W., Kim, J. H., Loganathan, G. V. (2001). A new heuristic optimization algorithm: Harmony search. Simulation, 76(2), 60–68. https://doi.org/10.1177/003754970107600 [Google Scholar] [CrossRef]
50. Zou, D., Gao, L., Wu, J., Li, S. (2010). Novel global harmony search algorithm for unconstrained problems. Neurocomputing, 73(16–18), 3308–3318. https://doi.org/10.1016/j.neucom.2010.07.010 [Google Scholar] [CrossRef]
51. Wang, H., Wu, Z., Liu, Y., Wang, J., Jiang, D. et al. (2009). Space transformation search: A new evolutionary technique. Proceedings of the First ACM/SIGEVO Summit on Genetic and Evolutionary Computation, pp. 537–544. Shanghai, China. https://doi.org/10.1145/1543834.1543907 [Google Scholar] [CrossRef]
52. Guo, Z., Wang, S., Yue, X., Yang, H. (2017). Global harmony search with generalized opposition-based learning. Soft Computing, 21, 2129–2137. https://doi.org/10.1007/s00500-015-1912-1 [Google Scholar] [CrossRef]
53. Mahdavi, M., Fesanghary, M., Damangir, E. (2007). An improved harmony search algorithm for solving optimization problems. Applied Mathematics and Computation, 188(2), 1567–1579. https://doi.org/10.1016/j.amc.2006.11.033 [Google Scholar] [CrossRef]
54. Breiman, L. (2001). Random forests. Machine Learning, 45, 5–32. https://doi.org/10.1023/A:1010933404324 [Google Scholar] [CrossRef]
55. Montes, C., Kapelan, Z., Saldarriaga, J. (2021). Predicting non-deposition sediment transport in sewer pipes using random forest. Water Research, 189, 116639. https://doi.org/10.1016/j.watres.2020.116639 [Google Scholar] [PubMed] [CrossRef]
56. Liaw, A., Wiener, M. (2002). Classification and regression by randomForest. R News, 2(3), 18–22. https://doi.org/10.1023/A:1010933404324 [Google Scholar] [CrossRef]
57. Wang, X., Zhu, H., Zhu, M., Zhang, L., Ju, J. W. (2021). An integrated parameter prediction framework for intelligent TBM excavation in hard rock. Tunnelling and Underground Space Technology, 118, 104196. https://doi.org/10.1016/j.tust.2021.104196 [Google Scholar] [CrossRef]
58. Zhang, Q., Hu, W., Liu, Z., Tan, J. (2020). TBM performance prediction with Bayesian optimization and automated machine learning. Tunnelling and Underground Space Technology, 103, 103493. https://doi.org/10.1016/j.tust.2020.103493 [Google Scholar] [CrossRef]
59. Yong, W., Zhang, W., Nguyen, H., Bui, X. N., Choi, Y. et al. (2022). Analysis and prediction of diaphragm wall deflection induced by deep braced excavations using finite element method and artificial neural network optimized by metaheuristic algorithms. Reliability Engineering & System Safety, 221, 108335. https://doi.org/10.1016/j.ress.2022.108335 [Google Scholar] [CrossRef]
60. Cutler, A., Cutler, D. R., Stevens, J. R. (2012). Random forests. Ensemble Machine Learning: Methods and Applications, 157–175. https://doi.org/10.1007/978-1-4419-9326-7_5 [Google Scholar] [CrossRef]
61. Armaghani, D. J., Yagiz, S., Mohamad, E. T., Zhou, J. (2021). Prediction of TBM performance in fresh through weathered granite using empirical and statistical approaches. Tunnelling and Underground Space Technology, 118, 104183. https://doi.org/10.1016/j.tust.2021.104183 [Google Scholar] [CrossRef]
62. Taylor, K. E. (2001). Summarizing multiple aspects of model performance in a single diagram. Journal of Geophysical Research, 106(D7), 7183–7192. https://doi.org/10.1029/2000JD900719 [Google Scholar] [CrossRef]
63. Koh, P. W., Liang, P. (2017). Understanding black-box predictions via influence functions. International Conference on Machine Learning, pp. 1885–1894. Sydney, NSW, Australia, PMLR. [Google Scholar]
64. Shapely, L. (1953). A value for n-person games. Contributions to the theory of games II (1953) 307–317. In: Classics in game theory. Princeton, USA: Princeton University Press. https://doi.org/10.1515/9781400829156-012 [Google Scholar] [CrossRef]
65. Lundberg, S. M., Lee, S. I. (2017). A unified approach to interpreting model predictions. Advances in Neural Information Processing Systems, 30. https://doi.org/10.48550/arXiv.1705.07874 [Google Scholar] [CrossRef]
Cite This Article
 Copyright © 2024 The Author(s). Published by Tech Science Press.
This work is licensed under a Creative Commons Attribution 4.0 International License , which permits unrestricted use, distribution, and reproduction in any medium, provided the original work is properly cited.
 Downloads
 Citation Tools