
 Submit a Paper
 Propose a Special lssue
 Open Access
ARTICLE

Smart Techniques for LULC Micro Class Classification Using Landsat8 Imagery
1 Department of Computer Science, Khwaja Fareed University of Engineering and Information Technology, Rahim Yar Khan, 64200, Pakistan
2 Department of Information and Communication Engineering, Yeungnam University, Gyeongsan-si, 38541, Korea
* Corresponding Author: Imran Ashraf. Email:
Computers, Materials & Continua 2023, 74(3), 5545-5557. https://doi.org/10.32604/cmc.2023.033449
Received 16 June 2022; Accepted 09 September 2022; Issue published 28 December 2022
 View Full Text
 Download PDF
Abstract
Wheat species play important role in the price of products and wheat production estimation. There are several mathematical models used for the estimation of the wheat crop but these models are implemented without considering the wheat species which is an important independent variable. The task of wheat species identification is challenging both for human experts as well as for computer vision-based solutions. With the use of satellite remote sensing, it is possible to identify and monitor wheat species on a large scale at any stage of the crop life cycle. In this work, nine popular wheat species are identified by using Landsat8 operational land imager (OLI) and thermal infrared sensor (TIRS) data. Two thousand samples of each wheat crop species are acquired every fifteen days with a temporal resolution of ten multispectral bands (band two to band eleven). This study employs random forest (RF), artificial neural network, support vector machine, Naïve Bayes, and logistic regression for nine types of wheat classification. In addition, deep neural networks are also developed. Experimental results indicate that RF shows the best performance of 91% accuracy while DNN obtains a 90.2% accuracy. Results suggest that remotely sensed data can be used in wheat type estimation and to improve the performance of the mathematical models.Keywords
Agriculture is the backbone of Pakistan’s economy. No country can deny the need for accurate crop cultivated information in today’s modern world. It’s one of the most important parts of the economy, contributing 24% of gross domestic product (GDP) [1]. Another proof of its importance is the fact that 43.3% of the country’s workforce is active in this field [2]. The Punjab province of Pakistan is the country’s largest producer of cash crops. Additionally, more than half of Punjab’s area is farmed [3].
Due to the increase in population, food security is a big challenge in Pakistan. Food estimation and proper management are required to assure the necessary food production and to guarantee food security [4]. Pakistani government took necessary actions to increase the production of wheat and succeeded in a small increase in the production of wheat. According to [5], new varieties of wheat seeds have great potential to increase production but need technical skills to use the new inputs efficiently. A higher level of expertise is needed to adopt varietal change. Most of the simulation models do not consider the varieties factor in their estimation while specific seed variety helps to maintain genetic resistance to diseases and pests [6]. It is a challenging task for a human expert to identify the wheat seed varieties using the crop at different stages. Satellite remote sensing is an effective tool used to monitor crop growth at a large scale. In addition, it can identify wheat crop varieties during different stages. The information gathered using satellite imagery helps mathematicians enhance the crop estimation model. Planners and decision-makers like to forecast crop yields. By remote sensing data, it is possible to predict crop yield before harvest time, which contributes to making informed decisions on food security [7]. This information is also beneficial for the government and policymakers to efficiently control the import and export of agricultural products.
China’s agriculture remote sensing monitoring system (CHARMS) [8] was developed in 2001 for monitoring crops remotely. An updated version named China crop growth monitoring system (China-CGMS) was launched in 2002. A case study is presented which explores how weather data, crop attributes data, soil information data, field survey data, as well as agro-meteorological modeling, and statistical analysis tools can be used for crop monitoring, output estimation, variety prediction, etc. It helps build new crop types, and calendars and parameters like soil and weather data can be used to get better production by adopting the growth monitoring system.
Crop type classification and prediction are important aspects of the agriculture sector and several approaches can be found in the literature. The authors in [9] examine the yield performance of newly released wheat varieties when sown later in the season under rainy conditions. During the winter season of 2014–15, a field experiment was carried out at an agriculture research farm in Pakistan using a randomized complete block design (RCBD) with split plot layouts in three replications. Thirteen wheat types were planted on five different days at a seed rate of 130 kg ha-1. One bag of urea (N 46%) and di-ammonium phosphate were used as nutrients (N 18% and P 46%). Differences in plant height (cm), spikes m-2, spike weight (g), and thousand grains weight (g) arose from both planting dates and cultivars. It was concluded that Chakwal-50 and Pak.-2013 wheat crops have higher grain yields for future food security. To meet the needs of the growing population, it is important to replace the existing low-yielding varieties with improved available wheat varieties.
For determining the type of wheat crop, machine learning-based approaches can be used with satellite images for higher and more robust performance. Existing methods lack high accuracy and robustness which necessitates customized machine learning models. This study aims at enhancing the wheat variety classification accuracy using landsat8 images. In this study, our primary goal is to acquire the Landsat8 operational land imager (OLI) images which is a challenging task during the crop life cycle. The second goal of this study is the automatic land use classification of nine wheat crop species using five well-known machine learning algorithms including a support vector machine (SVM), an artificial neural network (ANN), a decision tree-based random forest (RF) classifier, Naïve Bayes (NB), and logistic regression (LR). In addition, a deep neural network (DNN) is also constructed for the same purpose. For the performance analysis, we perform empirical analysis at various configurations of the machine learning model and obtain the best performance.
The rest of this study is divided into four sections. Section 2 discusses important research works related to remote sensing-based crop classification. The adopted methodology is described in Section 3 while the results are discussed in Section 4. In the end, the study is concluded in Section 5.
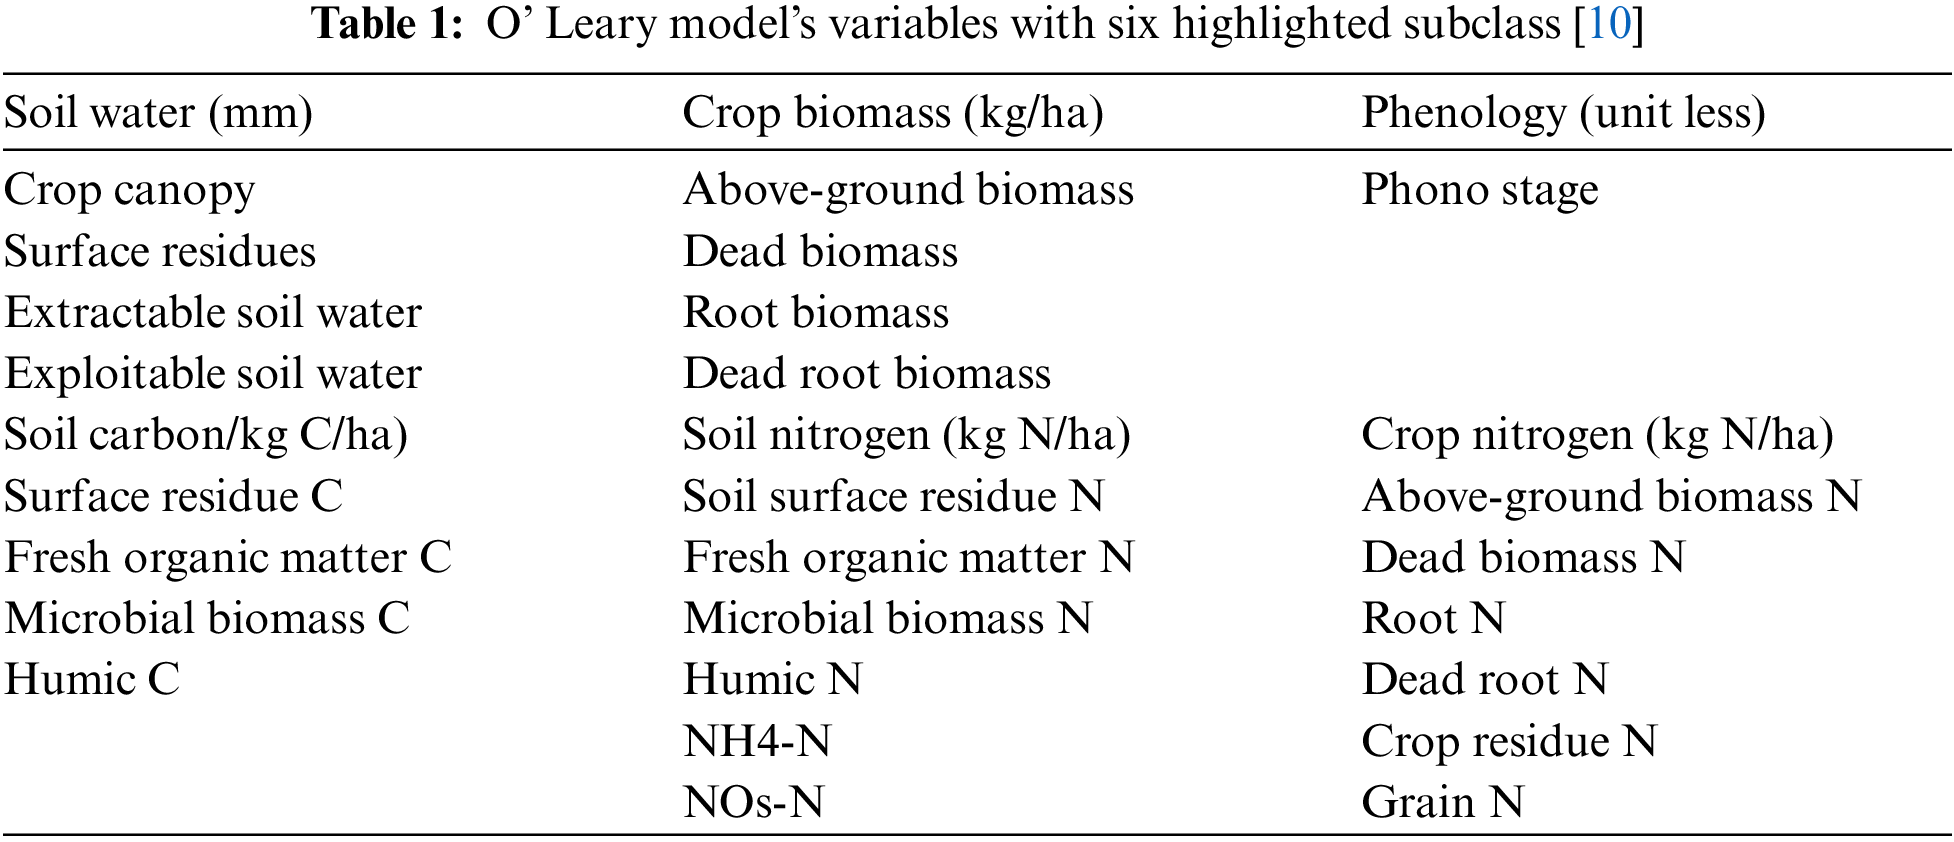
Several mathematical models are available for the simulation of crops which include various variables for crop growth and estimation. In the O’Leary model, there are 27 state variables in six subgroups including soil water, crop biomass, phenology, soil carbon soil nitrogen, and crop nitrogen, as shown in Table 1. Most models have a subset of these.
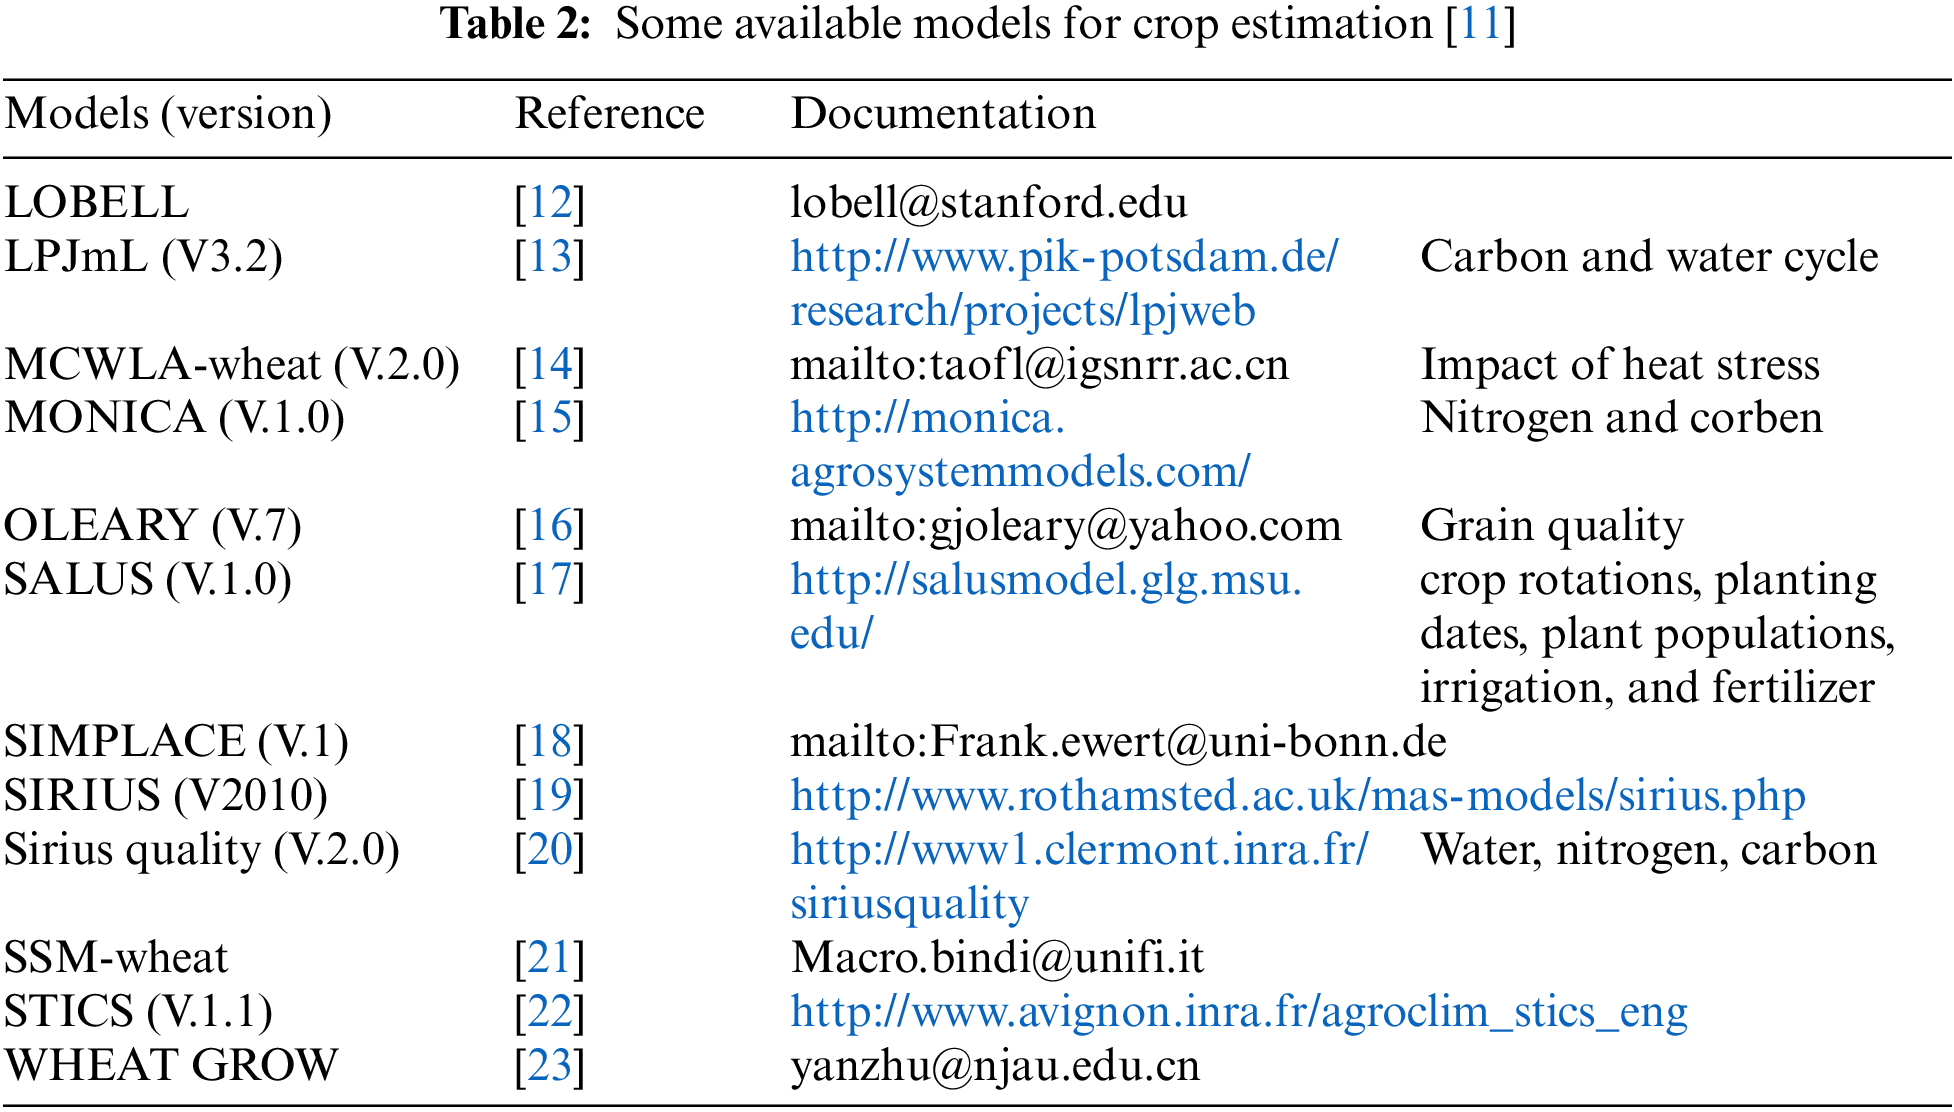
Some popular crop estimation models are given in Table 2. Most of these models are simulated using ground-based assessments rather than remotely sensed data.
Remote sensing has proven to be a game-changer for the agricultural industry since it is one of the interconnections of agricultural precision [24]. Multispectral and hyper-spectral aerial photographs are important in crop management because of their potential to demonstrate crop development. References [25,26] propose a new energy-balanced algorithm, and use the landsat8 images to estimate the potato crop yield.
In [27] the landsat8 and moderate-resolution imaging spectroradiometer (MODIS) images are used for the implementation of the scalable transportable intelligence communications system (STICS) crop estimation model with extra features like leaf area index (LAI), and normalized vegetation index (NDVI). The root mean square error (RMSE) is used for the assessment of model efficiency. In conclusion, the author advised that remote sensing can be used for estimation with a suitable model. The adoption of powerful machine learning algorithms has sparked a surge of interest in land use land cover (LULC) mapping as a subfield of image categorization. Precision and up-to-date LULC models are required for the physical and human environment [28], where they may be applied in a variety of disciplines, including health, ecology, policy management, agriculture, and disaster management [29].
SVM model has shown outstanding performance compared to conventional machine learning classifiers in various studies. References [30,31] classified Landsat8 satellite spectral images using six land use classifications and an SVM classifier, achieving an overall accuracy of 88%. Similarly, [32] employed SVM and RF classifiers to map paddy rice in China. SVM and RF obtained excellent accuracy of 90.8% and 89.2%, respectively, in their investigation using Landsat8 and Sentinel-2 data. Similarly, RF and SVM classifiers achieved 93.2% and 91.4% accuracy in a later study that used Landsat8, Sentinel-1A, and Sentinel-2A data, respectively.
Machine learning classifiers are employed in many remote sensing fields, including mapping land cover [32–35], mapping crops [36], and mapping oil palm trees [37]. Recently, Huiyu Sun proposed [38] a new method to overcome the problem of deep neural networks that requires a substantial amount of training data and time. So deep neural network is preferred in the case of complex data and discriminant features are unknown in the data set. Keeping in view the superior performance of machine learning classifiers, this study adopts a machine learning-based approach to identify wheat crops from Landsat8 imagery. The proposed framework of the wheat species classification model is given in Fig. 1.
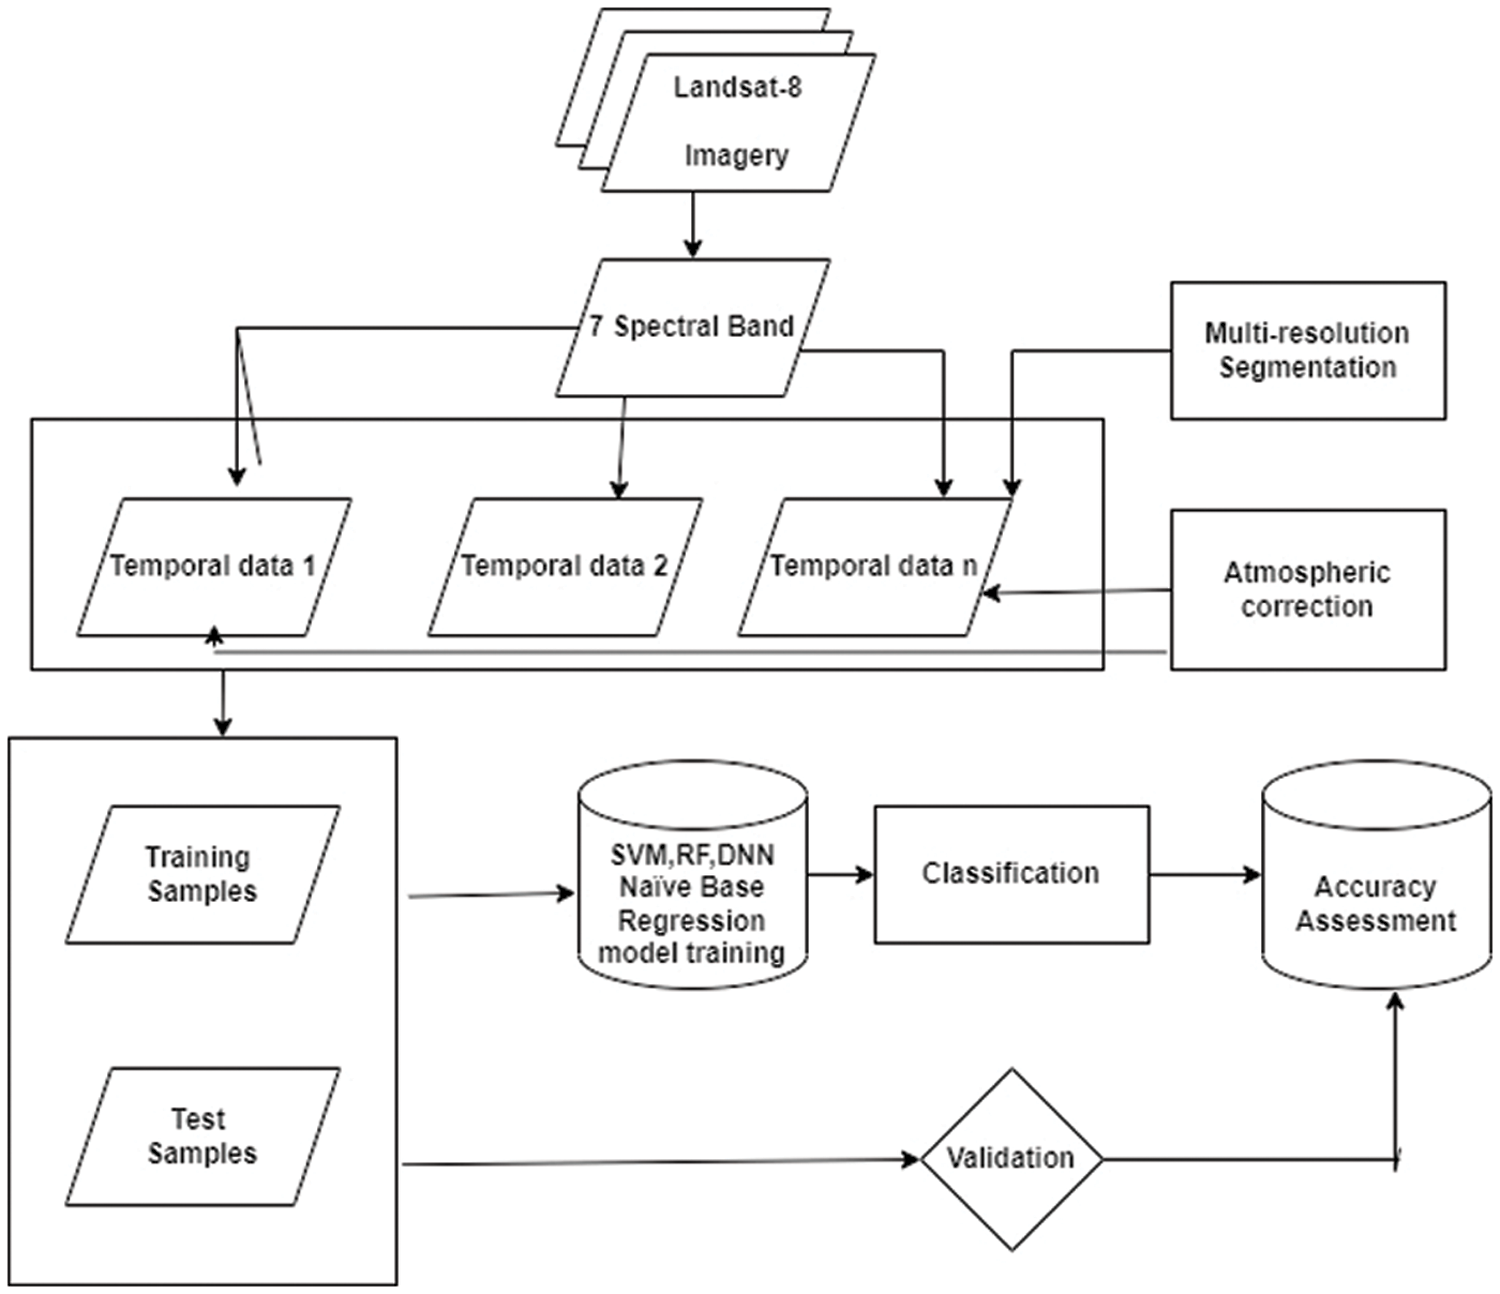
Figure 1: Proposed framework of wheat species classification model
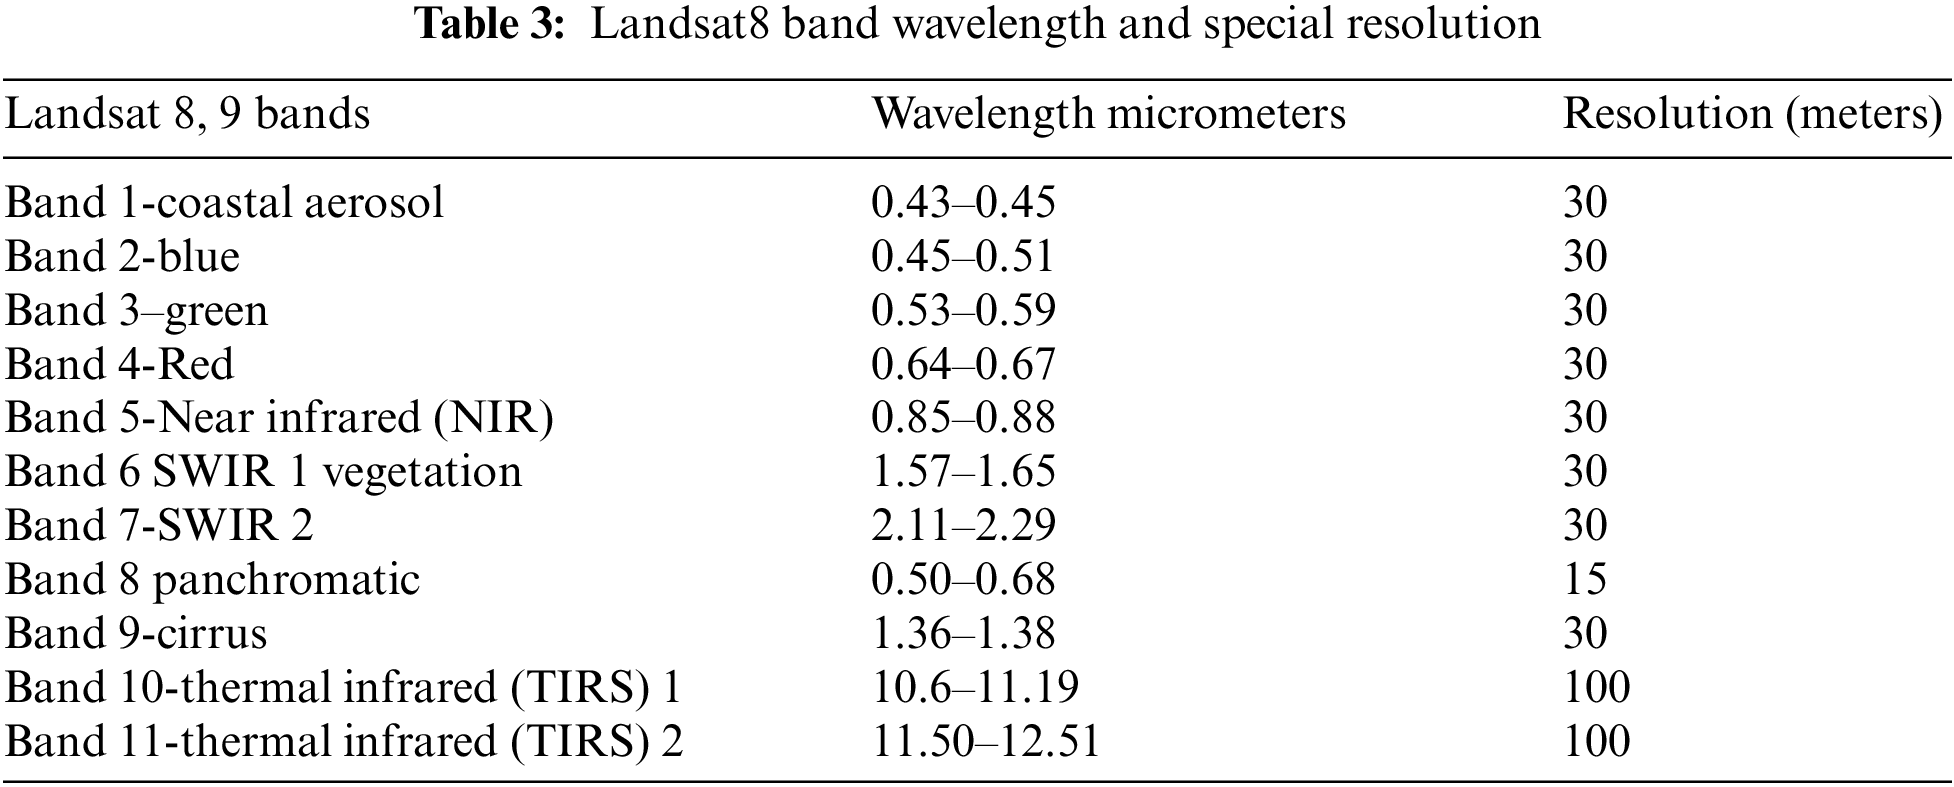
The study was conducted in the irrigated areas of Southern Punjab. Three districts were purposive including Rahim Yar Khan, Liaqatpur, and Bahawalpur for data collection. The multi-spectral Landsat8 OLI images were acquired from 15 November 2020 to 30 March 2021 with fifteen days of temporal resolution and downloaded from the earth resources observation and science center of the US geological survey. The multi-spectral Landsat8 OLI images have a spatial resolution of 30 m and consist of seven bands with a wavelength from 0.4430 to 2.2010 μm (see Table 3).
The study area is a part of Punjab seed corporation quality seed better yield, which is an area of more than 7305 acres located in many cities of Punjab, Pakistan. Punjab seed corporation (PSC) was established in 1976 under the Punjab act. About 6 thousand acres have been used for agricultural, and seed breeding activities. This area is located between lat. 28°15′58.3◦N and lat. 29°22′37″N and long. “70°03′16.4″E and long. 71°46′15″E. About 70% of the company′s lands and all of the wheat fields are irrigated by water from the channel and rainfall.
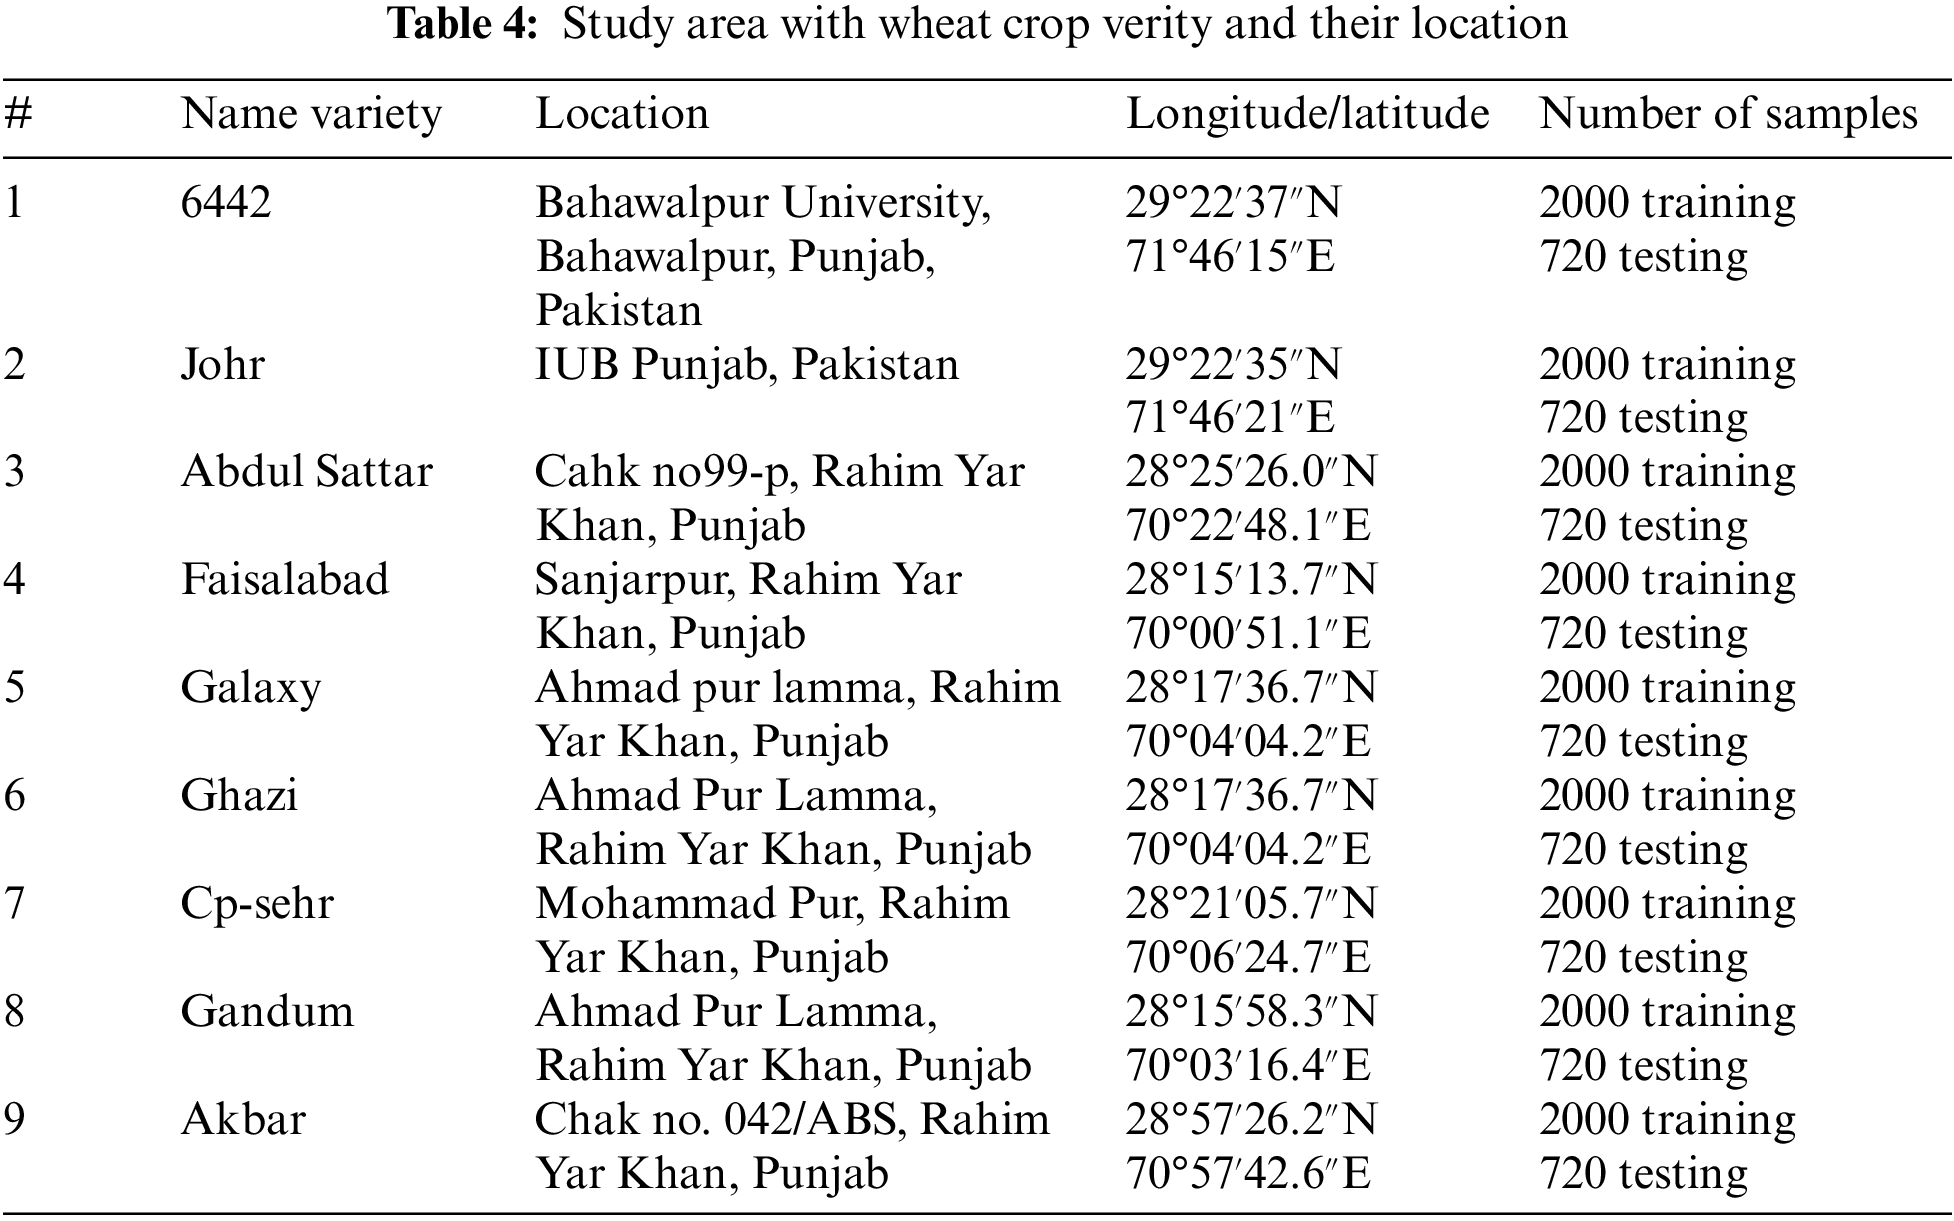
Nine wheat crop varieties are harvested at various places in Punjab, Pakistan by the PSC. First of all, we marked the latitude and longitude of each variety of wheat crop plot per/acre. Later, we set the boundary of each plot using the earth explorer graphical user interface (GUI) and then take 250 sample points from the marked area of interest after every fifteen days during the crop cycle of four months. We selected the period option as given in the earth engine EE-interface. In this way, we obtained 2000 samples of each variety and it becomes a total of 18000 samples for nine wheat crop varieties which are used to train the machine learning models. In this way non overlapped 120 sample points from the marked area of interest are taken after every fifteen days during the crop cycle of four months for model validation. It becomes a total of 6480 samples of which 720 samples belong to each type of crop yield variety. A short description of the data set is given in Table 4.
SVM is a powerful supervised algorithm that works best on smaller but complex datasets. SVM can be used for both regression and classification tasks, but generally, they work best for classification problems. They utilize the concept of hyperplane which is used to separate the class samples. The best hyperplane is the one that has the largest margins between class samples. SVM uses various kernels including the polynomial kernel and the sigmoid kernel. Following is the formula for the polynomial kernel
where d is the degree of the polynomial, which we need to specify manually. Suppose we have two features X1 and X2 and the output variable is Y, so using polynomial kernel we can write it as
So we need to find X12, X22, and X1.X2, and now we can see that 2 dimensions got converted into 5 dimensions.
Besides the polynomial kernel, we can use it as the proxy for neural networks. Equation is:
It is just taking the input, and mapping them to a value of 0 and 1 so that they can be separated by a simple straight line. The graphical representation is given in Fig. 2.
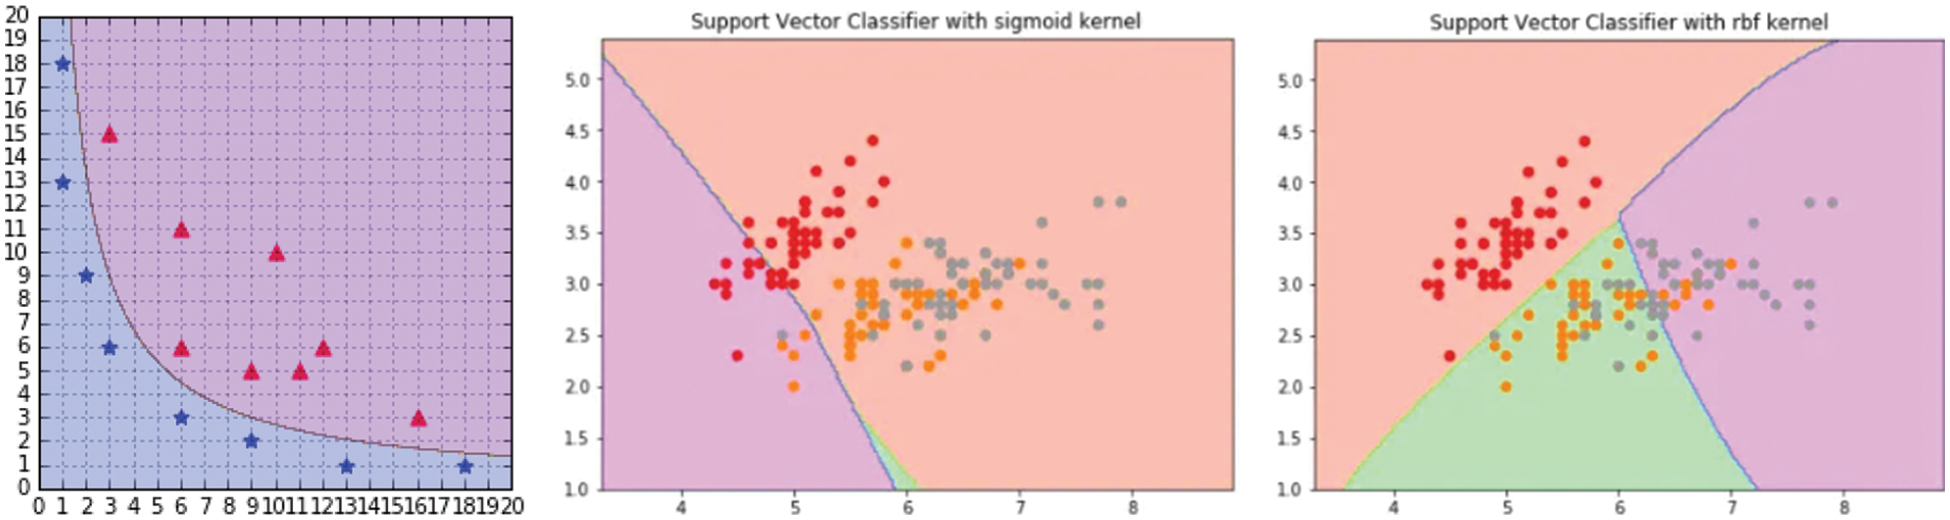
Figure 2: Polynomial, Sigmoid, and RBF kernel of SVM respectively left to right
The radial basis kernel creates non-linear combinations of our features to lift the samples onto a higher-dimensional feature space where we can use a linear decision boundary to separate the classes. It is the most used kernel in SVM classification. The graphical representation of RBF is given in Fig. 2 and the following formula explains it mathematically
where σ is the variance and our hyperparameter, and ||X₁–X₂|| is the Euclidean distance between two points X₁ and X₂
An RF is an ensemble tool that takes a subset of observations and a subset of variables to build a decision tree. A graphical presentation of RF model is given in Fig. 3. It builds multiple such decision trees and amalgamates them together to get a more accurate and stable prediction. This is a direct consequence of the fact that by maximum voting from a panel of independent judges, we get the final prediction better than the best judge.
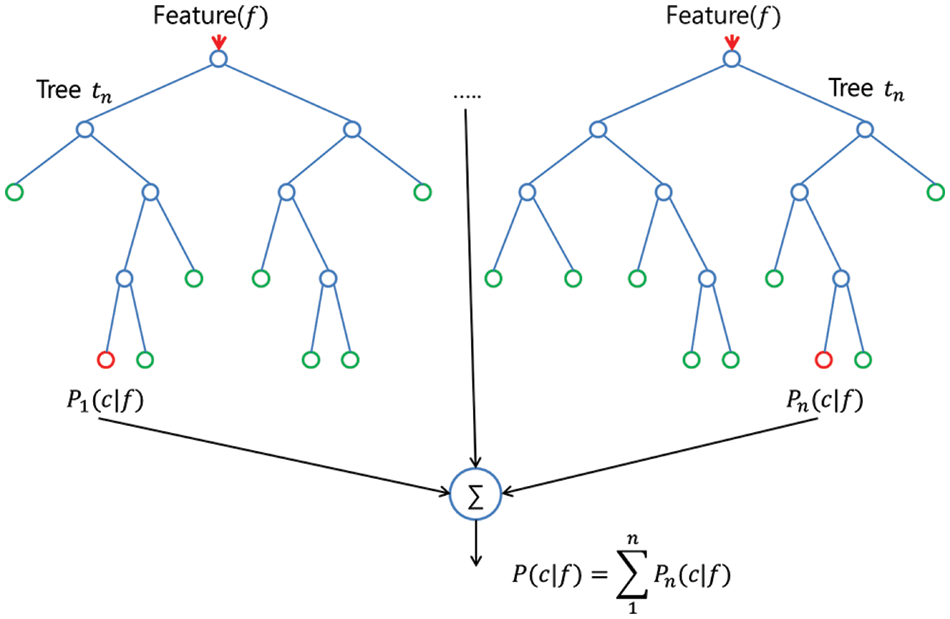
Figure 3: Graphical representation of random forest model
In this algorithm, features are evaluated based on Gini and entropy. There are primarily 3 parameters that can be tuned to improve the predictive power of the model. Max features are the maximum number of features RF is allowed to try in the individual tree. There are multiple options available in Python to assign maximum features. Increasing max-features generally improves the performance of the model as at each node now we have a higher number of options to be considered. However, this is not necessarily true as this decreases the diversity of individuals. But, for sure, the speed of the algorithm is decreased by increasing the max features. Hence, we need to strike the right balance and choose the optimal max-features.
N-estimator is the number of trees we want to build before taking the maximum voting or averages of predictions. A higher number of trees gives better performance but makes the code slower. We should choose as high a value as the processor can handle because this makes the predictions stronger and more stable.
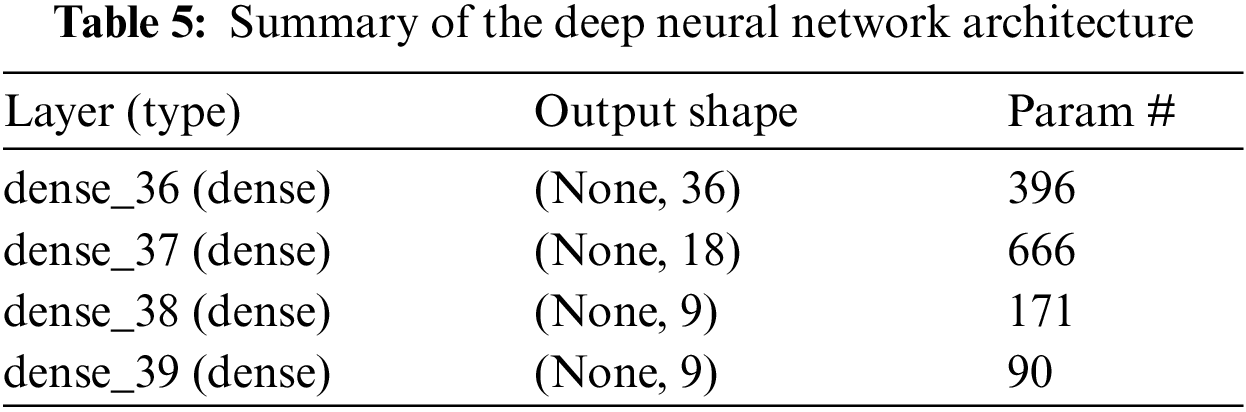
DNN’s overall accuracy is frequently superior to other machine learning techniques. However, understanding of these methodologies is limited, and the higher an individual model’s capacity to learn, the more difficult it is to interpret the algorithm’s results. It is critical to keep in mind when utilizing these algorithms that they are not interpretable by humans. For many users, it is critical not only to select an algorithm with a high degree of accuracy but also to comprehend how the algorithm generates the predictions. When forecasts are used to make decisions, as they are in the medical, commercial, or banking/payments sectors, the interpretability of the projections becomes critical. So in this study, DNN is applied in various experiments with different settings of hidden layers, learning rate, etc. The number of iterations and activation functions are changed and the optimal architecture is gained to get good results. The summary of DNN parameters is given in Table 5.
The results of the SVM using all kernels are shown below using a percentage bar chart. It is observed that the radial-based function performed best, as shown in Fig. 4.
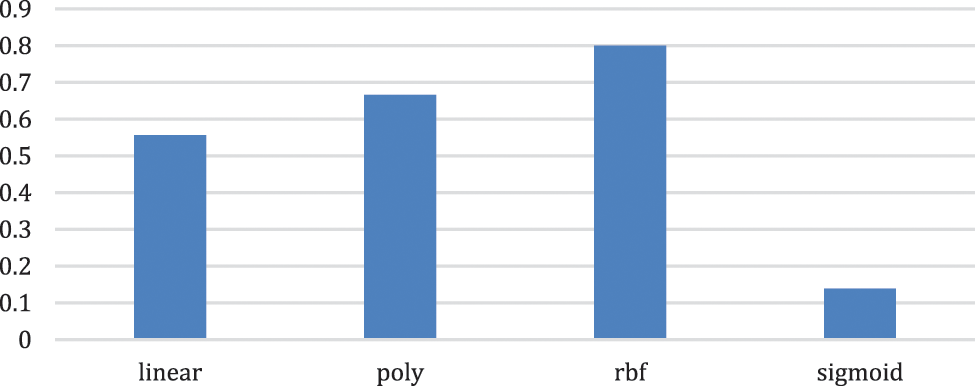
Figure 4: Percentage bar chart of SVM of all kernels
According to the percentage bar chart, the RBF kernel has a maximum overall accuracy of 80%. Of the sample, 80% are correctly classified while 20% of samples are misclassified. A multiple bar chart of each wheat crop is given in Fig. 5.
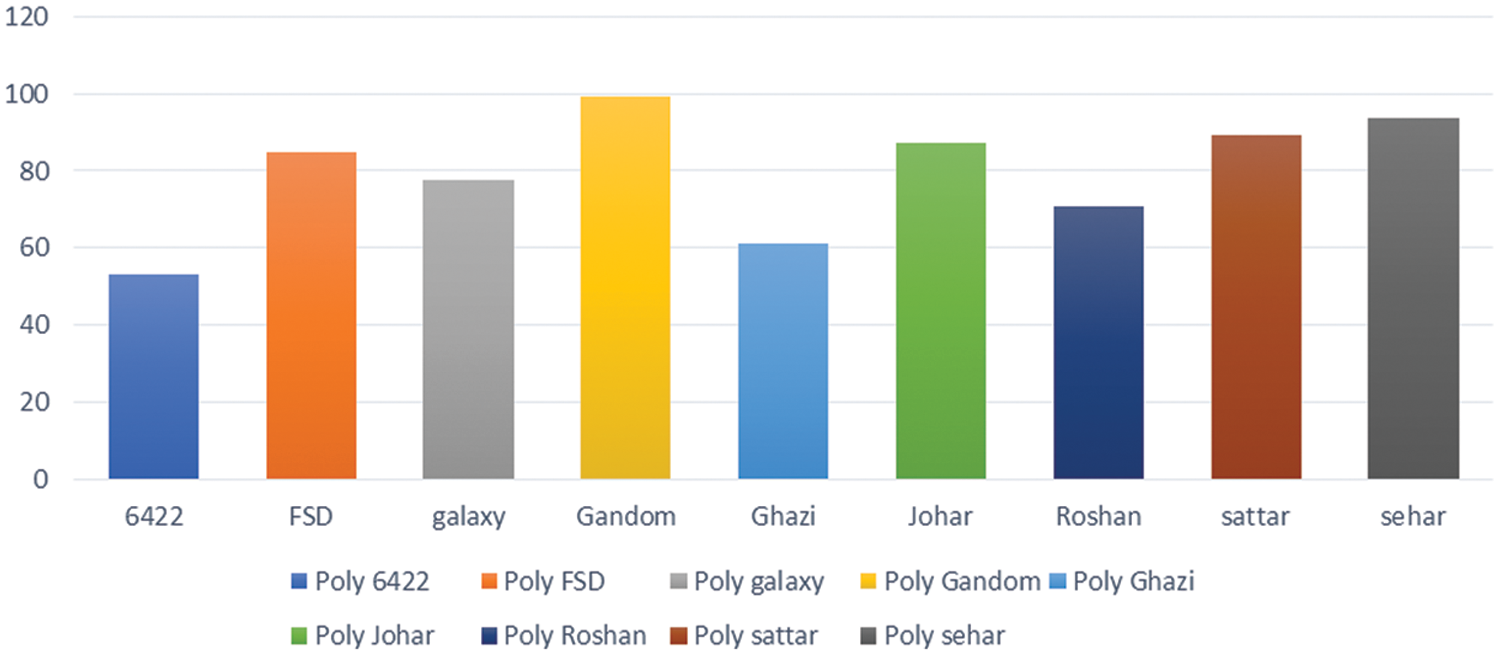
Figure 5: Percentage bar chart of RBF kernel of SVM
The result of the deep neural network is much better than the SVM of radial-based function which is improved by 80% to 91%. A percentage multiple bar chart is given below in Fig. 6. The DNN shows misclassification just in two classes ‘6422′ and ‘Ghazi’ which have 37% and 63% accuracy scores, respectively. As a result, the average accuracy of the DNN is reduced.
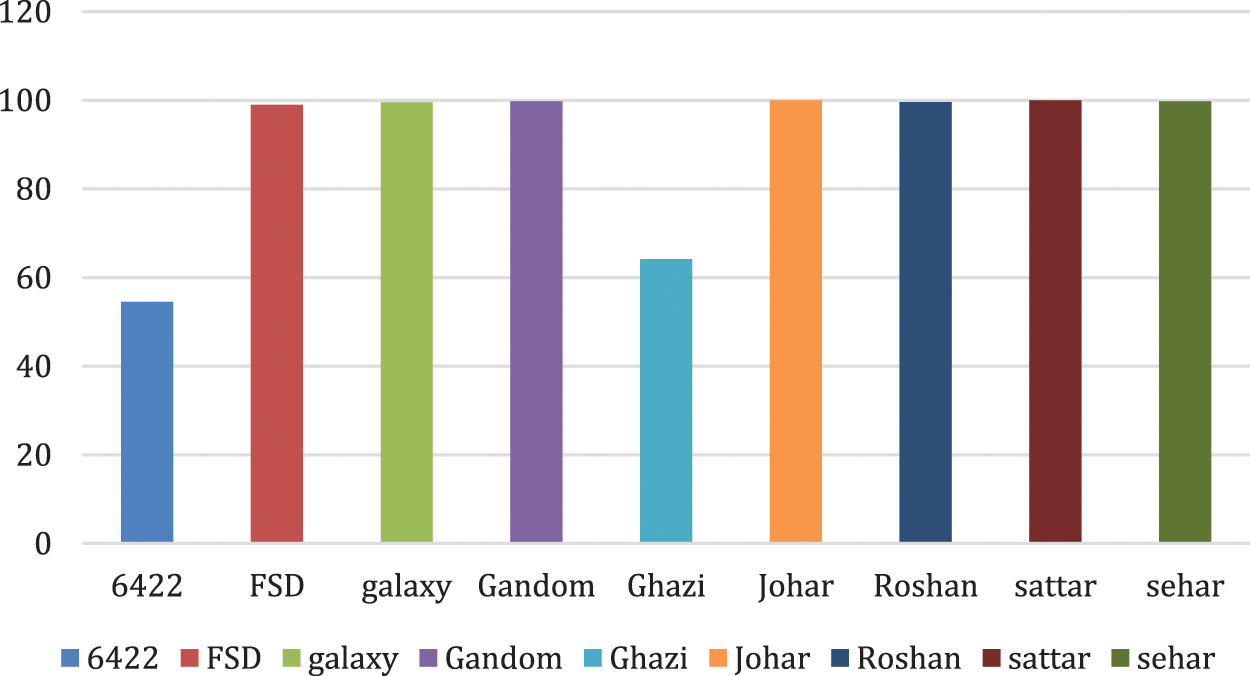
Figure 6: Percentage bar chart of DNN for each wheat crop
When the same dataset is deployed with the RF algorithm, the model gives a considerably better performance as compared to SVM and is approximately similar to that of DNN. Due to the complexity of the DNN and the required more computational power as compared to the RF, DNN is not preferred for the classification of remotely sensed spectral data in this case. The result of the classification is given in Fig. 7.
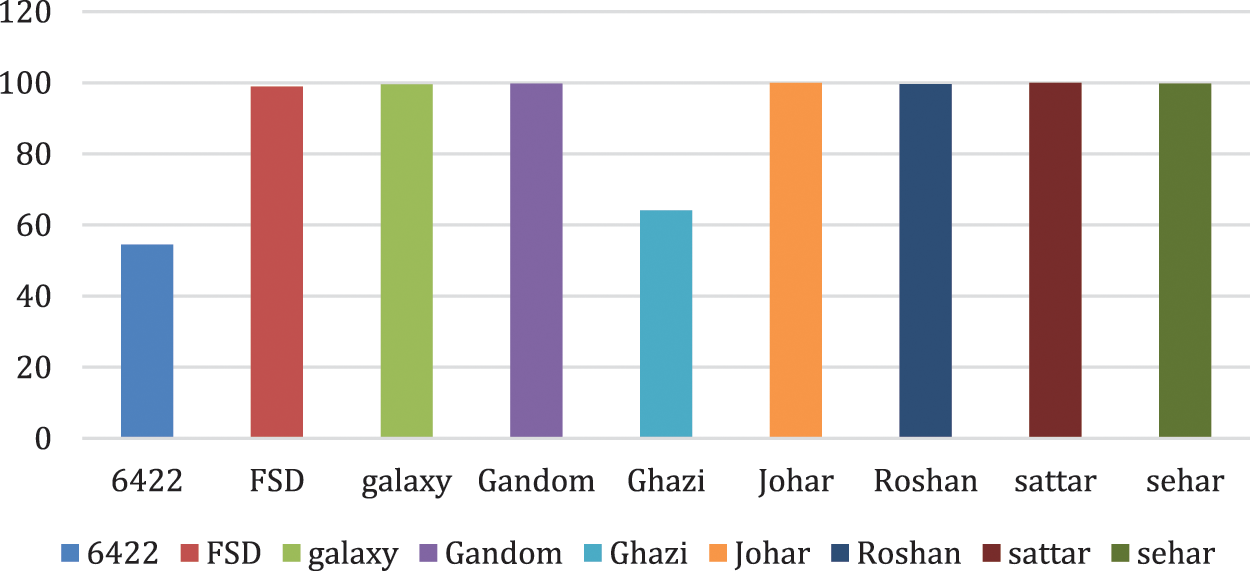
Figure 7: Percentage bar chart of RF model
For better visualization of the performance of all classifiers, multiple percentage bar charts are created using the classifiers used in this study. The performance of RF represented by the green bar is showing higher accuracy for all crop varieties except for the ‘Ghazi’ and ‘6422′ classes. The classification accuracy for these classes is lower for each model.
The overall accuracy of each machine learning algorithm is shown in Table 6. Visual representation of results is provided in Fig. 8. Results show that the multinomial NB model has poor performance for micro-class classification while RF and DNN models have approximately 91% accuracy.
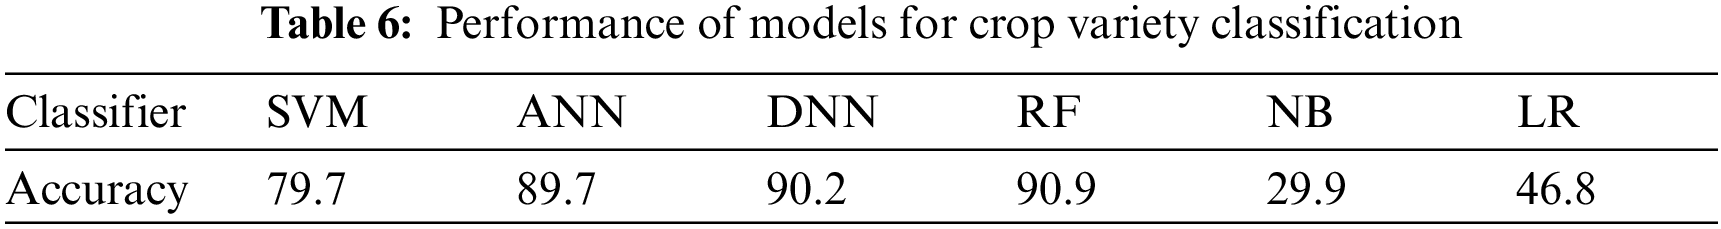
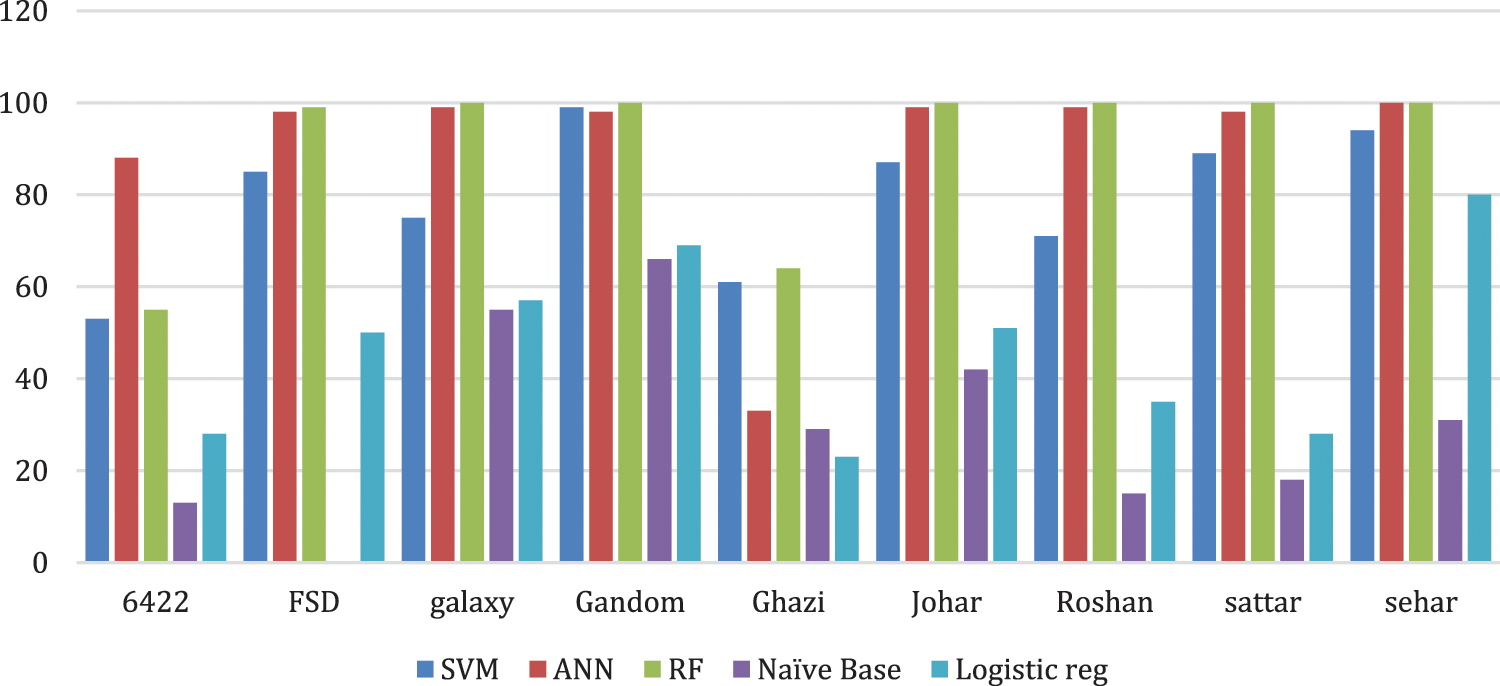
Figure 8: Comparison of five machine learning classifiers used in this study
Using remote sensing imagery is important to determine crop type and crop yield in the agriculture sector. This study uses satellite Landsat8 OLI spectral data collected over the life cycle of nine types of wheat crops in Pakistan. Wheat varieties are classified using five well-known supervised machine learning algorithms SVM, ANN, RF, NB, and LR and DNN model. Results indicate that approximately 91% accuracy can be obtained using RF. The performance of the DNN is marginally lower with 90.2% accuracy. Other machine learning models perform poorly with NB showing the lowest accuracy of 29.9%. RF is preferred over DNN due to the DNN requirement for a large amount of data and higher computational resources. Results indicate that remotely sensed data can be used to segment the wheat crop species. In the comparison of five classifiers, it is observed that the RF model is the best for the classification of remotely sensed data using satellite landsat8 OLI/TIRS data. The current study helps to improve the crop estimation models and also supports classifying crop species at the country level every fifteen days automatically. Decision-makers can manage and take necessary actions for food security and increase the production of wheat.
Acknowledgement: We are thank full to all my fellows and faculty members who support us to complete this work.
Supplementary Materials: The following supporting information can be downloaded at: https://github.com/mutiullah/Landsat8-wheat-crops, Dataset used in this research. Location of samples with their labels
Funding Statement: The authors received no specific funding for this study.
Conflicts of Interest: The authors declare that they have no conflicts of interest to report regarding the present study.
References
1. F. Z. Jatoi, “Agriculture in Pakistan and it’s impact on Economic growth,” Institute of Business Management Available at SSRN3771914, vol. 3771914, pp. 1–21, 2020. https://doi.org/10.2139/ssrn.3771914. [Google Scholar]
2. Y. Liu, A. Amin, S. F. Rasool and Q. U. Zaman, “The role of agriculture and foreign remittances in mitigating rural poverty: Empirical evidence from Pakistan,” Risk Management and Healthcare Policy, vol. 13, no. 1, pp. 13–21, 2020. [Google Scholar]
3. A. Azam and M. Shafique, “Agriculture in Pakistan and its impact on economy, A review,” International Journal of Advanced Science and Technology, vol. 103, no. 2, pp. 47–60, 2017. [Google Scholar]
4. T. Pacetti, E. Caporali and M. C. Rulli, “Floods and food security: A method to estimate the effect of inundation on crops availability,” Advances in Water Resources, vol. 110, no. 3, pp. 494–504, 2017. [Google Scholar]
5. A. Farooq, M. Ishaq, S. Yaqoob and K. N. J. S. J. O. A. Sadozai, “Varietal adoption effect on wheat crop production in irrigated areas of NWFP,” Sarhad Journal of Agriculture, vol. 23, no. 3, pp. 807–817, 2007. [Google Scholar]
6. A. M. Ficiciyan, J. Loos and T. Tscharntke, “Similar yield benefits of hybrid, conventional, and organic tomato and sweet pepper varieties under well-watered and drought-stressed conditions,” Frontiers in Sustainable Food Systems, vol. 5, no. 1, pp. 41–52, 2021. [Google Scholar]
7. K. Singila, “Crop yield prediction techniques using remote sensing data,” International Journal of Engineering & Advanced Technology (IJEAT), vol. 9, no. 3, pp. 3683–3689, 2021. [Google Scholar]
8. Q. Huang, Z. Chen, W. Wu, A. de Wit, F. Teng et al., “China crop growth monitoring system-methodology and operational activities overview,” in 2011 IEEE Int. Geoscience and Remote Sensing Symp., 2011: IEEE, Vancouver, Canada, pp. 2961–2964, 2011. [Google Scholar]
9. J. Ali and M. J. S. J. O. A. Akmal, “Yield comparison of some improved wheat varieties under different sowings dates as rainfed crop,” Sarhad Journal of Agriculture, vol. 32, no. 2, pp. 89–95, 2016. [Google Scholar]
10. G. J. O’Leary and D. J. Connor, “A simulation model of the wheat crop in response to water and nitrogen supply: II. model validation,” Agricultural Systems, vol. 52, no. 1, pp. 31–55, 1996. [Google Scholar]
11. A. M. S. Kheir, Z. Ding, M. G. M. Ali, T. Feike, A. I. N. Abdelaal et al., “Wheat crop modelling for higher production,” In Systems Modeling: Springer, vol. 12, no. 1, pp. 179–202, 2020. [Google Scholar]
12. S. M. Gourdji, K. L. Mathews, M. Reynolds, J. Crossa and D. B. Lobell, “An assessment of wheat yield sensitivity and breeding gains in hot environments,” Proceedings of the Royal Society B: Biological Sciences,vol. 280, no. 1752, pp. 2012–2190, 2013. [Google Scholar]
13. T. Beringer, W. Lucht and S. Schaphoff, “Bioenergy production potential of global biomass plantations under environmental and agricultural constraints,” Gcb Bioenergy, vol. 3, no. 4, pp. 299–312, 2011. [Google Scholar]
14. F. Tao and Z. Zhang, “Climate change, wheat productivity and water use in the North China plain: A new super-ensemble-based probabilistic projection,” Agricultural and Forest Meteorology, vol. 170, pp. 146–165, 2013. [Google Scholar]
15. C. Nendel, M. Berg, K. C. Kersebaum, W. Mirschel, X. Specka et al., “The MONICA model: Testing predictability for crop growth, soil moisture and nitrogen dynamics,” Ecological Modelling, vol. 222, no. 9, pp. 1614–1625, 2011. [Google Scholar]
16. G. J. O’Leary, B. Christy, J. Nuttall, N. Huth, D. Cammarano et al., “Response of wheat growth, grain yield and water use to elevated CO 2 under a free-Air CO 2 enrichment (FACE) experiment and modelling in a semi-arid environment,” Global Change Biology, vol. 21, no. 7, pp. 2670–2686, 2015. [Google Scholar]
17. B. Basso, D. Cammarano, A. Troccoli, D. Chen and J. T. Ritchie, “Long-term wheat response to nitrogen in a rainfed Mediterranean environment: Field data and simulation analysis,” European Journal of Agronomy, vol. 33, no. 2, pp. 132–138, 2010. [Google Scholar]
18. C. Angulo, R. Rötter, R. Lock, A. Enders, S. Fronzek et al., “Implication of crop model calibration strategies for assessing regional impacts of climate change in Europe,” Agricultural and Forest Meteorology, vol. 170, no. 1, pp. 32–46, 2013. [Google Scholar]
19. M. A. Semenov and P. R. Shewry, “Modelling predicts that heat stress, not drought, will increase vulnerability of wheat in Europe,” Scientific Reports, vol. 1, no. 1, pp. 1–5, 2011. [Google Scholar]
20. J. He, P. Stratonovitch, V. Allard, M. A. Semenov and P. Martre, “Global sensitivity analysis of the process-based wheat simulation model siriusquality1 identifies key genotypic parameters and unravels parameters interactions,” Procedia-Social and Behavioral Sciences, vol. 2, no. 6, pp. 7676–7677, 2010. [Google Scholar]
21. A. Soltani, V. Maddah and T. Sinclair, “SSM-Wheat: A simulation model for wheat development, growth and yield,” International Journal of Plant Production, vol. 7, no. 4, pp. 711–740, 2013. [Google Scholar]
22. N. Brisson, C. Gary, E. Justes, R. Roche, B. Mary et al., “An overview of the crop model STICS,” European Journal of Agronomy, vol. 18, no. 3–4, pp. 309–332, 2003. [Google Scholar]
23. J. Pan, Y. Zhu and W. Cao, “Modeling plant carbon flow and grain starch accumulation in wheat,” Field Crops Research, vol. 101, no. 3, pp. 276–284, 2007. [Google Scholar]
24. M. M. J. A. Awad, “Toward precision in crop yield estimation using remote sensing and optimization techniques,” Agriculture, vol. 9, no. 3, pp. 54–63, 2019. [Google Scholar]
25. J. Zhao, A. Kumar, B. N. Banoth, B. Marathi, P. Rajalakshmi et al., “Deep-learning-based multispectral image reconstruction from single natural color RGB image—Enhancing UAV-based phenotyping,” Remote Sensing, vol. 14, no. 5, pp. 1272–1284, 2022. [Google Scholar]
26. J. J. Boon, “Combining cross-platform remotely sensed imagery for potato tuber yield estimation,” Geo-information Science and Remote Sensing, vol. 9, no. 3, pp. 1–120, 2020. [Google Scholar]
27. J. Rodriguez, B. Duchemin, R. Hadria, C. Watts, J. Garatuza et al., “Wheat yield estimation using remote sensing and the STICS model in the semiarid yaqui valley, Mexico,” Agronomie, vol. 24, no. 6–7, pp. 295–304, 2004. [Google Scholar]
28. A. Jamali, A. A. Jtoi and I. A. Rahman, “Evaluation of advanced data mining algorithms in land Use/land cover mapping,” Remote Sensing, and S. I. Sciences, vol. 42, no. 4, pp. 16–25, 2019. [Google Scholar]
29. A. Bégué, D. Arvor, B. Bellon, J. Betbeder, D. De Abelleyra et al., “Remote sensing and cropping practices: A review,” Remote Sensing, vol. 10, no. 1, pp. 99–109, 2018. [Google Scholar]
30. M. M. Caldas, D. Goodin, S. Sherwood, J. M. Campos Krauer and S. M. Wisely, “Land-cover change in the Paraguayan Chaco: 2000–2011,” Journal of Land Use Science, vol. 10, no. 1, pp. 1–18, 2015. [Google Scholar]
31. G. Mountrakis, J. Im and C. Ogole, “Support vector machines in remote sensing: A review,” ISPRS Journal of Photogrammetry and Remote Sensing, vol. 66, no. 3, pp. 247–259, 2011. [Google Scholar]
32. L. Yang, L. R. Mansaray, J. Huang and L. Wang, “Optimal segmentation scale parameter, feature subset and classification algorithm for geographic object-based crop recognition using multisource satellite imagery,” Remote Sensing, vol. 11, no. 5, pp. 514–524, 2019. [Google Scholar]
33. W. S. Lee, V. Alchanatis, C. Yang, M. Hirafuji, D. Moshou et al., “Sensing technologies for precision specialty crop production,” Computers and Electronics in Agriculture, vol. 74, no. 1, pp. 2–33, 2010. [Google Scholar]
34. Q. Salman, S. F. Qadri, M. Husnain, M. M. S. Missen, D. M. Khan et al., “Machine vision approach for classification of citrus leaves using fused features,” International Journal of Food Properties, vol. 22, no. 1, pp. 2072–2089, 2019. [Google Scholar]
35. Q. Salman, D. M. Khan, S. F. Qadri, A. Razzaq, J. Mutiullah et al., “Multisource data fusion framework for land use/land cover classification using machine vision,” Journal of Sensors, vol. 1, no. 2, pp. 3–14, 2017. [Google Scholar]
36. N. Kussul, M. Lavreniuk, S. Skakun and A. Shelestov, “Deep learning classification of land cover and crop types using remote sensing data,” IEEE Geoscience and Remote Sensing Letters, vol. 14, no. 5, pp. 778–782, 2017. [Google Scholar]
37. W. Li, H. Fu, L. Yu and A. Cracknell, “Deep learning based oil palm tree detection and counting for high-resolution remote sensing images,” Remote Sensing, vol. 9, no. 1, pp. 22–33, 2016. [Google Scholar]
38. H. Sun and R. Grishman, “Lexicalized dependency paths based supervised learning for relation extraction,” Computer Systems Science and Engineering, vol. 43, no. 3, pp. 861–870, 2022. [Google Scholar]
Cite This Article
 Copyright © 2023 The Author(s). Published by Tech Science Press.
This work is licensed under a Creative Commons Attribution 4.0 International License , which permits unrestricted use, distribution, and reproduction in any medium, provided the original work is properly cited.
 Downloads
 Citation Tools