
 Submit a Paper
 Propose a Special lssue
 Open Access
ARTICLE
Multimodality Medical Image Fusion Based on Pixel Significance with Edge-Preserving Processing for Clinical Applications
1 Department of ECE and UCRD, Chandigarh University, Mohali, Punjab, 140413, India
2 Chitkara University Institute of Engineering and Technology, Chitkara University, Punjab, 140401, India
3 Department of ECE, Uttaranchal Institute of Technology, Uttaranchal University, Dehradun, 248007, India
4 IES College of Technology, IES University, Bhopal, 462044, India
5 College of Technical Engineering, The Islamic University, Najaf, 54001, Iraq
6 Department of Electrical Engineering, University of North Florida, Jacksonville, FL, 32224, USA
* Corresponding Author: Manob Jyoti Saikia. Email:
Computers, Materials & Continua 2024, 78(3), 4317-4342. https://doi.org/10.32604/cmc.2024.047256
Received 31 October 2023; Accepted 11 January 2024; Issue published 26 March 2024
 View Full Text
 Download PDF
Abstract
Multimodal medical image fusion has attained immense popularity in recent years due to its robust technology for clinical diagnosis. It fuses multiple images into a single image to improve the quality of images by retaining significant information and aiding diagnostic practitioners in diagnosing and treating many diseases. However, recent image fusion techniques have encountered several challenges, including fusion artifacts, algorithm complexity, and high computing costs. To solve these problems, this study presents a novel medical image fusion strategy by combining the benefits of pixel significance with edge-preserving processing to achieve the best fusion performance. First, the method employs a cross-bilateral filter (CBF) that utilizes one image to determine the kernel and the other for filtering, and vice versa, by considering both geometric closeness and the gray-level similarities of neighboring pixels of the images without smoothing edges. The outputs of CBF are then subtracted from the original images to obtain detailed images. It further proposes to use edge-preserving processing that combines linear lowpass filtering with a non-linear technique that enables the selection of relevant regions in detailed images while maintaining structural properties. These regions are selected using morphologically processed linear filter residuals to identify the significant regions with high-amplitude edges and adequate size. The outputs of low-pass filtering are fused with meaningfully restored regions to reconstruct the original shape of the edges. In addition, weight computations are performed using these reconstructed images, and these weights are then fused with the original input images to produce a final fusion result by estimating the strength of horizontal and vertical details. Numerous standard quality evaluation metrics with complementary properties are used for comparison with existing, well-known algorithms objectively to validate the fusion results. Experimental results from the proposed research article exhibit superior performance compared to other competing techniques in the case of both qualitative and quantitative evaluation. In addition, the proposed method advocates less computational complexity and execution time while improving diagnostic computing accuracy. Nevertheless, due to the lower complexity of the fusion algorithm, the efficiency of fusion methods is high in practical applications. The results reveal that the proposed method exceeds the latest state-of-the-art methods in terms of providing detailed information, edge contour, and overall contrast.Keywords
Numerous developments have been revolutionized in the domain of medical imaging systems for clinical applicability due to technological advancements, including growth in the number of imaging modalities. To accurately diagnose diseases, doctors need details from different imaging sources [1,2]. In particular, computed tomography (CT) images provide information about dense bone structures; however, they cannot provide any details of internal organs. Similarly, the hard tissue contrast is visible in the magnetic resonance imaging (MRI) images, but bone information is missing. As a result of the limitations of a single image, it is incapable of providing all of the necessary information. Thus, medical image fusion plays a pivotal role for doctors or radiologists because it fuses two or multiple medical images of different modalities that provide high-quality images for better disease diagnosis. MRI and CT image fusion allows us to fuse images of connective tissue details obtained from MRI images and details of vertebral anatomy from images, allowing physicians to better interpret and treat patients [3,4]. Image fusion attempts to fuse the requisite details from both images into a single image by taking care not to introduce artifacts in the images [5]. Different fusion algorithms have been developed to solve the issues of medical imaging images over the past several decades [6]. The conventional image fusion strategies in general are grouped into spatial and transform domain techniques. The fusion of images based on blocks, pixels, or regions is known as spatial domain algorithms [7,8]. In addition, transform domain methods are based on the principle of transforming an image into another domain by using the domain’s characteristics to accomplish the objective more accurately [9–11]. These techniques, however, are not very good at fusing specific information from images, resulting in the generation of artifacts. Research on pixel-level fusion has been performed over the past 30 years, with over 1000 affiliated scientific papers published during this period. In recent times, deep learning-based techniques [12,13] have made massive advancements in numerous areas of image processing and computer vision, i.e., segmentation, super-resolution, classification, detection, denoising, and others. Numerous algorithms are proposed based on cross-bilateral filters [14,15]. Like a bilateral filter, cross bilateral filter considers both grey level similarities and geometric closeness of the neighboring pixels without smoothing edges, but it uses one image for finding the kernel and another to filter, and vice versa. In these methods, an image is decomposed into an energy layer with pure intensity information and a structure layer with rich details. Then, the visual saliency detection map (VSDM) is used to guide the fusion of the energy layers to take full advantage of the edge contour extraction to improve the edge contour sharpness of the fused image and to retain the image detail information fully. They use average cross-bilateral filtering (ACBF) to decompose the source image into smooth layers (SL) and detail layers (DL). Then, the traditional ABS-MAX method is used to fuse the smooth layer, and the neighborhood energy sum (NES) method is used to fuse the detail layer. Finally, the final fused image is obtained by adding the fused smooth layer and detail layer.
Deep learning algorithms have become an active topic in recent times in the domain of image fusion technology. Wide-ranging deep learning-based algorithms have been developed in recent years. In addition, generative adversarial network (GAN)-based image fusion has recently become increasingly significant. GANs are a new generative modal proposed by Goodfellow [16], which aims to compute target distributions and generative information that match a point distribution without depending on any prior assumptions. In the past few years, GANs have been often utilized in numerous visual interpretation applications with excellent results [17,18]. While current approaches have achieved optimistic performance in the majority of problems, many features could still be improved. In general, earlier methods needed manual construction of activity-level calculations and fusion regulations that limited fusion performance due to their difficulty in considering all the components in a single manual design process. Secondly, several current algorithms perform multisensory/multifocus image fusion by creating a decision map, which usually provides classification problems based on sharpness detection. Near the boundary lines, these approaches usually fail to distinguish between a focused and unfocused region. Third, when creating a decision map, almost all deep learning-based approaches need post-processing, i.e., consistency checks, which greatly enhances the complexity of techniques. Further, these approaches usually require the manual development of a decision map as ground truth for training the network which further limits their applications.
In addition, transformer-based models are playing a pivotal role in medical imaging analysis [19,20]. Zhang et al. [21] introduced TransFusion, a transformer-based end-to-end architecture for medical picture fusion. The suggested TransFusion fusion approach introduces the transformer as the fusion strategy, which uses its self-attention mechanism to incorporate global contextual information from multimodal aspects and fuse them appropriately. Furthermore, unlike classic parallel multibranch designs or shared networks used for many inputs, they construct branch networks that interact at multiple scales using fusion transformers to better utilize information from different modalities. Yu et al. proposed an end-to-end image fusion network based on the Swin-Transformer mechanismcapable of fusing both local and long-range (or global context) image information [22]. The proposed network is trained in two stages. In the first step, it trains a multi-layer transformer-based autoencoder network to extract shallow and multi-scale deep features. In the second phase, numerous features are fused using transformers and convolutional neural networks (CNNs), which have the potential to collect both local and long-range features. For multimodal medical image fusion, a model that combines the CNN module and the transformer module is presented [23]. The CNN module is used to extract image detail texture information, whereas the transformer module is used to extract image pixel intensity distribution information. Extensive experimental results in the Harvard Brain Atlas test dataset show that the proposed method outperforms comparable methods.
In this study, an upgraded version of the image fusion strategy is proposed by integrating all the vital information found in each input image and utilizing a cross-bilateral filter to obtain detailed images after subtracting them from the source images. Then the method employs a combination of a linear lowpass filter and nonlinear processing of residuals to find and reconstruct meaningful edges in lowpass-filtered images. Thus, residuals are then computed and divided into two fractions, one for the positive portion of pixels and the other for the absolute value of the negative portion. To locate the strong edges, i.e., high-contrast ones, thresholding is applied to both fractions. The results of thresholding are then utilized as markers for the morphological reconstruction of residuals. To recover meaningful edges, restored residuals that do not hold meaningful imaging elements are applied to low-pass filtered images. The edge-recovered images are then used for the computation of weights. The estimated weights are integrated with the input images to obtain the final fusion output.
The main contributions were as follows:
1. This study develops a competent image fusion strategy by combining multimodal medical images using pixel significance with edge-preserving processing, which is capable of performing image fusion tasks effectively.
2. This methodology boosts the fusion results by incorporating relevant visual information by estimating weights from the detailed images. Further, this technique is incredibly simple in implementation and computation.
3. In addition, it uses non-linear filtering that considers localizing and recovering relevant edges from the source images, thereby preventing the development of artifacts within the image regions and boosting visual perception.
4. This methodology can be utilized for implementing a manageable edge-aware image blur with contrast enhancement, thus improving the image quality while maintaining a precise amount of information.
5. Lastly, our methodology is compared with other state-of-the-art image fusion algorithms by considering benchmark medical image fusion datasets.
The remainder of the study is structured as follows: In Section 2, we briefly illustrate existing literary works based on image fusion. The proposed method is systematically described in Section 3. Section 4 demonstrates quality evaluation metrics, experimental details, and both qualitative and quantitative findings. Section 5 concludes with the proposed method.
Several image fusion approaches have been introduced in recent decades [24,25]. The majority of prior fusion techniques consist of decomposition and learning-based techniques [9,26]. The multiscale transform is a broadly used decomposition algorithm for the fusion of images that contains three stages in fusion practice: decomposition, fusion, and restoration [27]. The multiscale transform generally employs wavelet-based, pyramid-based, and multi-geometric analysis-based approaches. The non-subsampled contourlet transform (NSCT) [10] and non-subsampled shearlet transform (NSST) [28] domain-based algorithms have shown promising image representations. Moreover, during image transformation, a pivotal problem of the multiscale transform-based fusion approach is the analysis of frequency components. The activity level of high-frequency components has traditionally been determined by their absolute values. It is measured in a window- or pixel-based manner, and the fused coefficient is obtained using a simple function scheme, including a selection of the maximum or weighted average.
Early research found that averaging a coefficient of numerous source images was a prominent low-frequency image fusion strategy. More complex image conversions and fusion approaches have been introduced in recent years [29,30]. Zhang et al. introduced a fusion strategy related to combining convolutional sparse representation and multiscale transformation [31]. Zhu et al. introduced a multimodality decompositions approach related to NSCT that uses local Laplacian energy and phase consistency to combine the low-pass and high-pass subbands [10]. To improve fusion performance, Lepcha et al. [32] introduced a technique based on a cross-bilateral filter (CBF) with a rolling guidance filter that combines with weight normalization to enhance medical images. Dogra et al. [33] developed a method for minimizing distortions or abnormalities in bones and vasculature or arterial image fusion investigations. Goyal et al. [34] recently developed an approach that integrates poor-quality images, maintains less complexity for increasing target detection consistency, and offers a foundation for medical applications. In the NSST domain, Yin et al. incorporated a multimodality fusion of images algorithm by including the use of a pulse-coupled neural network (PCCN) [35] for fusing images. Lei et al. developed a new multisensory fusion architecture relating to PCNN and NSST to enhance the image fusion efficiency of multimodal images [36]. A learning-based approach has been widely utilized in fusion strategy in recent times. The most widely used fusion approaches are sparse representation (SR) and deep learning-related fusion methods [37]. The sparse representation-related fusion strategy utilized typical sparse coding modality related to a single image element and local image block in the early stages. The input image is segmented into overlapping image blocks in the initial spatial domain for sparse coding approaches. Most of the current sparse coding-related image fusion approaches try to boost their efficiency in the following ways: by adding detailed constraints, creating a highly effective dictionary learning technique, and representing multiple sub-dictionaries [38].
Kim et al. introduced a dictionary learning approach using the SR-based model based on joint image block clustering. Zhu et al. developed a fusion of medical images recently [39]. However, all of the methods mentioned above involved complicated fusion rules or several sparse representation-based modalities. These particular rules, however, do not generalize to every form of medical image fusion. Deep-learning-related fusion has become a popular research topic with the fast advancement of artificial intelligence [40,41]. In recent years, deep learning has achieved significant success in various fields, including image recognition, natural language processing, speech recognition, and recommendation systems. Some of the popular deep learning architectures include convolutional neural networks (CNNs), recurrent neural networks (RNNs), and deep belief networks (DBNs). The CNN-based local connection with weight-sharing characteristics will increase the efficiency of the fusion technique by simultaneously reducing network complexity and weights. At the moment, CNNs are becoming more and more strategic in their fusion strategies. Xia et al. combined a multiscale transform and CNN to develop a multimodal medical image fusion modality that utilizes a deeper stacked neural network for dividing input images into low- and high-frequency elements and corresponding image fusion [42].
One of the major problems in current deep learning-based image fusion is computing the weight maps that fuse the pixel activity details from different sources. Most current fusion algorithms contain a two-step process that includes activity-level calculation and weight assignments. The absolute values of decomposition coefficients are employed to calculate its operation initially in conventional transform domain methods. The maximum or weighted average is then selected using a fusing rule, i.e., the choose-max or weighted-average rule. The corresponding weights are eventually assigned to various sources based on the obtained measurements. Different complex decomposition methods and detailed weight assignment methods have been introduced recently to improve fusion efficiency [43,44]. However, constructing an optimal activity-level calculation or weight assignment technique that takes into account all of the important factors is challenging. Jose et al. [28] introduced a novel multimodality algorithm for an NSST-related adolescent identity search (AISA) to achieve image optimization while reducing computational cost and time. Li et al. [45] introduced a fusion technique that helps with medical analysis and increases target recognition precision and fused image quality. NSCT and CNN are combined by Wang et al. [46]. They incorporated the benefits of both NSCT and CNN to boost fusion performance. A hybrid medical image fusion system combines LatLRR and FCNs by Xu et al. [47]. Liu et al. [48] designed an effective technique using a spectral total variation transform (STVT). A STVT algorithm is utilized for decomposing the input images into a set of texture signatures, which refers to the dependent components and deviation components.
This section illustrates the proposed multimodal fusion strategy using pixel significance with edge-preserving processing in detail. Fig. 1 represents a detailed framework for the proposed methodology. It can be observed from Fig. 1 that our fusion algorithm contains three crucial steps: cross-bilateral filtering, low-pass filter with morphological processing of residuals, and pixel-based fusion rule.
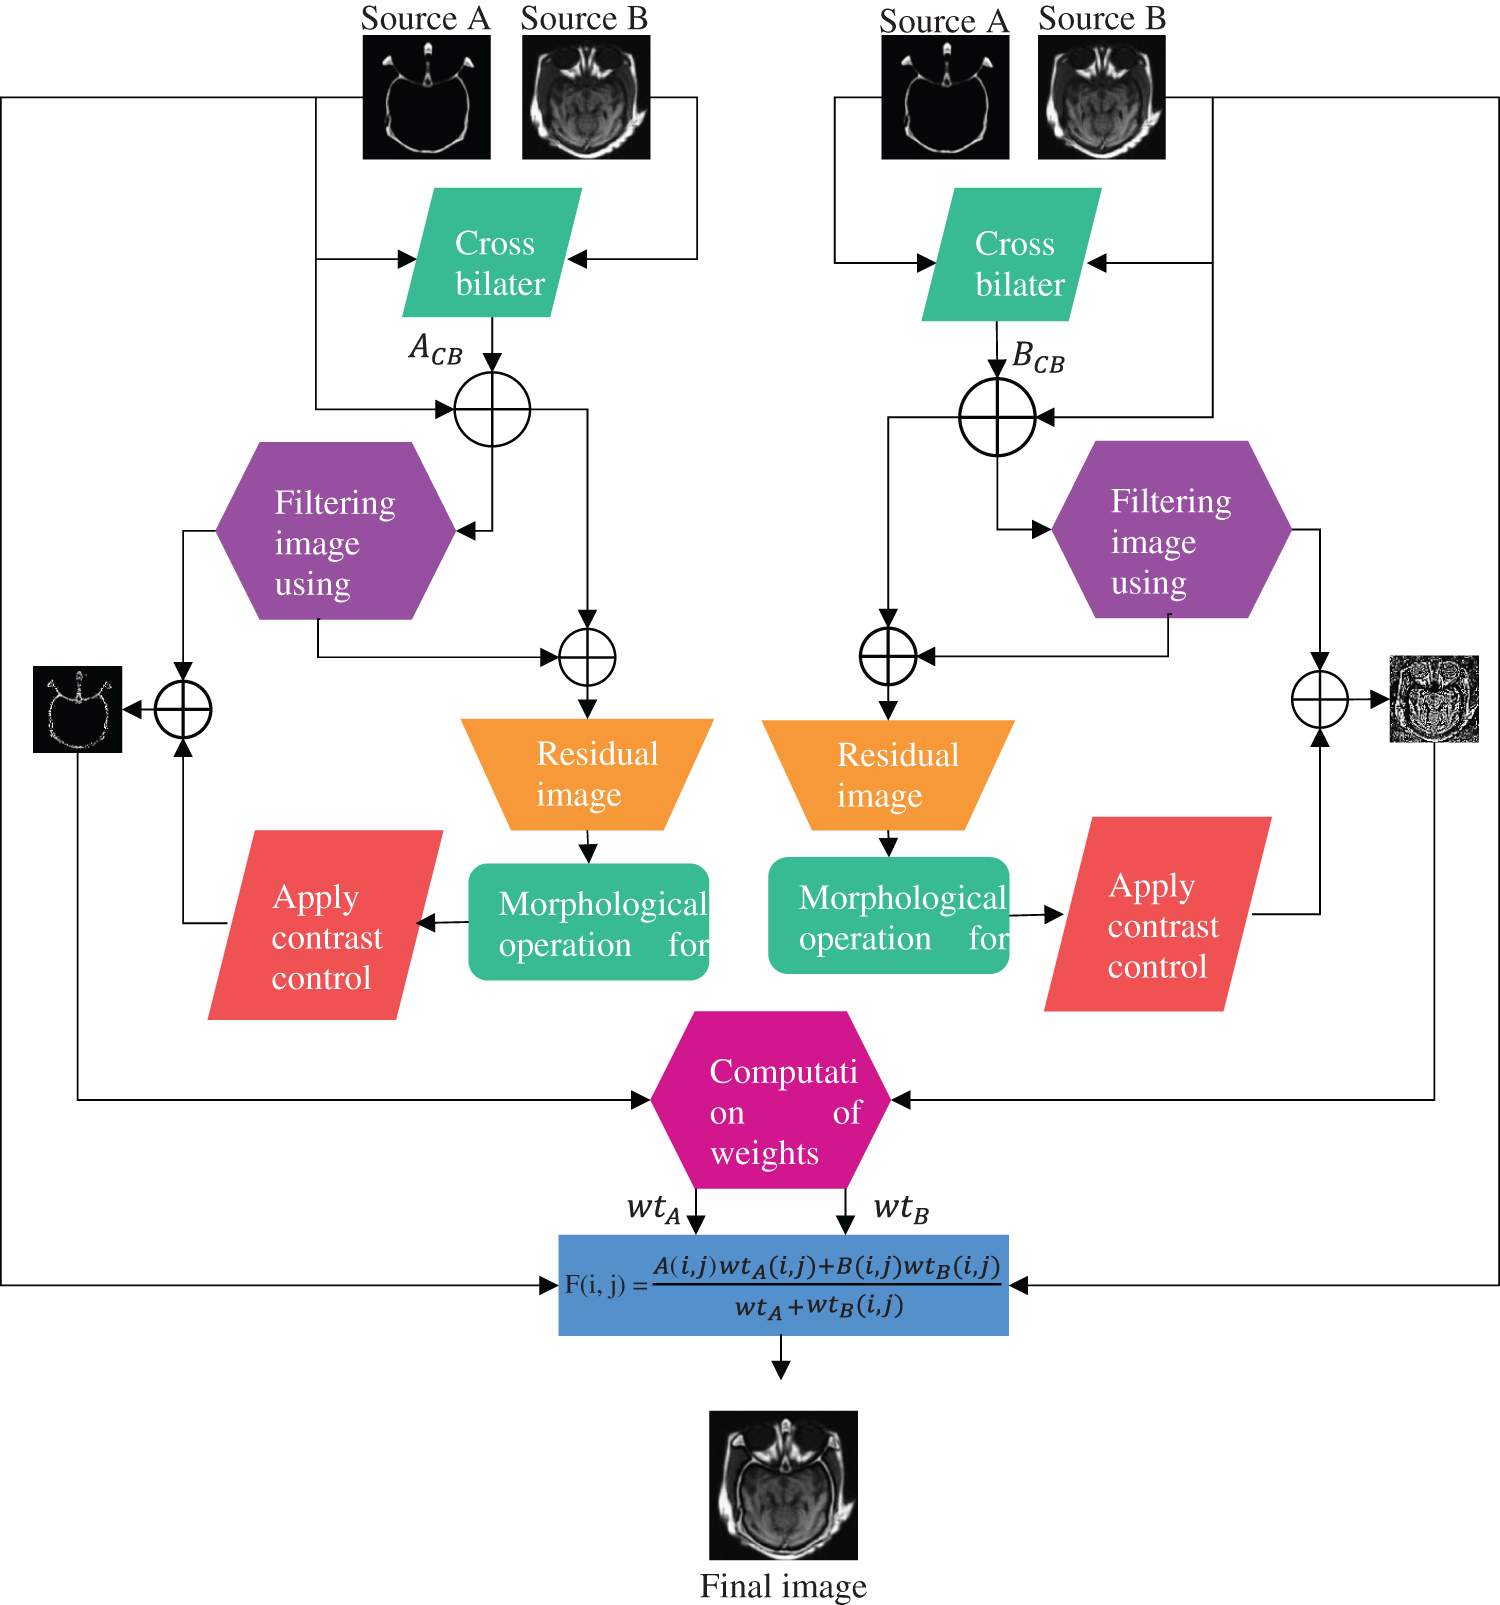
Figure 1: Methodological flowchart of the proposed algorithm
3.1 Cross-Bilateral Filter (CBF)
CBF [49] represents a nonlinear and non-iterative technique that integrates an edge stopping function and a lowpass filter, which minimizes the filter kernel if the magnitude variation between pixels is greater. Both levels of gray similarity and the geometric closeness of the surrounding pixels are taken into consideration. The weight of filters does not only depend on the Euclidean distance but also depends on the distance of color or gray space. The process benefits as it smooths the edges by conserving the edges while considering neighborhood pixels.
Mathematically, in the case of source image A, the output of the bilateral filter (BF) at position
where
where ||p − q|| denotes a Euclidean distance between
Similarly, we can calculate
where
Similarly, we can compute
3.2 Edge-Preserving Processing
This section illustrates edge-preserving processing that is based on lowpass filtering with morphological processing of its residuals (LPMPR) [53]. It is mainly based on residual Gaussian filtering and is expressed as
where * is a convolutional operator and
The residual is then put through another processing step utilizing functions that are described using positive value images. In that case, the contents, which
The residual fraction follows the related relationship described below:
Similarly, we can obtain a residual image of detailed image B using similar procedures.
Both fractions of the residual (
A function
when
where
3.2.1 Size Criteria for Selection of Meaningful Regains
According to the initial implementation of this strategy, the edges of relevant areas are present in the binary mask that is extracted via thresholding. Using the amplitude residual, meaningfulness is calculated. So far, amplitude is not the only factor that affects how significant an image component is. It is easy to envision an image component with a greater residual amplitude specification that has no impact on how the image should be perceived. For instance, the addition of salt and pepper to the image would result in the generation of several smaller image components with larger amplitudes and the addition of high-amplitude components, which would alter the original image. Subsequently, they could be detected as relevant parts that are not optimal. Thus, another set is incorporated into the original approach to tackle this problem. The binary mask is filtered by the area opening filter [54]. The binary image is removed by this filter as are all related components with a size smaller than the given threshold
where
Subtraction (Addition ~ depending on the components) of high-pass filtering from the original image is one of the most well-known methods for improving contrast in images. It has to do with high pass filtering properties to distinguish local differences in the value of image pixels. An additional method to get high-pass filter results is to compare differences across low-pass filtering and the image itself. High-frequency components of images with amplitude areas exceeding threshold
By depending on
3.3 Pixel Significance-Based Fusion Rule
The fusion rule in [55] is presented to fulfill the completeness of our method. As demonstrated in [55], the weight is estimated employing the statistical characteristics of the neighborhood detailed components instead of wavelet components. The window dimension
where
where
After weight computation for all the detailed coefficients based on both assigned source images, the weighted average is employed for obtaining fusion results. Where wtA and wtB are the weights of the detailed coefficients obtained from the output of edge-preserving processing
The proposed algorithm validates competency using a variety of medical datasets. The proposed method reduces computational complexity and execution time while improving diagnostic computing accuracy. Our method exhibits a major boost in efficiency compared to other competing algorithms. It can be observed that the qualitative interpretation of all the fused images retrieved through the proposed algorithm has superior visual quality.
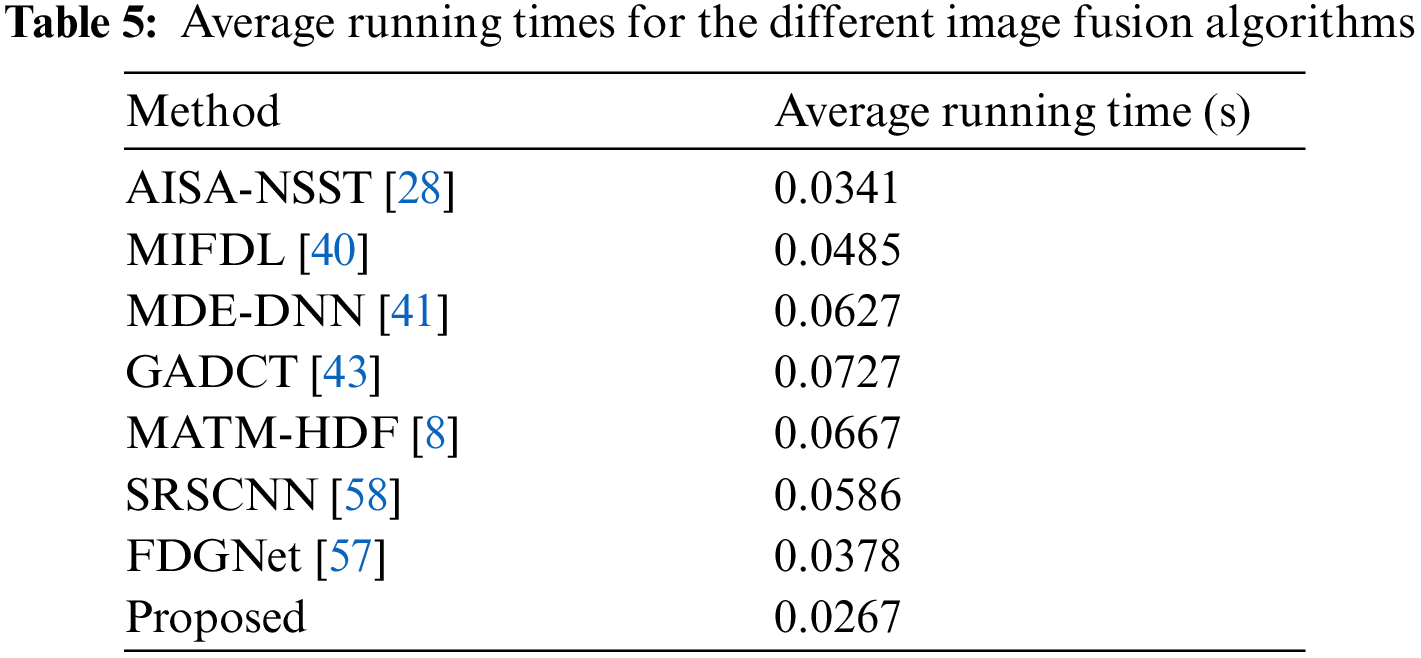
In this study, eight pairs of medical images are employed during the experiments to validate the practicability and feasibility of our algorithm. A total of eight pairs of CT-MRI images are demonstrated in Fig. 2. All these test datasets contain a spatial resolution of 256 × 256 pixels. Further, seven existing comparative methods are utilized for comparison to assess the robustness of our approach, including the adolescent identity search algorithm in the NSST domain (AISA-NSST) [28], the medical image fusion method by deep learning (MIFDL) [40], multi-objective differential evolution based deep neural networks (MDE-DNN [41], geometric algebra discrete cosine metrics (GADCT) [43], medical assistive technology management based on hybrid domain filtering (MATM-HDF) [8], FDGNet [57] and sparse representation and Siamese convolutional neural network (SRSCNN [58]. All the experiments are performed on a PC with an Intel (R) Core (TM) i3-7020 CPU @ 2.3 GHz and 8 GB of RAM using MATLAB 2022a. Following [49], the parameter values are fixed at
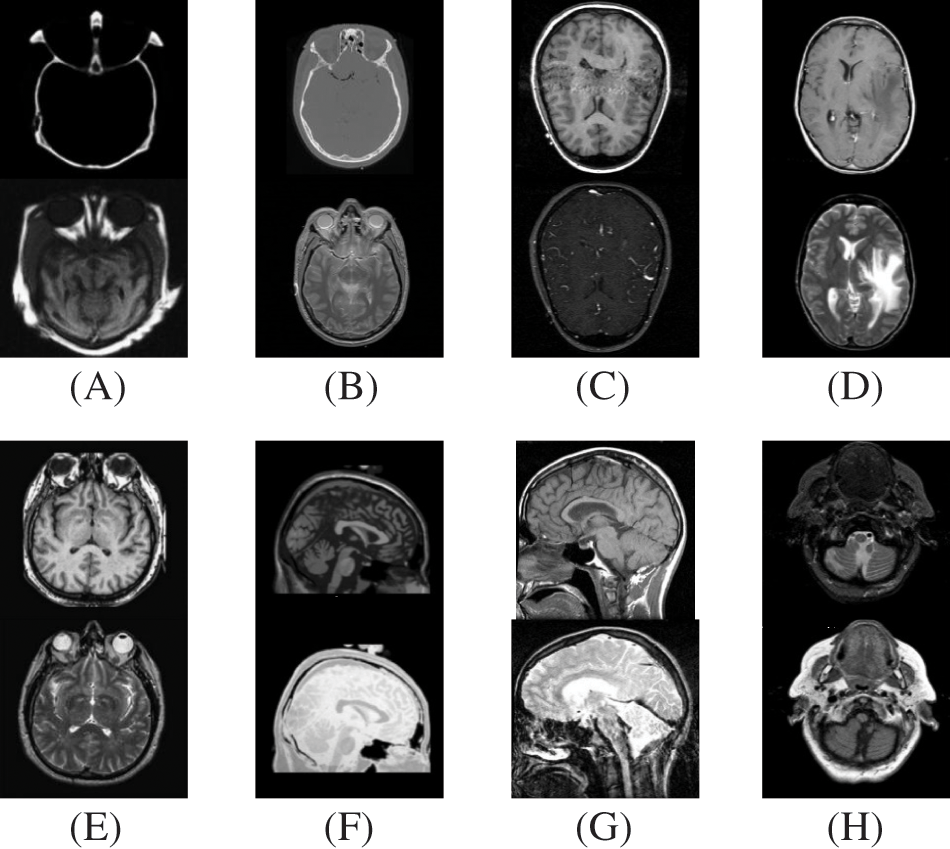
Figure 2: Source paired images (A–H): CT-MRI image pairs. Top
4.1 Objective Evaluation Metrics
This study employs twelve quality evaluation metrics for quantitative assessment to determine the validity of our method, namely spatial frequency (SF), average pixel intensity (API), or mean (
1) The standard deviation represents the variance square root and is defined as the spread of information. It is expressed as
2) The average gradient computes the degree of clarity and sharpness. It is expressed as
3) Mutual information computes the total mutual information between a source and the fused image. It is denoted by
where
4) Entropy (H) is the information quantity present in the image.
where
5) Spatial frequency computes the total information present in image regions and is denoted as
where
and
6) Average pixel intensity (APF) represents the contrast index and is denoted as
where
7) The correlation coefficient estimates the relevance of representing fusion output to the original image. It is defined by
8) Fusion symmetry represents the amount of symmetry where the fused image corresponds to the input image. It is denoted as
9)
10)
11)
In particular,
In particular, for most of the situations, it has been noticed that the above summation may not lead to unity. For this purpose, the technique has been modified, and a revision has been advised for performance parameters for fusion artifacts [49]. The revised computation is denoted by
where
With the revision of fusion artifacts measure NmAB/F, we could re-write Eq. (28) as
4.2 Qualitative and Quantitative Analysis
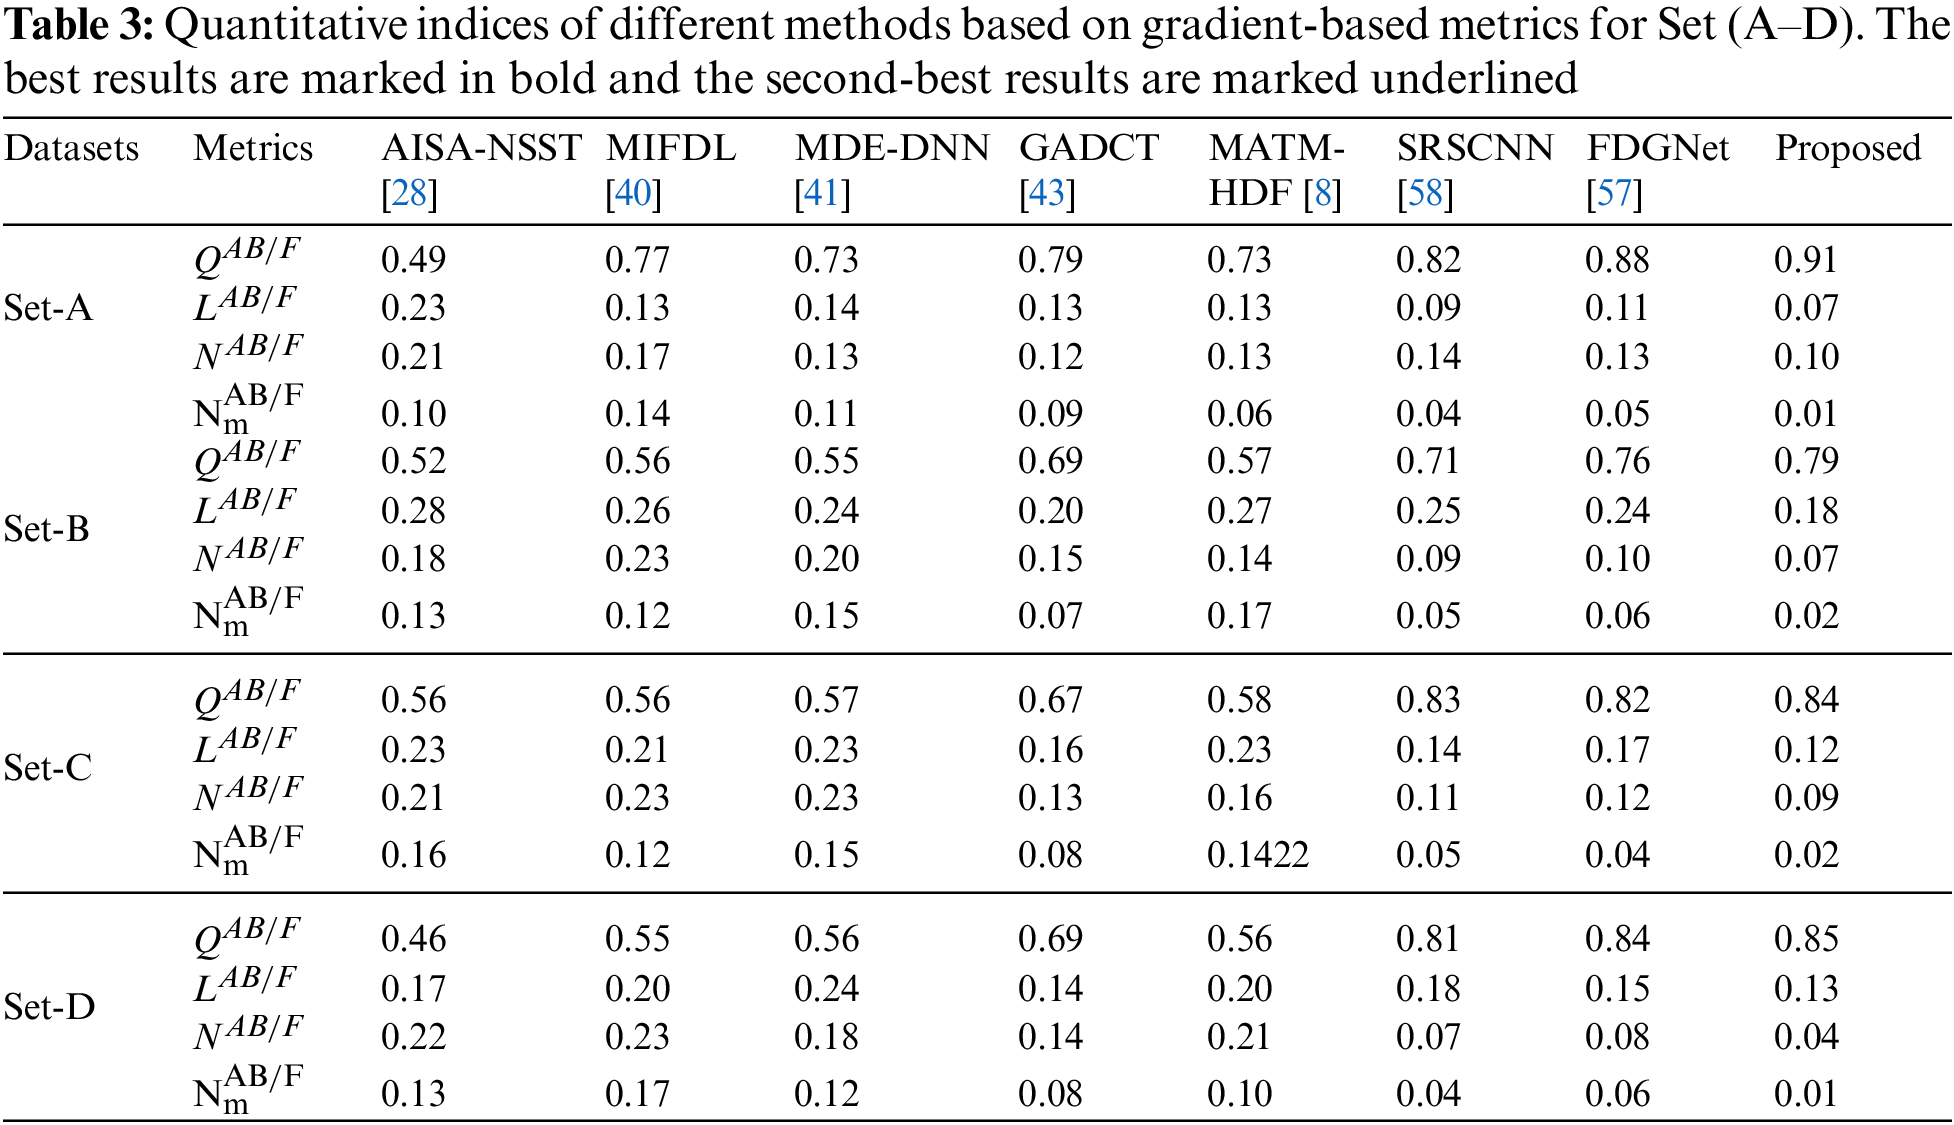
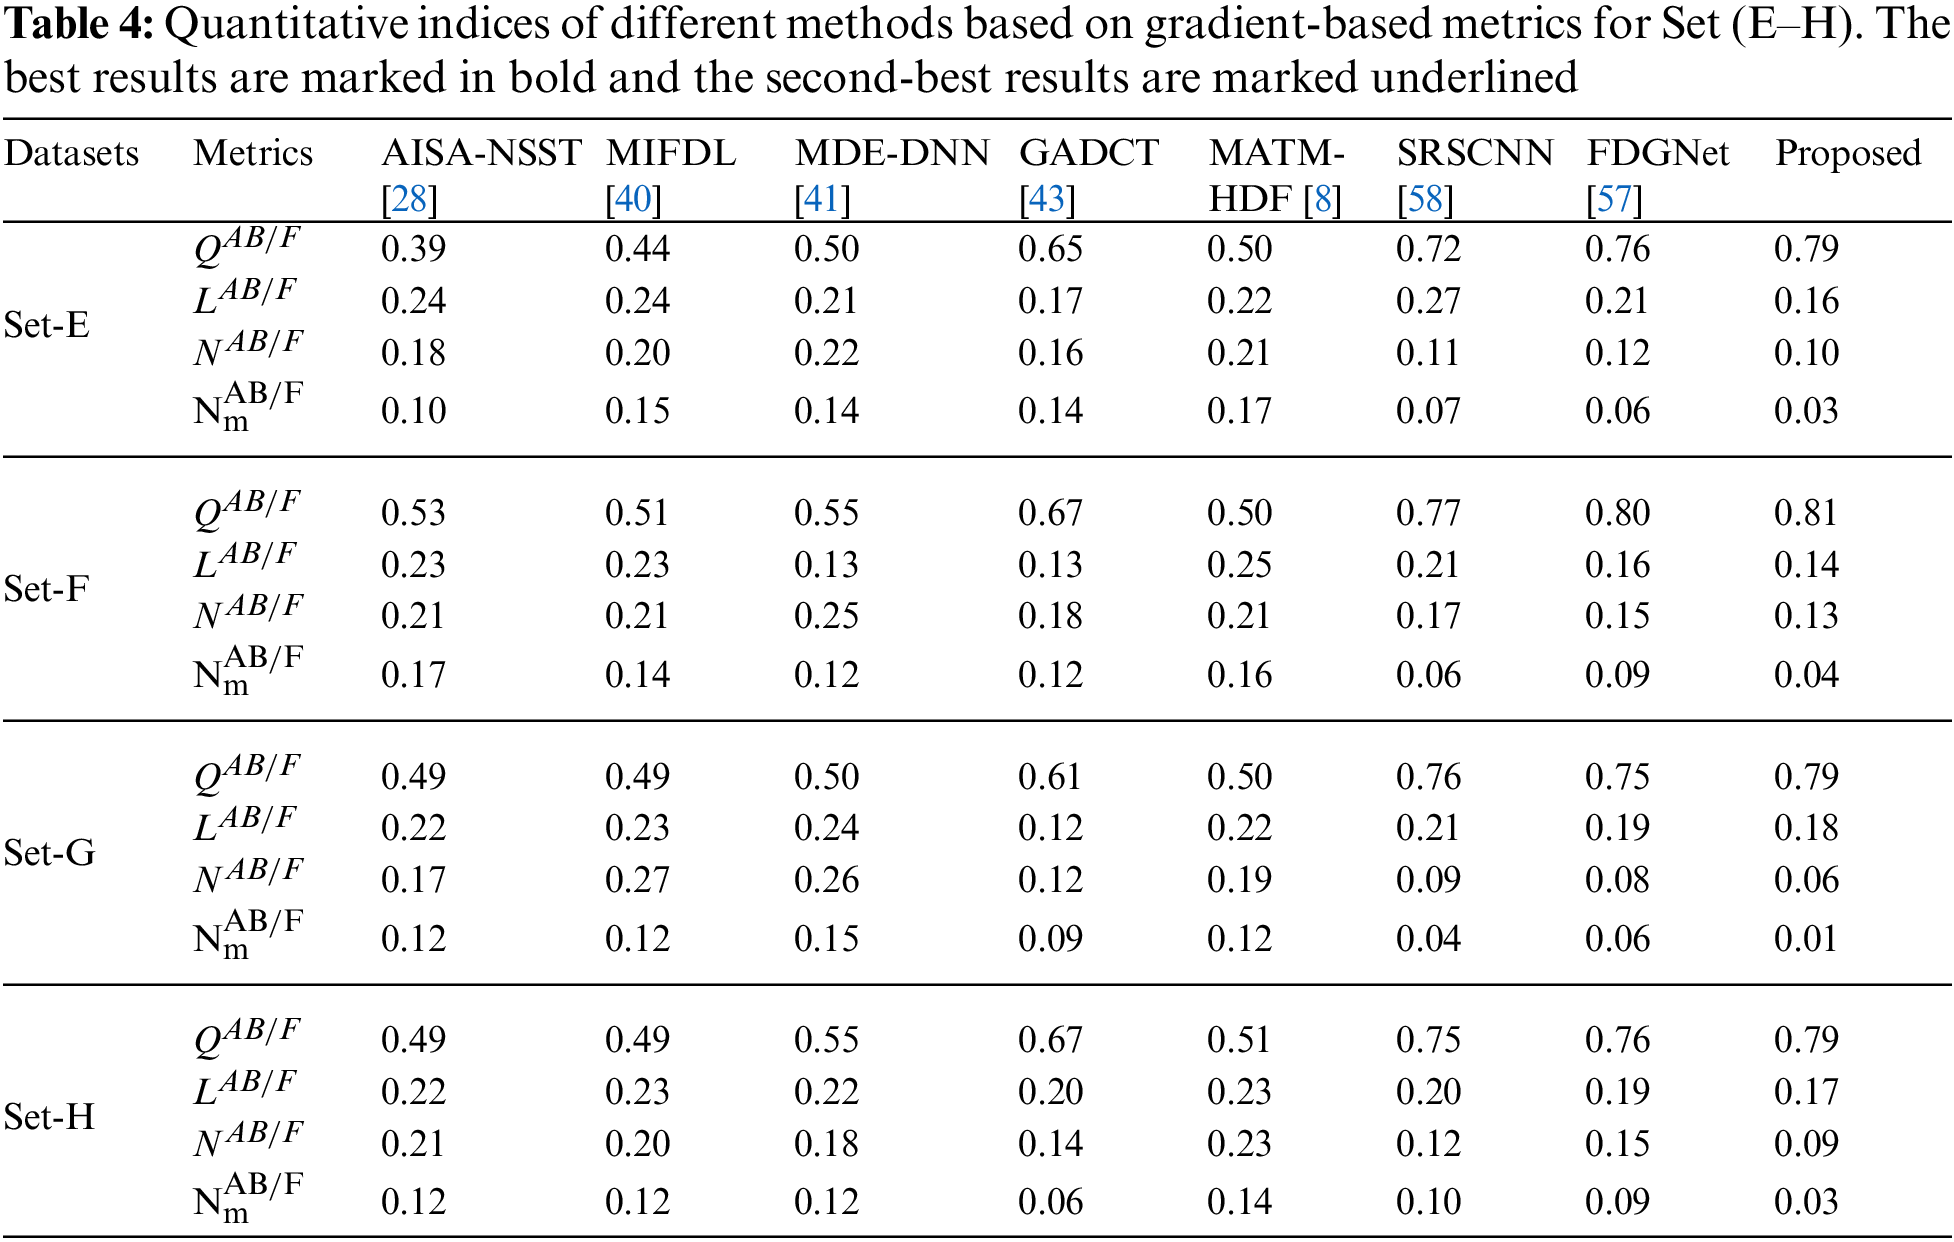
To investigate the efficiency of our proposed strategy, this study utilizes eight pairs of publicly accessible images from the Whole Brain Atlas [60]. The eight pairs of medical images in Figs. 2A–2H are represented by Set A to Set H, respectively. Statistical numeric indicators to validate the objective fusion performance is considered, including MI, H, API, CC, AG, API, SF, and SD. Further, in addition to the above metrics, an objective fusion characterization based on gradient details is also considered including
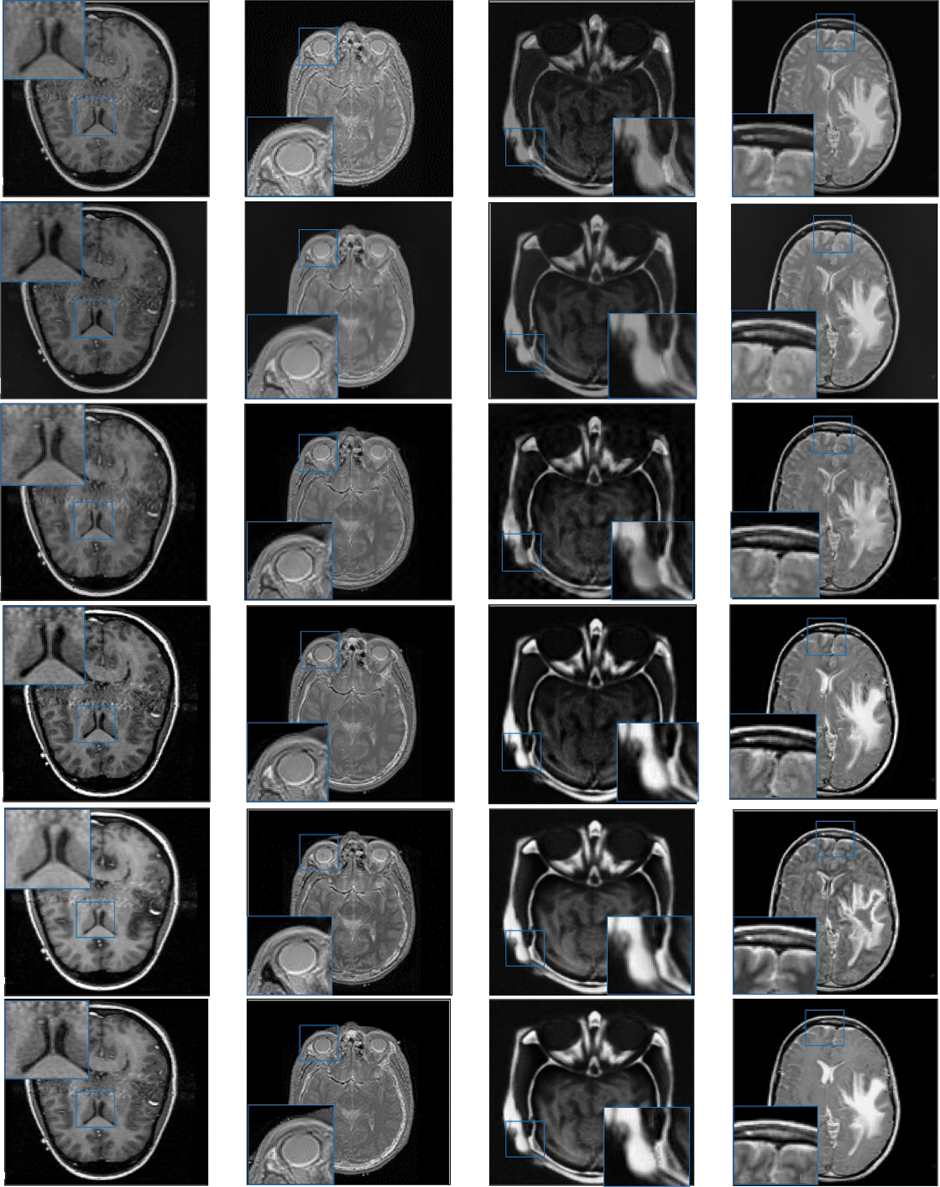
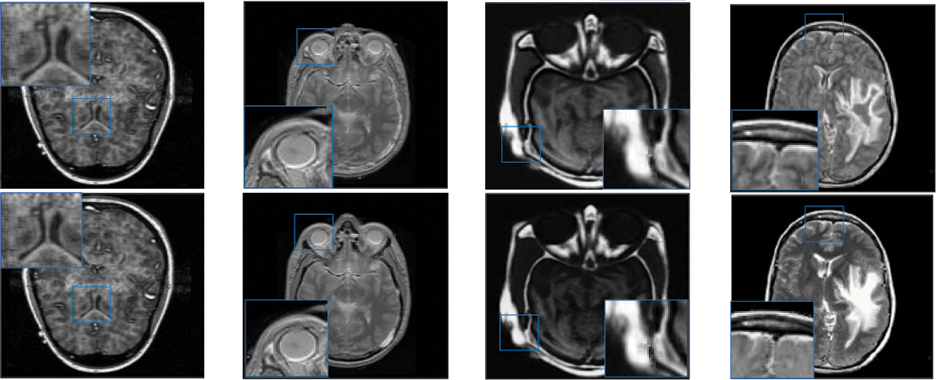
Figure 3: Qualitative results of CT-MRI image pairs on Set (A–D). From top to bottom: results by AISA-NSST, MIFDL, MDE-DNN, GADCT, MATM-HDF, SRSCNN, FDGNet and proposed algorithm
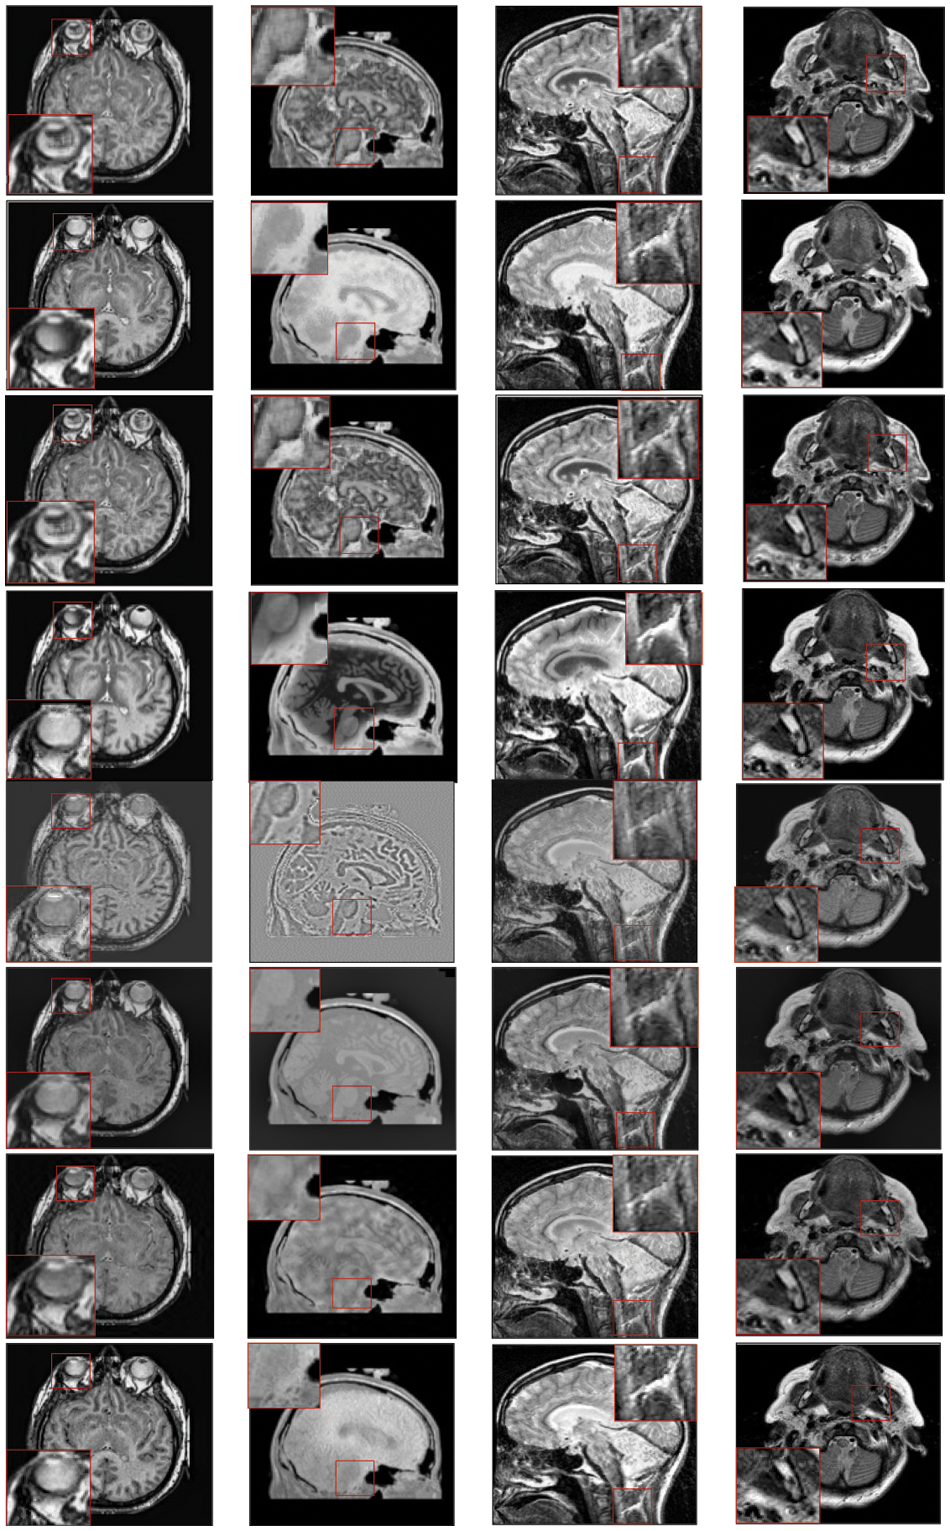
Figure 4: Qualitative results of CT-MRI image pairs on Set (E–F). From top to bottom: results by AISA-NSST, MIFDL, MDE-DNN, GADCT, MATM-HDF, SRSCNN, FDGNet and proposed algorithm
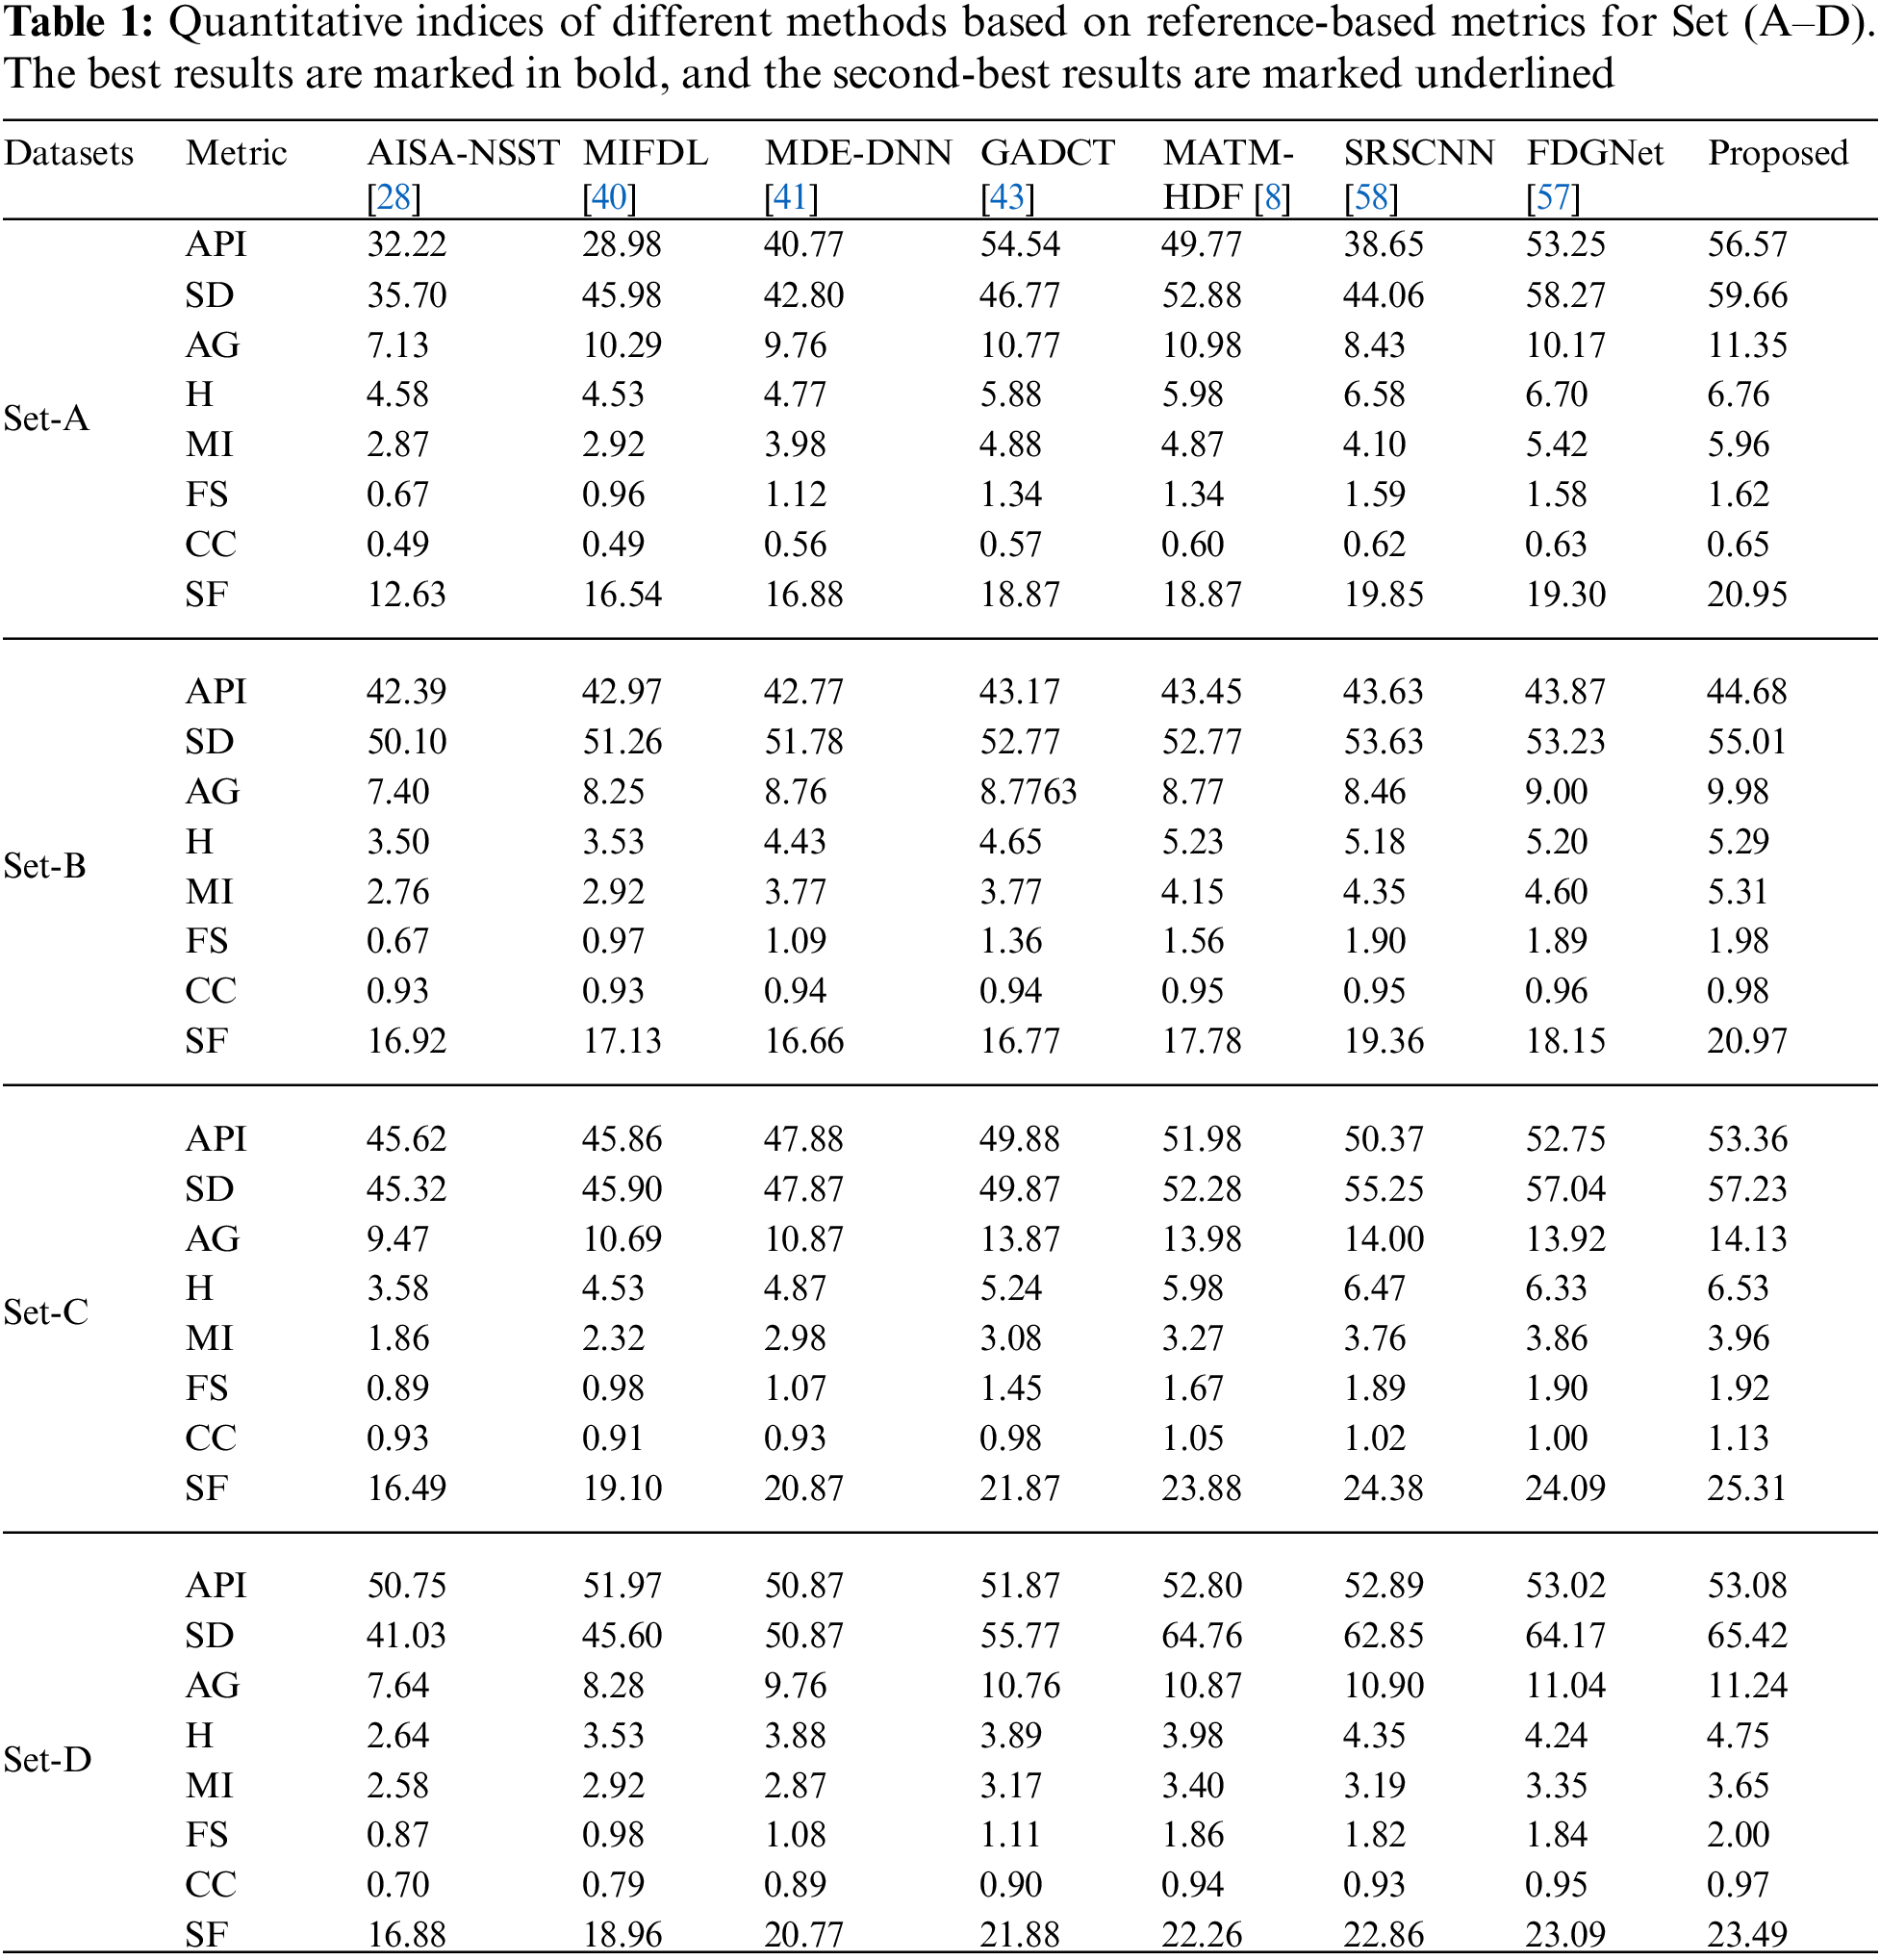
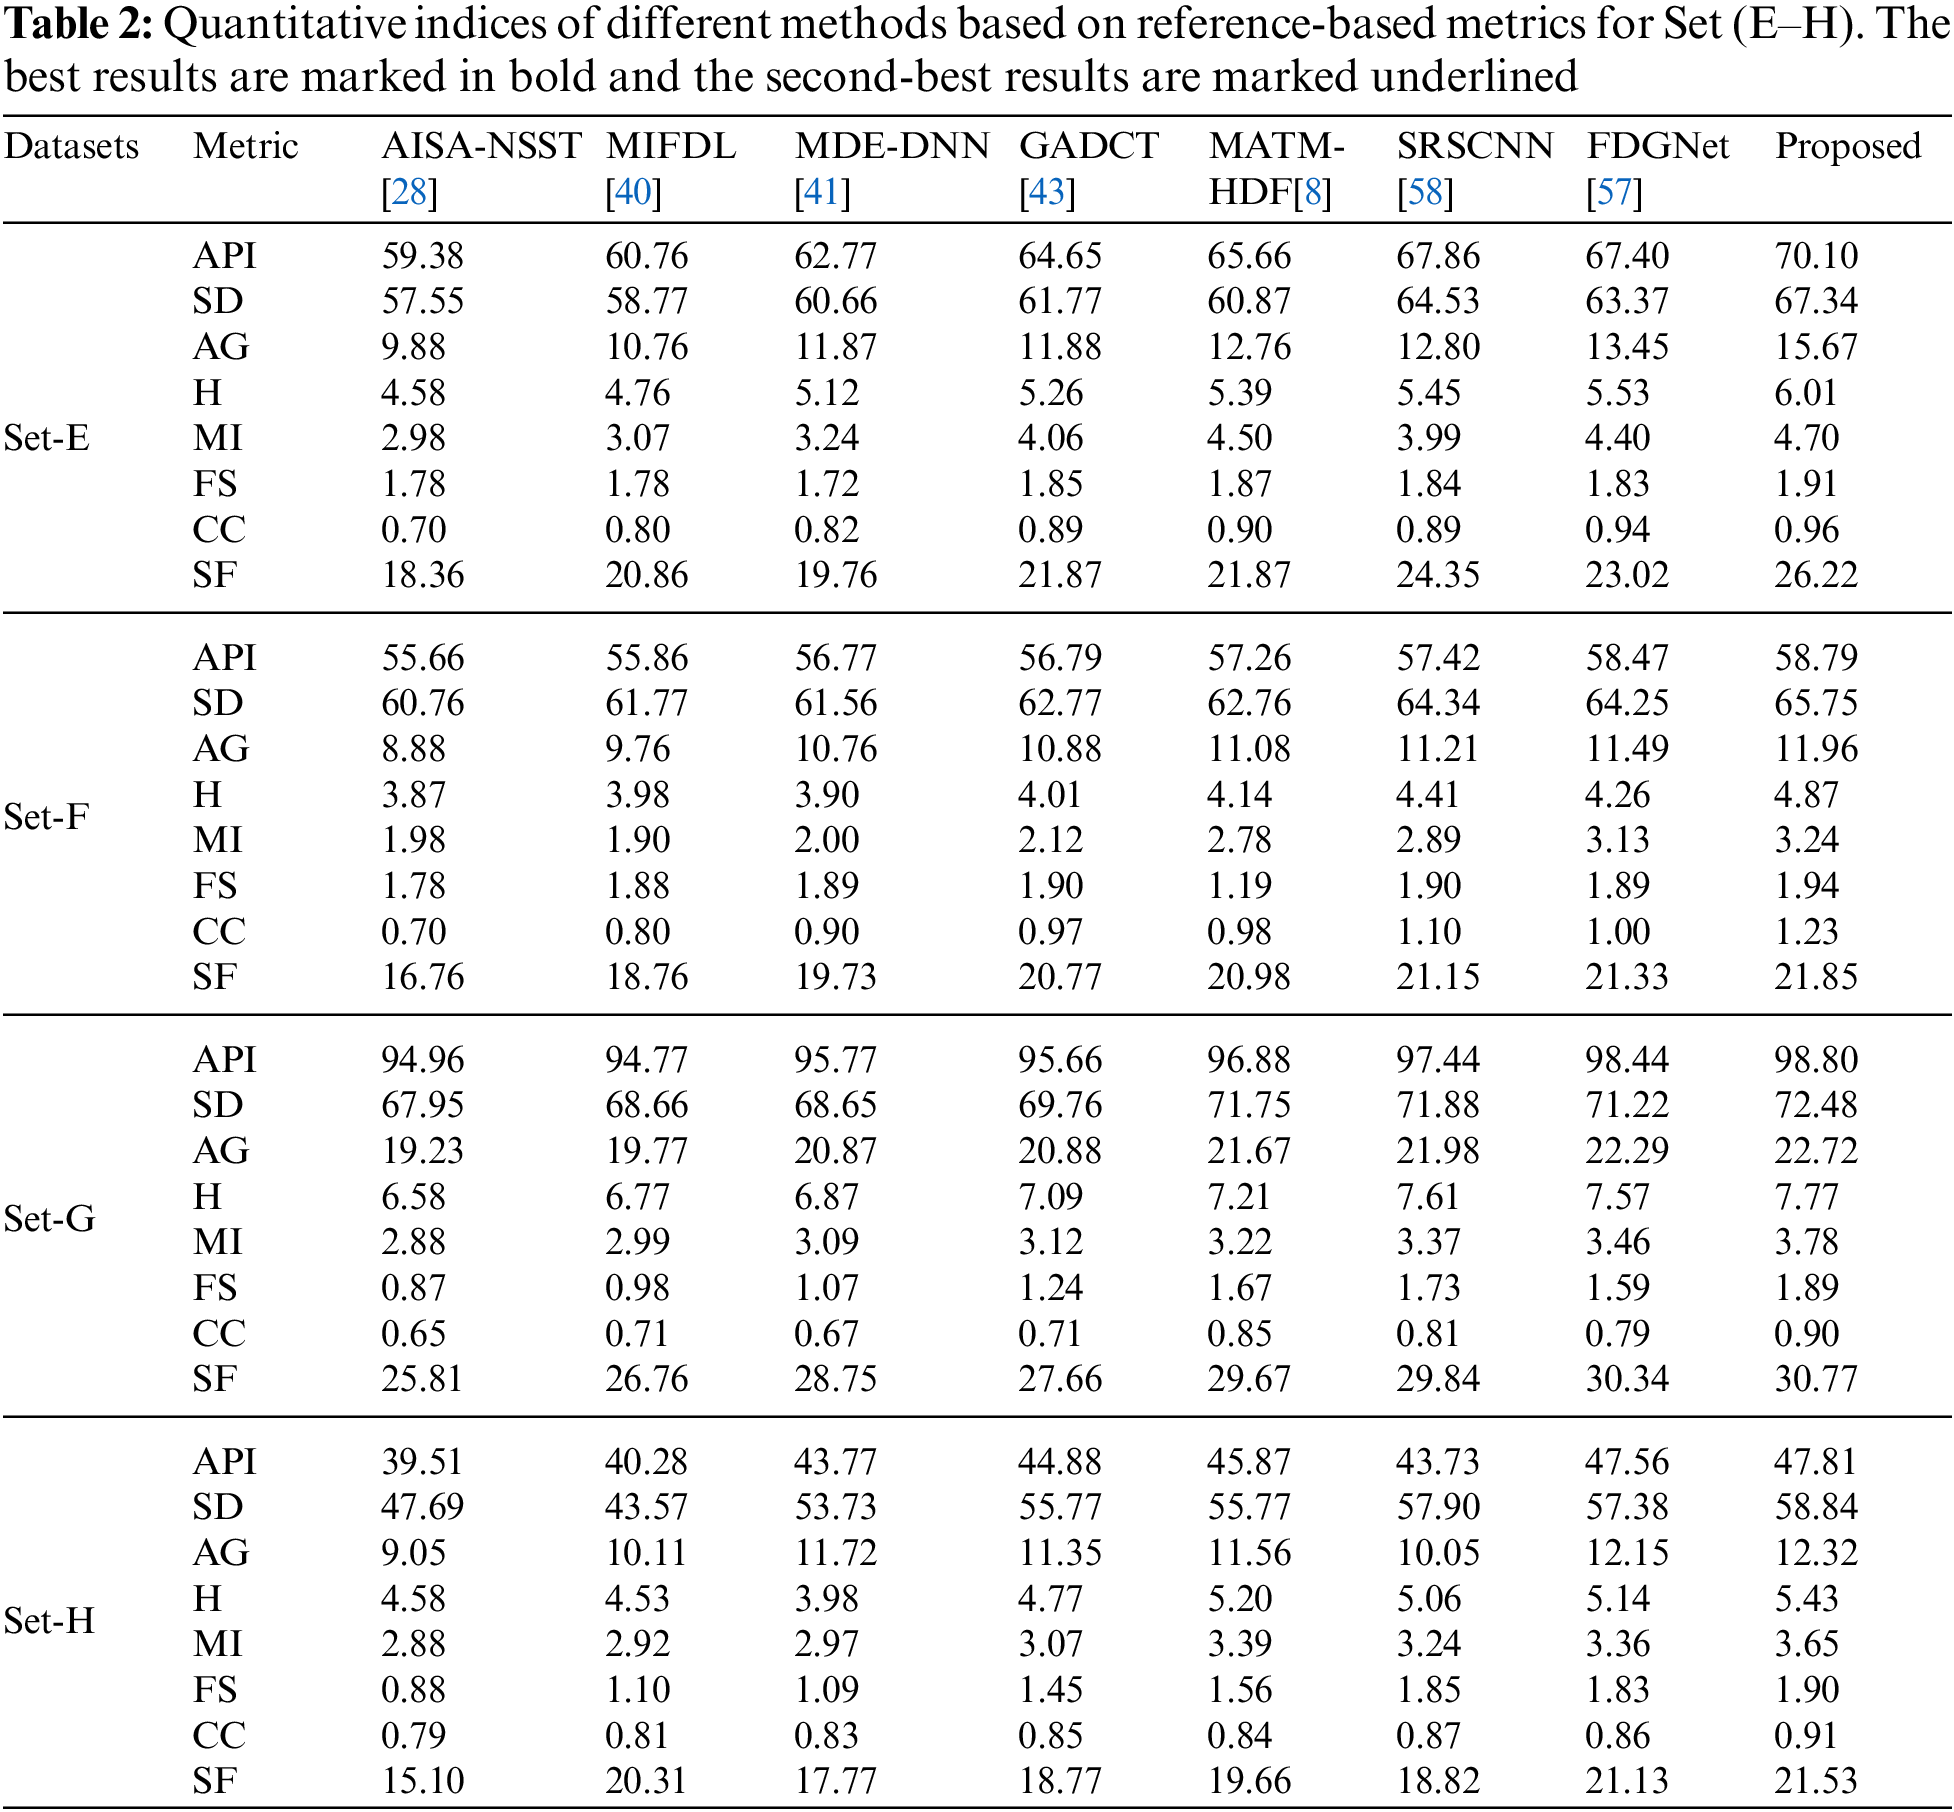
As per the experimental results, the outputs retrieved via the proposed method are very efficient and effective in the case of all quantitative parameters, whereas other algorithms yielded suboptimal values. Tables 1 and 2 show that our technique ranks first in simulation results for all dataset pairs when compared to other competing techniques. Even if a few parameters are higher with smaller margins than other methodologies, the differences in other parameters are higher. Further, the average result of these quantitative measures are shown in Tables 1 and 2 to provide a more intuitive grasp of quantitative evaluations in comparison to existing methodologies. In summary, the fusion results of the proposed algorithm outperform the existing seven comparative approaches in all aspects. Tables 1 and 2 exhibit indices incusing H, AG, SF, API, MI, SD, CC, and FS. At higher values of the above-mentioned metrics, the efficiency of the fused image is appropriate. Similarly, in addition to objective analysis, visual interpretation is more significant. Figs. 3 and 4 show the corresponding fused images to illustrate the performance visually. The proposed algorithm exhibits superior visual interpretation when compared to other methods. It also facilitates the process of testing other algorithms, which have comparably low experimental results. For the assessment of performance and to show the efficiency of our method, it observed that the effects of change in input for k,
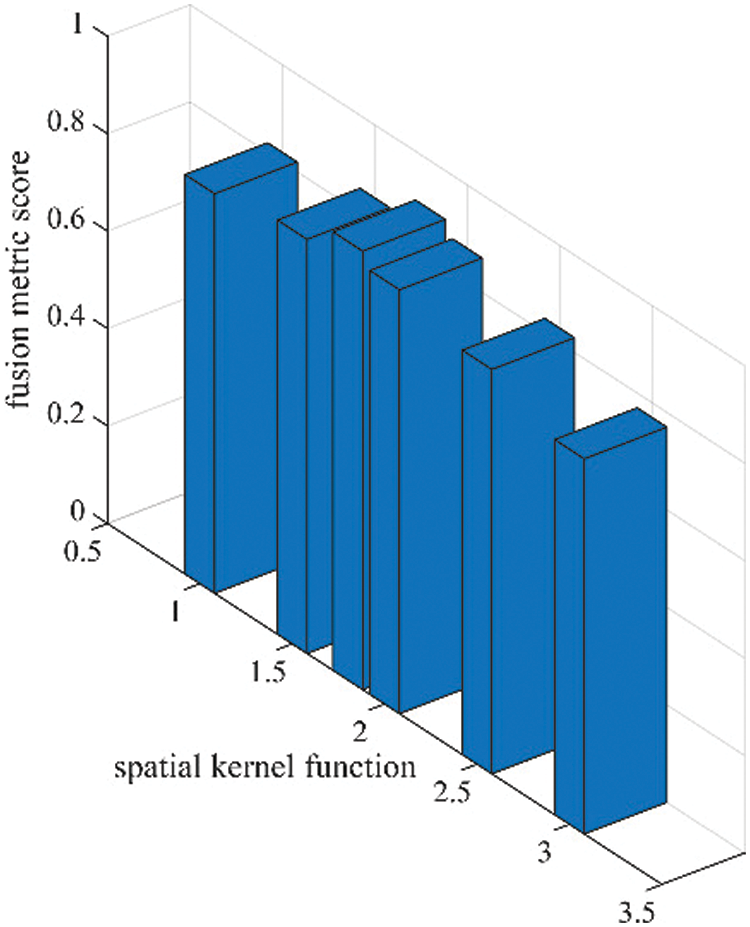
Figure 5: Sensitivity analysis of spatial kernel function
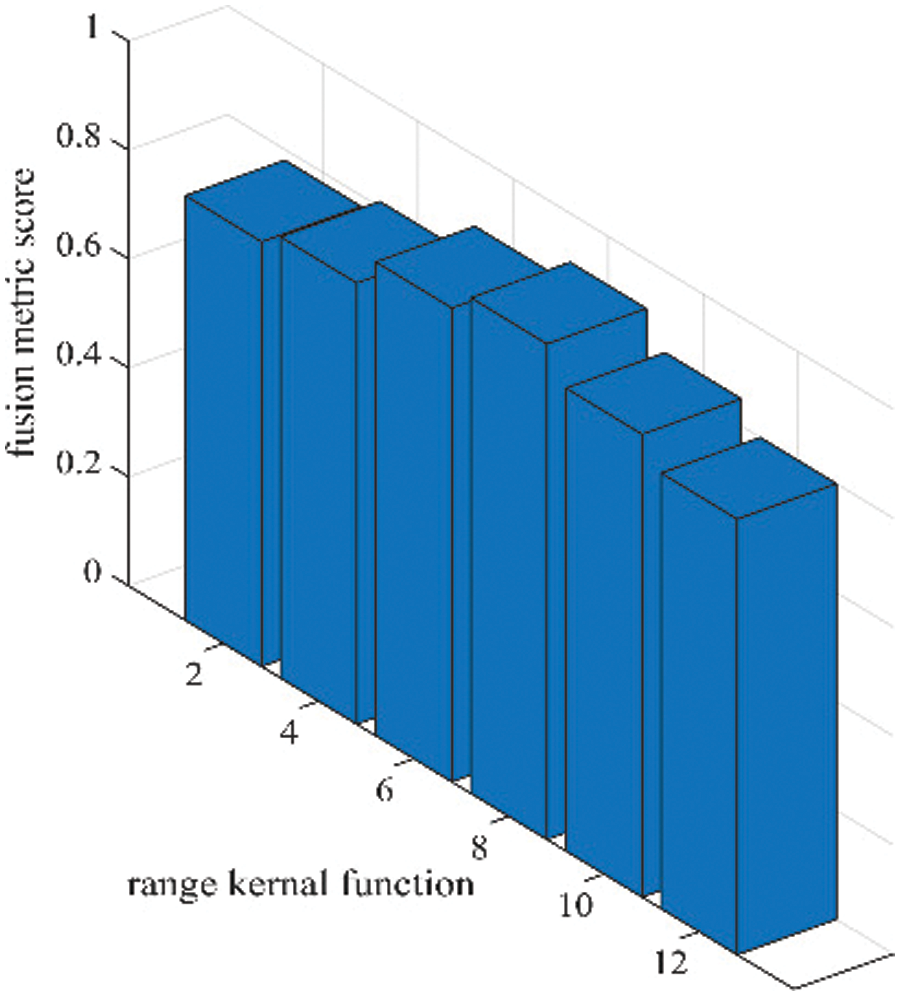
Figure 6: Sensitivity analysis of range kernel function (
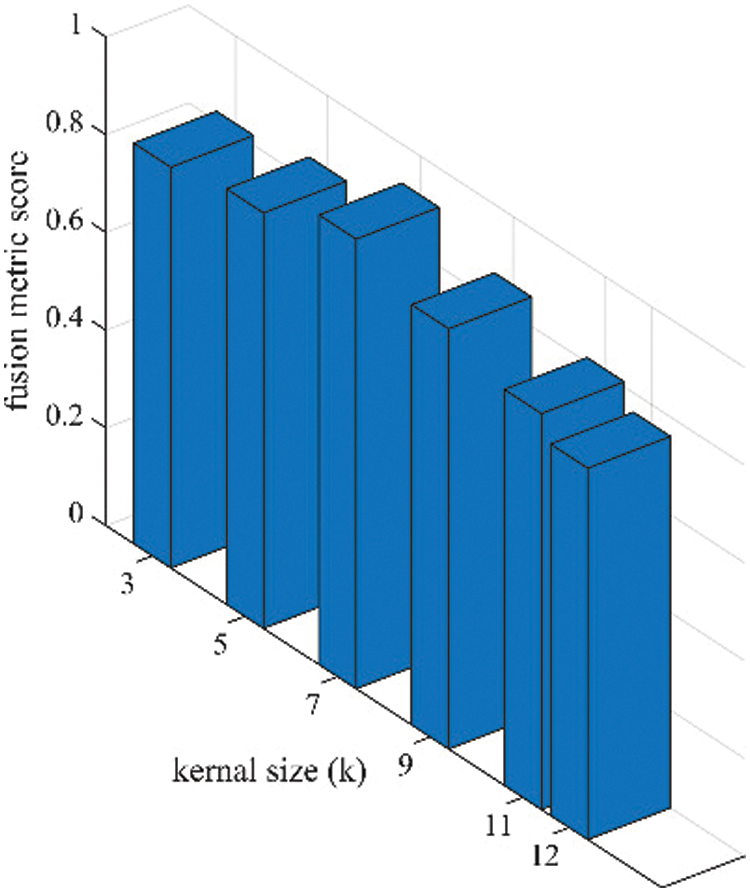
Figure 7: Sensitivity analysis of kernel size (k) in terms of fusion performance on the proposed algorithm
In addition to the above eight performance metrics, the results of four fusion performance metrics based on gradient details have been discussed in this section [39]. These metrics provide a detailed evaluation of fusion results by evaluating overall details transferred from source images to fusion result
Tables 3 and 4 show that our algorithm nearly always gets ideal values on all objective measures as compared to other competing algorithms that intuitively adapt to quality judgments. In summary, the fusion performance of our strategy surpasses all other algorithms in both qualitative interpretation and quantitative assessment. The overall performance measures of evaluation metrics are tabulated in Tables 1 and 2 where the fusion performances of our algorithm are superior with ideal scores in all these eight-objective metrics. The principal aim of image fusion is to produce an output that is highly suitable for human visualization with adequate, comprehensive, and detailed features in the fusion results. Further, visual interpretation is quite important, along with objective performance. The fusion results are demonstrated in Figs. 3 and 4 which interpret performance visually. The proposed approach has demonstrated superior visualization when compared to other comparable methods. The information transfer rate in the proposed technique is the highest when compared to other algorithms. according to the quantitative assessment in the case of gradient-based measures. In addition, the suggested method has a high
This study presents a competent medical image fusion strategy based on pixel significance with edge-preserving processing. First, the proposed method obtains detailed images obtained from the source images after subtracting the outputs of the cross-bilateral filters. These detailed images are then used for edge-preserving processing that combines a linear low-pass filter with the non-linear technique, which allows the selection of meaningful regions while preserving edges. The relevant restored regions are fused with the result of low-pass filtering for the reconstruction of the original shape of the edges. These images are then used for weight computations. These weights are calculated by estimating the strength of vertical and horizontal details and are directly merged with source images to retrieve the final fusion result. The proposed algorithm validates competency by utilizing eight sets of CT-MRI medical images. The proposed approach decreases computational complexity and execution time while improving diagnostic computing accuracy. Our method exhibits a major boost in efficiency compared to other competing algorithms. It can be observed that the qualitative interpretation of all the fused images retrieved through the proposed algorithm has superior visual quality. The key limitation of the proposed method is that it is not highly appropriate for fused, sophisticated multimodality images. The proposed method could be augmented by using other different types of filters that have been left for future research. Further, image fusion and the importance of this technique have huge prospects for improvement by proposing several image fusion algorithms to reduce noise and artifacts. In addition, it is quite realistic to boost the superiority of medical images by further improving the proposed algorithm in the future.
Acknowledgement: We are thankful to the reviewers and editors for their valuable suggestions. We appreciate their insightful comments, which helped us improve the manuscript significantly.
Funding Statement: No funding was received to assist with the preparation of this manuscript.
Author Contributions: Bhawna Goyal: Methodology, Data curation, Writing–original draft and Formal analysis. Ayush Dogra: Supervision, Writing–original draft and Formal analysis, Validation. Dawa Chyophel Lepcha: Software, Investigation, Writing–review and editing. Rajesh Singh: Investigation and Resources. Hemant Sharma: Formal analysis and Resources. Ahmed Alkhayyat: Formal analysis and editing. Manob Jyoti Saikia: Formal analysis and Validation.
Availability of Data and Materials: The dataset used in the manuscript can be accessed from https://www.med.harvard.edu/aanlib/home.html.
Conflicts of Interest: The authors declare that they have no known competing financial interests or personal relationships that could have appeared to influence the work reported in this paper.
References
1. S. Karim, G. Tong, J. Li, A. Qadir, U. Farooq and Y. Yu, “Current advances and future perspectives of image fusion: A comprehensive review,” Inform. Fusion, vol. 90, pp. 185–217, Feb. 2023. doi: https://doi.org/10.1016/j.inffus.2022.09.019. [Google Scholar] [CrossRef]
2. M. Haribabu, V. Guruviah, and P. Yogarajah, “Recent advancements in multimodal medical image fusion techniques for better diagnosis: An overview,” Curr. Med. Imaging Rev., vol. 19, no. 7, pp. 3, Jun. 2022. doi: https://doi.org/10.2174/1573405618666220606161137. [Google Scholar] [PubMed] [CrossRef]
3. C. Kaushal, S. Bhat, D. Koundal, and A. Singla, “Recent trends in computer assisted diagnosis (CAD) system for breast cancer diagnosis using histopathological images,” IRBM, vol. 40, no. 4, pp. 211–227, Aug. 2019. doi: https://doi.org/10.1016/j.irbm.2019.06.001. [Google Scholar] [CrossRef]
4. P. K. Shukla, J. K. Sandhu, A. Ahirwar, D. Ghai, P. Maheshwary and P. K. Shukla, “Multiobjective genetic algorithm and convolutional neural network based COVID-19 identification in chest X-ray images,” Math. Probl. Eng., vol. 2021, pp. 1–9, 2021. doi: https://doi.org/10.1155/2021/7804540. [Google Scholar] [CrossRef]
5. D. C. Lepcha et al., “Multimodal medical image fusion based on pixel significance using anisotropic diffusion and cross bilateral filter,” Hum.-Centric Comput. Inform. Sci., vol. 12, pp. 15, 2022. doi: https://doi.org/10.22967/HCIS.2022.12.015. [Google Scholar] [CrossRef]
6. B. Goyal, A. Dogra, R. Khoond, D. C. Lepcha, V. Goyal and S. L. Fernandes, “Medical image fusion based on anisotropic diffusion and non-subsampled contourlet transform,” Comput. Mater. Contin., vol. 76, no. 1, pp. 311–327, Jun. 2023. doi: https://doi.org/10.32604/cmc.2023.038398. [Google Scholar] [CrossRef]
7. J. Chen, L. Chen, and M. Shabaz, “Image fusion algorithm at pixel level based on edge detection,” J. Healthc. Eng., vol. 2021, no. 7, pp. 1–10, 2021. doi: https://doi.org/10.1155/2021/5760660. [Google Scholar] [PubMed] [CrossRef]
8. B. Goyal et al., “Multi-modality image fusion for medical assistive technology management based on hybrid domain filtering,” Expert Syst. Appl., vol. 209, no. 2, pp. 118283, Dec. 2022. doi: https://doi.org/10.1016/j.eswa.2022.118283. [Google Scholar] [CrossRef]
9. J. Chen, X. Li, L. Luo, X. Mei, and J. Ma, “Infrared and visible image fusion based on target-enhanced multiscale transform decomposition,” Inf. Sci., vol. 508, no. 4, pp. 64–78, Jan. 2020. doi: https://doi.org/10.1016/j.ins.2019.08.066. [Google Scholar] [CrossRef]
10. Z. Zhu, M. Zheng, G. Qi, D. Wang, and Y. Xiang, “A phase congruency and local laplacian energy based multi-modality medical image fusion method in NSCT domain,” IEEE Access, vol. 7, pp. 20811–20824, 2019. doi: https://doi.org/10.1109/ACCESS.2019.2898111. [Google Scholar] [CrossRef]
11. S. Maqsood and U. Javed, “Multi-modal medical image fusion based on two-scale image decomposition and sparse representation,” Biomed. Signal Process. Control, vol. 57, no. 2, pp. 101810, Mar. 2020. doi: https://doi.org/10.1016/J.BSPC.2019.101810. [Google Scholar] [CrossRef]
12. L. Jiao and J. Zhao, “A survey on the new generation of deep learning in image processing,” IEEE Access, vol. 7, pp. 172231–172263, 2019. doi: https://doi.org/10.1109/ACCESS.2019.2956508. [Google Scholar] [CrossRef]
13. A. Maier, C. Syben, T. Lasser, and C. Riess, “A gentle introduction to deep learning in medical image processing,” Z. Med. Phys., vol. 29, no. 2, pp. 86–101, May 2019. doi: https://doi.org/10.1016/J.ZEMEDI.2018.12.003. [Google Scholar] [PubMed] [CrossRef]
14. X. Y. Guo, J. Wang, and Z. J. Xu, “Multimodal medical image fusion based on average cross bilateral filtering,” in ACM Int. Conf. Proc. Ser., Dec. 2022, pp. 98–105. doi: https://doi.org/10.1145/3582197.3582213. [Google Scholar] [CrossRef]
15. Y. Zhang et al., “Medical image fusion based on quasi-cross bilateral filtering,” Biomed. Signal Process. Control, vol. 80, no. 9, pp. 104259, 2023. doi: https://doi.org/10.1016/J.BSPC.2022.104259. [Google Scholar] [CrossRef]
16. Y. Goodfellow et al., “Generative adversarial nets,” in Advances in Neural Information Processing Systems, vol. 27, 2014. [Google Scholar]
17. Y. Chen et al., “Generative adversarial networks in medical image augmentation: A review,” Comput. Biol. Med., vol. 144, no. 1, pp. 105382, May 2022. doi: https://doi.org/10.1016/J.COMPBIOMED.2022.105382. [Google Scholar] [PubMed] [CrossRef]
18. L. Wang, W. Chen, W. Yang, F. Bi, and F. R. Yu, “A state-of-the-art review on image synthesis with generative adversarial networks,” IEEE Access, vol. 8, pp. 63514–63537, 2020. doi: https://doi.org/10.1109/ACCESS.2020.2982224. [Google Scholar] [CrossRef]
19. K. He et al., “Transformers in medical image analysis,” Intell. Med., vol. 3, no. 1, pp. 59–78, Feb. 2023. doi: https://doi.org/10.1016/J.IMED.2022.07.002. [Google Scholar] [CrossRef]
20. G. Li, D. Xu, X. Cheng, L. Si, and C. Zheng, “SimViT: Exploring a simple vision transformer with sliding windows,” in IEEE Int. Conf. Multimed. Expo, vol. 2022, Jul. 2021, pp. 1–6. doi: https://doi.org/10.1109/ICME52920.2022.9859907. [Google Scholar] [CrossRef]
21. J. Zhang, A. Liu, D. Wang, Y. Liu, Z. J. Wang, and X. Chen, “Transformer-based end-to-end anatomical and functional image fusion,” IEEE Trans Instrum Meas, vol. 71, pp. 1–11, 2022. doi: https://doi.org/10.1109/TIM.2022.3200426. [Google Scholar] [CrossRef]
22. K. Yu, X. Yang, S. Jeon, and Q. Dou, “An end-to-end medical image fusion network based on Swin-transformer,” Microprocess. Microsyst., vol. 98, no. 3, pp. 104781, Apr. 2023. doi: https://doi.org/10.1016/j.micpro.2023.104781. [Google Scholar] [CrossRef]
23. W. Li, Y. Zhang, G. Wang, Y. Huang, and R. Li, “DFENet: A dual-branch feature enhanced network integrating transformers and convolutional feature learning for multimodal medical image fusion,” Biomed. Signal Process. Control, vol. 80, no. 1, pp. 104402, Feb. 2023. doi: https://doi.org/10.1016/j.bspc.2022.104402. [Google Scholar] [CrossRef]
H. Kaur, D. Koundal, and V. Kadyan, “Image fusion techniques: A survey,” Arch. Comput. Methods Eng., vol. 28, no. 7, pp. 4425–4447, Dec. 2021. doi: https://doi.org/10.1007/S11831-021-09540-7/FIGURES/7. [Google Scholar] [CrossRef]
25. N. Tawfik, H. A. Elnemr, M. Fakhr, M. I. Dessouky, and F. E. Abd El-Samie, “Survey study of multimodality medical image fusion methods,” Multimed. Tools Appl., vol. 80, no. 4, pp. 6369–6396, 2020. doi: https://doi.org/10.1007/s11042-020-08834-5. [Google Scholar] [CrossRef]
26. X. Han, J. Yu, J. H. Xue, and W. Sun, “Hyperspectral and multispectral image fusion using optimized twin dictionaries,” IEEE Trans. Image Process., vol. 29, pp. 4709–4720, 2020. doi: https://doi.org/10.1109/TIP.2020.2968773. [Google Scholar] [PubMed] [CrossRef]
27. G. Li, Y. Lin, and X. Qu, “An infrared and visible image fusion method based on multi-scale transformation and norm optimization,” Inform. Fusion, vol. 71, no. 2, pp. 109–129, Jul. 2021. doi: https://doi.org/10.1016/j.inffus.2021.02.008. [Google Scholar] [CrossRef]
28. J. Jose et al., “An image quality enhancement scheme employing adolescent identity search algorithm in the NSST domain for multimodal medical image fusion,” Biomed. Signal Process. Control, vol. 66, no. 1, pp. 102480, Apr. 2021. doi: https://doi.org/10.1016/j.bspc.2021.102480. [Google Scholar] [CrossRef]
29. Y. Liu, X. Chen, R. K. Ward, and Z. J. Wang, “Medical image fusion via convolutional sparsity based morphological component analysis,” IEEE Signal Process. Lett., vol. 26, no. 3, pp. 485–489, Mar. 2019. doi: https://doi.org/10.1109/LSP.2019.2895749. [Google Scholar] [CrossRef]
30. N. Alseelawi, H. Tuama Hazim, and H. T. S. Alrikabi, “A novel method of multimodal medical image fusion based on hybrid approach of NSCT and DTCWT,” Int. J. Online Biomed. Eng., vol. 18, no. 3, pp. 114–133, Mar. 2022. doi: https://doi.org/10.3991/ijoe.v18i03.28011. [Google Scholar] [CrossRef]
31. C. Zhang, “Multifocus image fusion using multiscale transform and convolutional sparse representation,” Int. J. Wavelets, Multiresolut. Inf. Process., vol. 19, no. 1, pp. 2050061, Oct. 2020. doi: https://doi.org/10.1142/S0219691320500617. [Google Scholar] [CrossRef]
32. D. C. Lepcha, B. Goyal, and A. Dogra, “Image fusion based on cross bilateral and rolling guidance filter through weight normalization,” Open Neuroimag J., vol. 13, no. 1, pp. 51–61, Jan. 2021. doi: https://doi.org/10.2174/1874440002013010051. [Google Scholar] [CrossRef]
33. A. Dogra, B. Goyal, and S. Agrawal, “Osseous and digital subtraction angiography image fusion via various enhancement schemes and Laplacian pyramid transformations,” Future Gen. Comput. Syst., vol. 82, no. 1, pp. 149–157, May 2018. doi: https://doi.org/10.1016/J.FUTURE.2017.12.052. [Google Scholar] [CrossRef]
34. B. Goyal, D. Chyophel Lepcha, A. Dogra, V. Bhateja, and A. Lay-Ekuakille, “Measurement and analysis of multi-modal image fusion metrics based on structure awareness using domain transform filtering,” Meas., vol. 182, no. 8, pp. 109663, Sep. 2021. doi: https://doi.org/10.1016/J.MEASUREMENT.2021.109663. [Google Scholar] [CrossRef]
35. M. Yin, X. Liu, Y. Liu, and X. Chen, “Medical image fusion with parameter-adaptive pulse coupled neural network in nonsubsampled shearlet transform domain,” IEEE Trans. Instrum. Meas., vol. 68, no. 1, pp. 49–64, Jan. 2019. doi: https://doi.org/10.1109/TIM.2018.2838778. [Google Scholar] [CrossRef]
36. L. Yin, M. Zheng, G. Qi, Z. Zhu, F. Jin and J. Sim, “A novel image fusion framework based on sparse representation and pulse coupled neural network,” IEEE Access, vol. 7, pp. 98290–98305, 2019. doi: https://doi.org/10.1109/ACCESS.2019.2929303. [Google Scholar] [CrossRef]
37. J. Xia, Y. Chen, A. Chen, and Y. Chen, “Medical image fusion based on sparse representation and PCNN in NSCT domain,” Comput. Math. Methods Med., vol. 2018, no. 5, pp. 1–12, 2018. doi: https://doi.org/10.1155/2018/2806047. [Google Scholar] [PubMed] [CrossRef]
38. H. Li, X. He, D. Tao, Y. Tang, and R. Wang, “Joint medical image fusion, denoising and enhancement via discriminative low-rank sparse dictionaries learning,” Pattern Recognit., vol. 79, no. 3, pp. 130–146, Jul. 2018. doi: https://doi.org/10.1016/j.patcog.2018.02.005. [Google Scholar] [CrossRef]
39. Z. Zhu, H. Yin, Y. Chai, Y. Li, and G. Qi, “A novel multi-modality image fusion method based on image decomposition and sparse representation,” Inf. Sci., vol. 432, pp. 516–529, Mar. 2018. doi: https://doi.org/10.1016/j.ins.2017.09.010. [Google Scholar] [CrossRef]
40. Y. Li, J. Zhao, Z. Lv, and J. Li, “Medical image fusion method by deep learning,” Int. J. Cogn. Comput. Eng., vol. 2, no. 9, pp. 21–29, Jun. 2021. doi: https://doi.org/10.1016/j.ijcce.2020.12.004. [Google Scholar] [CrossRef]
41. M. Kaur and D. Singh, “Multi-modality medical image fusion technique using multi-objective differential evolution based deep neural networks,” J. Ambient Intell. Humaniz. Comput., vol. 12, no. 2, pp. 2483–2493, Feb. 2021. doi: https://doi.org/10.1007/s12652-020-02386-0. [Google Scholar] [PubMed] [CrossRef]
42. K. J. Xia, H. S. Yin, and J. Q. Wang, “A novel improved deep convolutional neural network model for medical image fusion,” Cluster Comput., vol. 22, no. 1, pp. 1515–1527, Feb. 2018. doi: https://doi.org/10.1007/S10586-018-2026-1. [Google Scholar] [CrossRef]
43. R. Wang, N. Fang, Y. He, Y. Li, W. Cao and H. Wang, “Multi-modal medical image fusion based on geometric algebra discrete cosine transform,” Adv. Appl. Clifford Algebr., vol. 32, no. 2, pp. 1–23, Apr. 2022. doi: https://doi.org/10.1007/s00006-021-01197-6. [Google Scholar] [CrossRef]
44. X. Li, F. Zhou, H. Tan, W. Zhang, and C. Zhao, “Multimodal medical image fusion based on joint bilateral filter and local gradient energy,” Inf. Sci., vol. 569, no. 7, pp. 302–325, Aug. 2021. doi: https://doi.org/10.1016/j.ins.2021.04.052. [Google Scholar] [CrossRef]
45. W. Li, Q. Lin, K. Wang, and K. Cai, “Improving medical image fusion method using fuzzy entropy and nonsubsampling contourlet transform,” Int. J. Imaging Syst. Technol., vol. 31, no. 1, pp. 204–214, Mar. 2021. doi: https://doi.org/10.1002/ima.22476. [Google Scholar] [CrossRef]
46. Z. Wang, X. Li, H. Duan, Y. Su, X. Zhang and X. Guan, “Medical image fusion based on convolutional neural networks and non-subsampled contourlet transform,” Expert Syst. Appl., vol. 171, no. 5, pp. 114574, Jun. 2021. doi: https://doi.org/10.1016/j.eswa.2021.114574. [Google Scholar] [CrossRef]
47. Z. Xu et al., “LatLRR-FCNs: Latent low-rank representation with fully convolutional networks for medical image fusion,” Front. Neurosci., vol. 14, pp. 1387, Jan. 2021. doi: https://doi.org/10.3389/fnins.2020.615435. [Google Scholar] [PubMed] [CrossRef]
48. Y. Liu et al., “Multimodal medical image fusion based on the spectral total variation and local structural patch measurement,” Int. J. Imaging Syst. Technol., vol. 31, no. 1, pp. 391–411, Mar. 2021. doi: https://doi.org/10.1002/ima.22460. [Google Scholar] [CrossRef]
49. B. K. Shreyamsha Kumar, “Image fusion based on pixel significance using cross bilateral filter,” Signal, Image Video Process., vol. 9, no. 5, pp. 1193–1204, 2013. doi: https://doi.org/10.1007/S11760-013-0556-9. [Google Scholar] [CrossRef]
50. C. Tomasi and R. Manduchi, “Bilateral filtering for gray and color images,” in Sixth Int. Conf. Comput. Vis. (IEEE Cat. No. 98CH36271), Bombay, India, 1998, pp. 839–846. [Google Scholar]
51. M. Zhang and B. K. Gunturk, “Multiresolution bilateral filtering for image denoising,” IEEE Trans. Image Process, vol. 17, no. 12, pp. 2324–2333, 2008. doi: https://doi.org/10.1109/TIP.2008.2006658. [Google Scholar] [PubMed] [CrossRef]
52. G. Petschnigg, R. Szeliski, M. Agrawala, M. Cohen, H. Hoppe and K. Toyama, “Digital photography with flash and no-flash image pairs,” ACM Trans. Graphics (TOG), vol. 23, no. 3, pp. 664–672, Aug. 2004. doi: https://doi.org/10.1145/1015706.1015777. [Google Scholar] [CrossRef]
53. M. Iwanowski, “Edge-aware color image manipulation by combination of low-pass linear filter and morphological processing of its residuals,” in ICCVG 2020: Computer Vision and Graphics, 2020, pp. 59–71. doi: https://doi.org/10.1007/978-3-030-59006-2_6/COVER. [Google Scholar] [CrossRef]
54. P. Soille, “Morphological image analysis,” Morphol. Image Anal., 2004. doi: https://doi.org/10.1007/978-3-662-05088-0. [Google Scholar] [CrossRef]
55. P. Shah, S. N. Merchant, and U. B. Desai, “An efficient adaptive fusion scheme for multifocus images in wavelet domain using statistical properties of neighborhood,” in 14th Int. Conf. Inf. Fusion, Chicago, IL, USA, Jul. 2011, pp. 1–7. [Google Scholar]
56. S. J. Devlin, R. Gnanadesikan, and J. R. Kettenring, “Robust estimation and outlier detection with correlation coefficients,” Biometrika, vol. 62, pp. 531–545, Dec. 1975. doi: https://doi.org/10.1093/BIOMET/62.3.531. [Google Scholar] [CrossRef]
57. G. Zhang, R. Nie, J. Cao, L. Chen, and Y. Zhu, “FDGNet: A pair feature difference guided network for multimodal medical image fusion,” Biomed. Signal Process. Control, vol. 81, no. 3, pp. 104545, Mar. 2023. doi: https://doi.org/10.1016/J.BSPC.2022.104545. [Google Scholar] [CrossRef]
58. A. Sabeeh Yousif, Z. Omar, and U. Ullah Sheikh, “An improved approach for medical image fusion using sparse representation and Siamese convolutional neural network,” Biomed. Signal Process. Control, vol. 72, no. 3, pp. 103357, Feb. 2022. doi: https://doi.org/10.1016/J.BSPC.2021.103357.
59. C. S. Xydeas and P. Vladimir, “Objective image fusion performance measure,” Electron. Lett., vol. 36, no. 4, pp. 308–309, Feb. 2000. doi: https://doi.org/10.1049/el:20000267. [Google Scholar] [CrossRef]
60. E. D. Vidoni, “The whole brain atlas,” J. Neurol. Phys. Ther., vol. 36, no. 2, pp. 108, 2012. doi: https://doi.org/10.1097/NPT.0b013e3182563795. [Google Scholar] [CrossRef]
Cite This Article
 Copyright © 2024 The Author(s). Published by Tech Science Press.
This work is licensed under a Creative Commons Attribution 4.0 International License , which permits unrestricted use, distribution, and reproduction in any medium, provided the original work is properly cited.
 Downloads
 Citation Tools