
 Submit a Paper
 Propose a Special lssue
 Open Access
ARTICLE

A Novel Deep Learning-Based Model for Classification of Wheat Gene Expression
1 Faculty of Science, Port Said University, Port Said, Egypt
2 Modern Academy for Computer Science and Management Technology, Cairo, 11742, Egypt
3 Faculty of Computers and Artificial Intelligence, Damietta University, New Damietta, Egypt
4 Department of ICT Convergence, Soonchunhyang University, Asan, 31538, South Korea
5 Department of Mathematics, Faculty of Science, Mansoura University, Mansoura, 35516, Egypt
6 Department of Computational Mathematics, Science, and Engineering (CMSE), Michigan State University, East Lansing, MI, 48824, USA
* Corresponding Author: Byeong-Gwon Kang. Email:
Computer Systems Science and Engineering 2024, 48(2), 273-285. https://doi.org/10.32604/csse.2023.038192
Received 01 December 2022; Accepted 02 February 2023; Issue published 19 March 2024
 View Full Text
 Download PDF
Abstract
Deep learning (DL) plays a critical role in processing and converting data into knowledge and decisions. DL technologies have been applied in a variety of applications, including image, video, and genome sequence analysis. In deep learning the most widely utilized architecture is Convolutional Neural Networks (CNN) are taught discriminatory traits in a supervised environment. In comparison to other classic neural networks, CNN makes use of a limited number of artificial neurons, therefore it is ideal for the recognition and processing of wheat gene sequences. Wheat is an essential crop of cereals for people around the world. Wheat Genotypes identification has an impact on the possible development of many countries in the agricultural sector. In quantitative genetics prediction of genetic values is a central issue. Wheat is an allohexaploid (AABBDD) with three distinct genomes. The sizes of the wheat genome are quite large compared to many other kinds and the availability of a diversity of genetic knowledge and normal structure at breeding lines of wheat, Therefore, genome sequence approaches based on techniques of Artificial Intelligence (AI) are necessary. This paper focuses on using the Wheat genome sequence will assist wheat producers in making better use of their genetic resources and managing genetic variation in their breeding program, as well as propose a novel model based on deep learning for offering a fundamental overview of genomic prediction theory and current constraints. In this paper, the hyperparameters of the network are optimized in the CNN to decrease the requirement for manual search and enhance network performance using a new proposed model built on an optimization algorithm and Convolutional Neural Networks (CNN).Keywords
Cultivated crops must be increased to meet the world’s population’s food, feed, and fuel demand projected at more than 9 billion by 2050 [1]. One in nine people currently finds themselves living under food insecurity [2]. With limited opportunities to expand farming on existing land, increasing yields could dramatically reduce the number of people at risk of starvation [3]. Given the need to increase crop production by 50 percent by 2050 [4], our current yield levels are inadequate to achieve this target [5]. Therefore, it is necessary and urgent to find ways to boost crop productivity, such as by genetically modifying cultivars and improving agricultural practices [6,7]. The plant sector is the center of many countries’ production. Growing plant typically has special features, such as habits, morphology, and economic value. According to statistics, several plants are registered and named worldwide [8]. We apply genomic prediction techniques in the plant recognition and identification study to make this industry successful. New approaches and techniques in the detection of plant diseases are being employed in the Genomic processing industry. Therefore, in recent years, researchers have become involved in the detection of plant diseases by using genomic processing technology for their importance and effect on farming’s future. However, the prediction of the wheat gene is a new problem in machine learning. Through this method, the goal is to achieve a perfect model for wheat gene expression.
Deep learning is developing into a strong form of machine learning, which benefits both the outstanding computational resources and the very large available datasets [9]. The need to specifically define which features to use or use for data analysis is bypassed by deep learning. Deep learning then optimizes a robust end-to-end cycle by mapping data samples to outputs compatible with the large identified network training data sets. The CNNs practice this end-to-end mapping for image processing activities, by optimizing several layers of filters. The first filters are interpreted simply as low-level image features (e.g., borders, bright spots, color variations), and the subsequent layer combinations are more and more complex. CNN greatly outperforms all current alternative methods for image analysis where adequate training is given. Results improved from 84.6 percent in 2012 [10] to 96.4 percent in 2015 [11] with benchmark-classification tasks attempting to determine which one thousand different objects are pictures.
Machine Learning technology have be used in a lot of applications in recent years, including image processing. CNN as indicated in [12] is the most common architecture and is primarily used in deep analysis. The CNN is equipped with discriminatory learning features by supervised means. In contrast to other conventional neural networks, CNN utilizes a few artificial neurons that make it suitable for image detection and processing. On the other hand, for training phases, CNN needs a broad sample number. CNN also has hyperparameters and a wide range of special architectures that are considered expensive and difficult to identify manually such as optimum hyperparameters [13]. We are responsive to the planning, which dramatically impacts CNN efficiency, of certain hyperparameters. Moreover, the hyperparameters for each dataset have to be modified because the over-parameters are different from one dataset to another. The correct values for hyperparameters for a certain dataset are calculated by trial and error since a math format is not given to manually change the hyperparameters. Selecting hyperparameter values requires detailed data that forces non-experts to use a random search or a grid seeking to find the better hyperparameters, which achieve the best performance of CNN. In [14], they used six deep neural networks and machine learning techniques to investigate and exploit the methylation patterns of the Chinese spring bread wheat cultivar in order to identify differentially expressed genes (DEGs) between leaves and roots. Genes with increased terms at leaves were mostly engaged in pigment and photosynthesis production activities, as expected, whereas genes with no difference in expression amidst leaves and roots were mostly implicated in protein processing and diaphragm structures. In [15], they used this study to see how well the DL model worked in the spring wheat breeding programme at Washington State University. They compared and evaluated the execution of two DL techniques, the convolutional neural network (CNN) and the multilayer perceptron (MLP), ridge retraction better linear equitable predictor (rrBLUP), which is a popular GS model. They used the nested association mapping (NAM) for the Spring wheat many seeded from the 2014–2016 growth seasons yielded 650 recombinant inbred lines (RILs). They used cross-validations (CVs), alternative sets, and independent validations of SNP markers, they made predictions for five various quantitative variables using various genetic architectures. Hyperparameters for models of DL were adjusted by decreasing the root average square in the training dataset and employing dropout and regularization to avoid model overfitting.
In [16], they used R-CNN Faster to verify the spike number by using the dataset for high-density wheat 660K SNP array. They achieved an accuracy of 86.7%. They approve that the R-CNN Faster model is faster and has a high accuracy that may be applied to genetic investigations of SN in wheat.
A standardized DL architecture consists of a mixture of multiple “neurons” layers. In the 50s, with a prominent “perceptron” of Rosenblatt, the idea of a nerve network was proposed, inspired by the activity of the brain [17]. In the past decade, the DL resurgence was focused on the development of powerful algorithms which can be used in complex network parameters containing multiple layers of neurons (e.g., backpropagation) [18] and on the fact that they surpass current algorithms in various automated recognizing functions like picture checking [19]. Deep learning is an area of many specific jargon terms, which means that some of the most crucial terms are defined in Fig. 1 to make understanding easier for an inexperienced user.
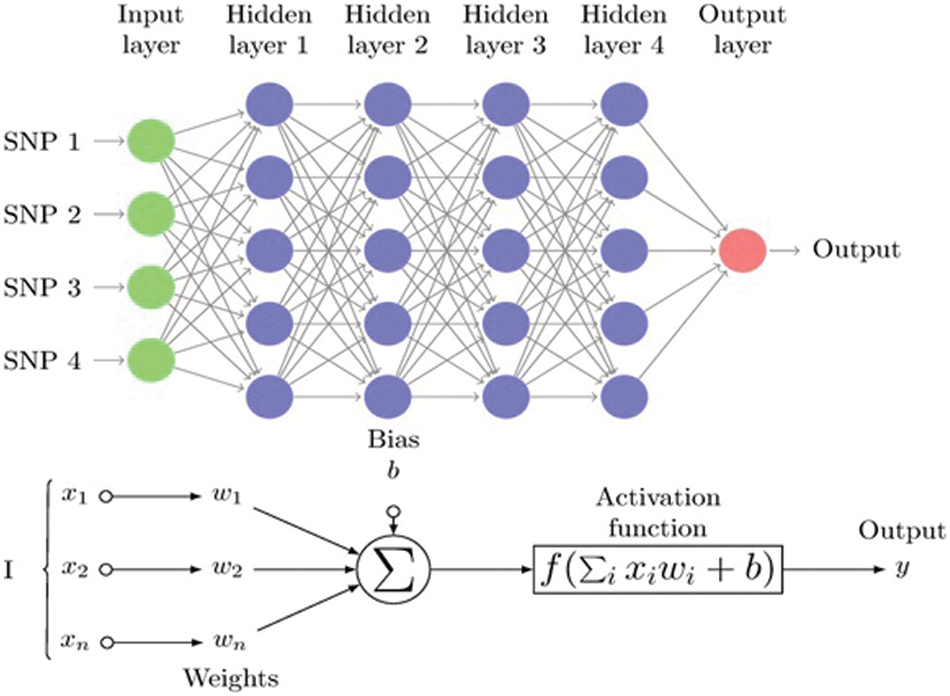
Figure 1: Multistage perceptron (MLP)
Fig. 1 Multistage perceptron (MLP) graph displaying the feedback of the simple “Neuron” with n inputs and four hidden layers of single nucleotide polymorphisms (SNPs). The linear combinations’ nonlinear transformations (xi, wi, and biases b) all culminate in a single neuron, where xi represents the neuron’s i input, wi represents a weight connected by input i, and b represents a time-invariant alignment level.
The linear combinations’ nonlinear transformations (xi, wi, and biases b) all culminate in a single neuron, where xi represents the neuron’s i input, wi represents a weight connected by input i, and b represents a time-invariant alignment level.
3.1 Deep Learning Architectures
Although all DL techniques generally use stacked neuron layers, they do also include a large architecture. The most prevalent ones are convolutional neuro-networks (CNN), multilayer perceptron (MLP), generative opposing networks (GANs), and recurrent neural networks (RNNs). These are listed in effect, although the reader should be aware of various additional options [20].
The multi-layer perceptron network (MLP) consists of a set of completely connected layers named hidden and input layers (see Fig. 2) and is one of the most common DL architectures. The first layer receives SNP genotypes (x) feedback in the sense of genomic prediction [21], while the initial layer’s output is a weighted, non-linear function of all feedback plus a “bias”. Then the first output layer is shown in Eq. (1):
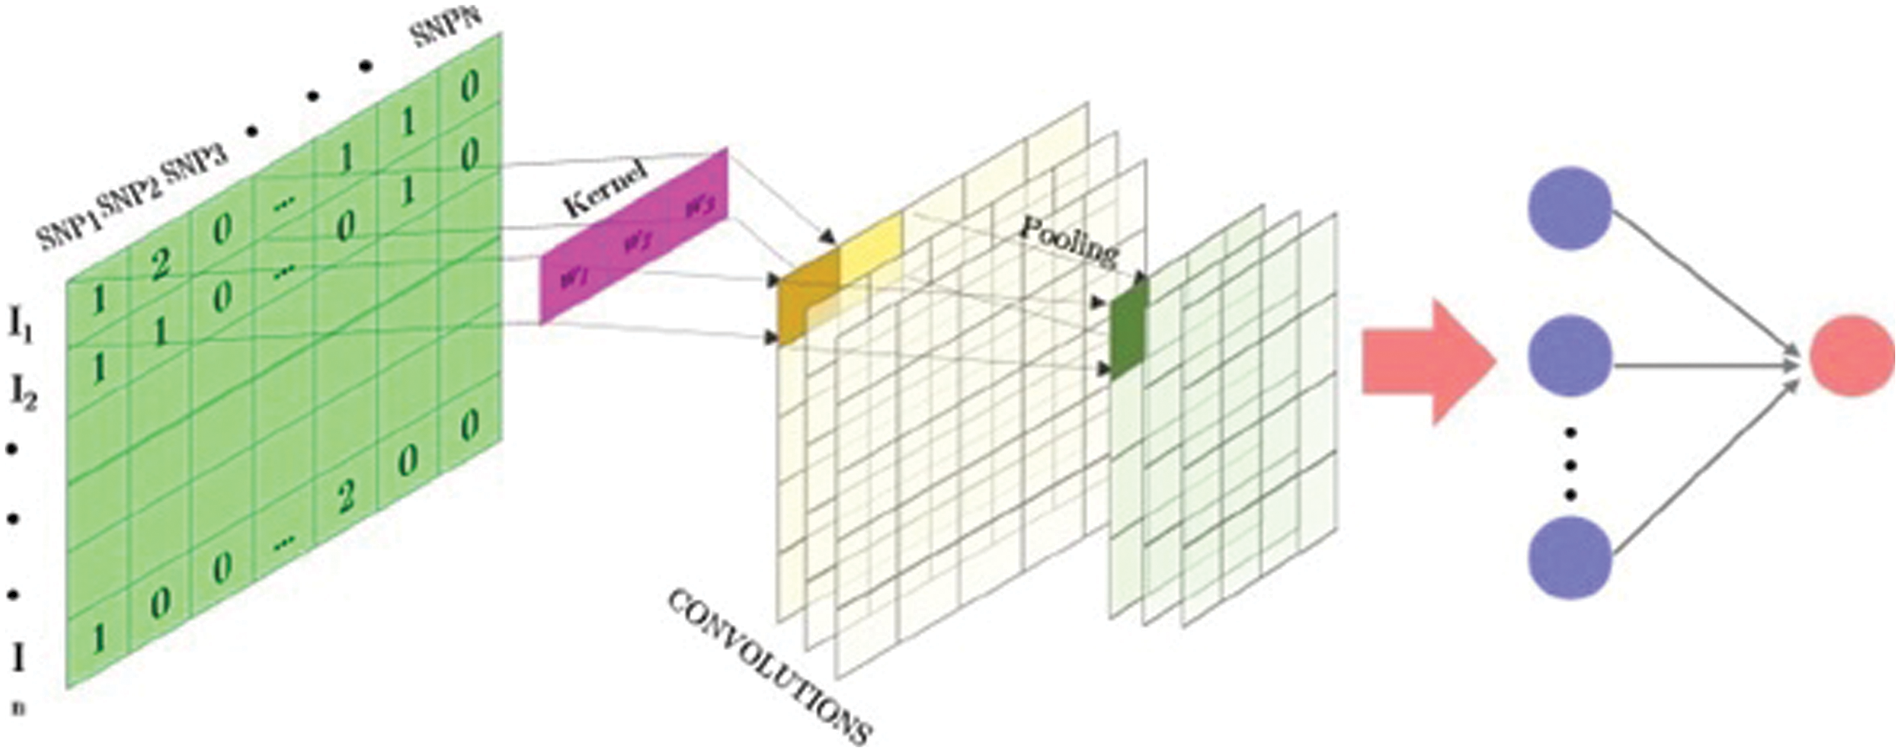
Figure 2: Total view of 1D fully convolutional SNP-matrix neural network
When x includes each individual’s genotypes, b is considered a “bias” and is measured along with the remaining weights W0 and f is a nonlinear function (activation function available on Keras). The same term is used in successive layers so that the neuron’s inputs of a certain layer are the outputs of the preceding layer z(k−1):
The final layer generates a number matrix, whether the goal is a true phenotype, or if the goal is a class (i.e., a problem with classifying) an array of probabilities for each point. Although MLPs constitute a powerful strategy for managing classification or regression issues, they are not the perfect way to handle space or time sets [22]. In latest years, other methods of DL have been suggested in order to deal with these challenges, such as recurrent neural networks, deep generative networks, or convolutional neural networks.
Input variables have been spread in accordance with space models with one dimension (for example, SNPs or text) and two or three dimensions (for example, images), to conform to the circumstances of the implementation of neural networks. CNN’s have been introduced. CNN is a particular type of neural network that uses convolution in hidden layers rather than of full matrix reproduction [23]. A CNN consists of thick layers and “convolutional layers” that are fully connected (Fig. 2). An overall operation as well as the input of predetermined width and steps are done in every convolutionary layer. A ‘kernel’ or ‘buffer’ is a collection of convolutional processes that functions similarly to a ‘neuron’ in an MLP [24].
After each convolution, the output is generated using an activation function. Finally, the results are frequently evened out through a “pooling” method. The kernel outputs of the various positioning positions are combined by using all values of those positions on average, maximum, or minimum. Its capability to which the amount of parameters to be determined is one of the main advantages of convolution networks. These networks have already restricted connections and are translations similar. Fig. 3 provides an example of a one-dimensional (1D) kernel convolution with a scale of 3K [25].
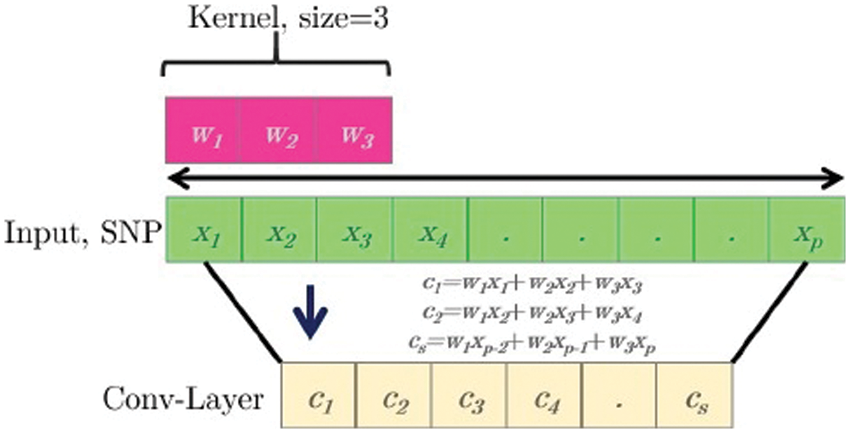
Figure 3: Simple one-dimensional (1D) operation scheme
3.2 Convolutional Neural Network
The CNN is so good at categorizing simple patterns in data, it might be utilized to build additional complicated patterns during higher layers. CNNs are a specific type of multilayer neural network. It is trained using the backpropagation algorithm, which is used by practically all other neural networks. CNN’s architecture sets it apart from the competition. In a CNN design, there are input layers, numerous hidden levels, and output layers. The hidden layer is made up of pooling layers, Convolutional layers, and fully connected layers [26].
The input data is received by the convolution layer, which applies a filter to it, essentially, the input data is multiplied by the kernel to generate the adjusted output data. A convolution layer subsampling method is the Pooling layer. The goal is to reduce the number of dimensions. An input layer serves as the first layer in the proposed CNN algorithm used in this study. The second layer makes up a one-dimensional convolution layer with three kernel sizes, a 30 filter, and RELU activation. The third layer is the max pooling layer, with two pool sizes. The next layer is a completely connected layer with the ability to activate RELU.
Finally, the output layer is made up of a single sigmoid activation in a neuron. The ADAM optimizer is applied for learning, as a cost function with binary cross-entropy.
RNN is the only algorithm with internal memory. Therefore, it is a very powerful and reliable algorithm, the RNN is incredibly powerful since it is still the only algorithm with internal memory. The internal memory of the RNN allows the algorithm to recall and research critical information about the input it receives; this ability allows the program to predict what will happen next with great accuracy [27]. The information in an RNN loops back on itself. As demonstrated in Fig. 4, it considers the current input as well as what it has learned from previous inputs before making a decision.
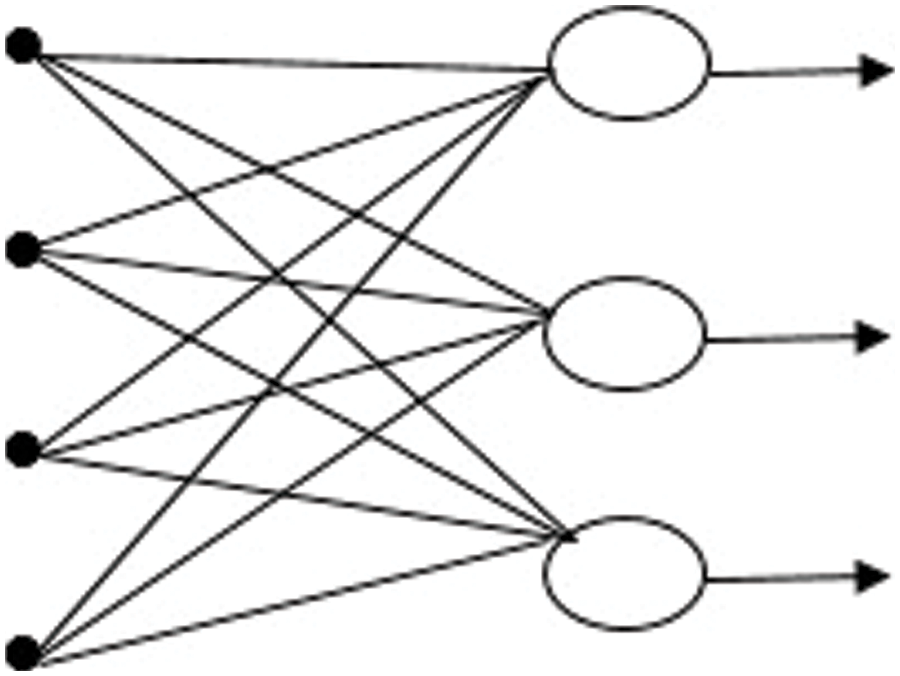
Figure 4: Recurrent neural network
This study employs a simple RNN layer, with the output being fed back into the input. The simple RNN layer is used to apply the RELU activation function. A sigmoid activation algorithm was also employed for the output layer. For learning, the ADAM optimizer is employed, and as a cost function, binary cross-entropy is used.
In this section, the dataset used to implement the proposed approach is first described, then the details of the approach proposed are explained.
The data for this study is from the Global Wheat data set, which is open to the public [28]. The original genotypic data consisted of 73,345 polymorphic markers anchored to the Chinese Spring Ref Seqv1 map. Before filtering the genotypic data, RILs with lacking phenotypic data in a single setting were deleted. SNP markers having a missing data rate of higher than 20%, minor allele frequencies of less than 0.10, and RILs with more than 10% genotypic data were also eliminated, leaving 40,000 SNP and 635 RILs markers for analysis. Using 635 RILs and 40,000 SNP markers, The demographic structure of the 26 NAM families was investigated using principal component analysis (PCA).
4.2 The Proposed Approach for Classification of Wheat Gene Expression
The solution suggested is an incredibly effective way of optimizing the efficiency of the CNN network by the incorporation of the terminals of two pre-trained CNN networks. In fact, the model’s hyperparameters are designed such that each model performs better. As seen in Fig. 5, the proposed algorithm steps will be summed up in four main stages, i.e., (a) stage planning details, (b) stage optimization hyperparameters, (c) learning stage, (d) evaluation stage. The following parts explain additional descriptions for every point.
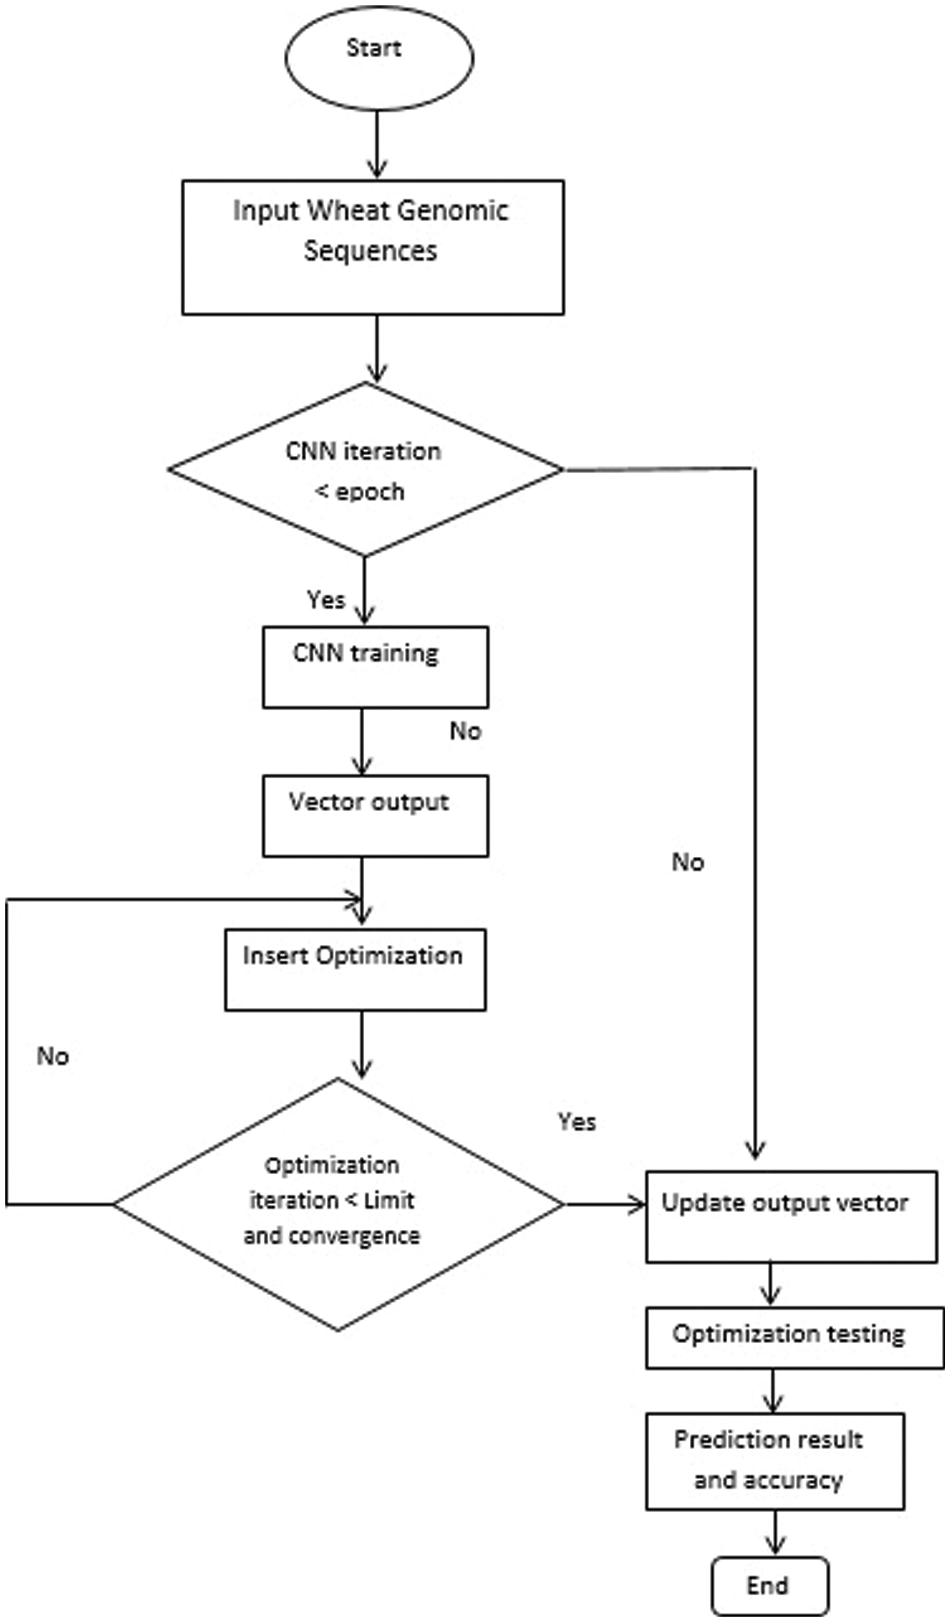
Figure 5: The proposed approach block diagram
The Multilayer Perceptron (MLP) with numerous hidden layers is an excellent example of a model with a deep architecture. On huge data, the most recent deep learning algorithm has overcome generalization, training stability, and scale are all issues that need to be addressed. Deep learning algorithms are typically the algorithm of choice for reliable forecast accuracy, and they perform well in a wide range of problems. There are several theoretical frameworks for deep learning, and we adopt the feedforward architecture in this study [29].
MLPs are feedforward neural networks with an architecture consisting of three layers: input, hidden, and output, as shown in Fig. 1. Neurons are little particles that make up each layer. The neurons in the input layer receive the input data X and forward it to the next layer of the network. The following layer, the hidden layer, receives input from each neuron; these data are a weighted total of the neuron’s outputs from the preceding layer. Each neuron uses an activation function to govern the input. A nonlinear mapping of an output vector to an input vector is created by this network, with weights (the vector of weights) as the parameters (W). The initial phase is to select the parameters of weight for the model and determine the MLP’s right structure, which is dictated by the number of neurons and hidden layers, as well as the number of output and input variables and the kind of activation function. Second, using the training data derives the weight parameters. The training selects the proper weight vector W to ensure that the output is as close to the aim as possible [30].
Our suggested MLP approach includes input layers, four hidden layer, and one neuron output layer. Except for the output layers, all levels utilize the rectified linear unit (RELU) activation function, which utilizes the non-linearity sigmoid activation function. The MLP model is trained using the backpropagation algorithm. ADAM: For the learning algorithm, a stochastic gradient descent optimizer was employed, with binary cross entropy as a cost function [31–35].
4.3 Improving DNN by Applying Dropout
Dropout is a model improvement strategy that prevents the model from overfitting. Dropout refers to the process of removing nodes from a neural network. Excluding a node means tentatively removing it from the network, together with all of its incoming and outgoing connections. The nodes are dropped out at random. As can be seen in Fig. 6. The dropout strategy was used in our proposed MLP model with a 20% dropout rate for all hidden layers, and the results were significantly better for our dataset.
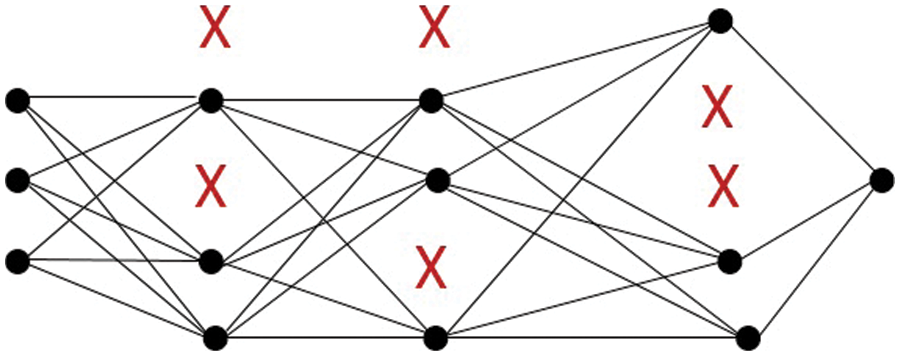
Figure 6: MLP with dropout
The protein interaction network was mapped to the gene expression levels from our dataset. Each time, 95 samples were used as testing data and 285 samples were used as training data to train the convolutional neural network architecture. There were 60 epochs in total. Then, by 95 samples (4 × 95 = 380) and k = 4, we rank-fold cross-validation (CV). The selecting test data were then randomized to a 10-time process of randomization, after which the average value for the following machine learning metrics—accuracy, specificity, recall (sensitivity), and precision—was calculated. These matrices show the relationship between correctly and incorrectly predicted outcomes. TN (True Negative), TP (True Positive), FN (False Negative), and FP (False Positive) are the four categories in the confusion matrix. which were defined as follows:
The size and number of convolutional filters, as well as the number and size of convolutional layers and hidden layers, were all examined in various combinations. With the architecture, the best outcomes were obtained. Table 1 shows that with our sample, with a mean accuracy of 99.4%, the improved DNN was the most accurate, followed by DNN with 98.2% and 97.5% for CNN and RNN, respectively.
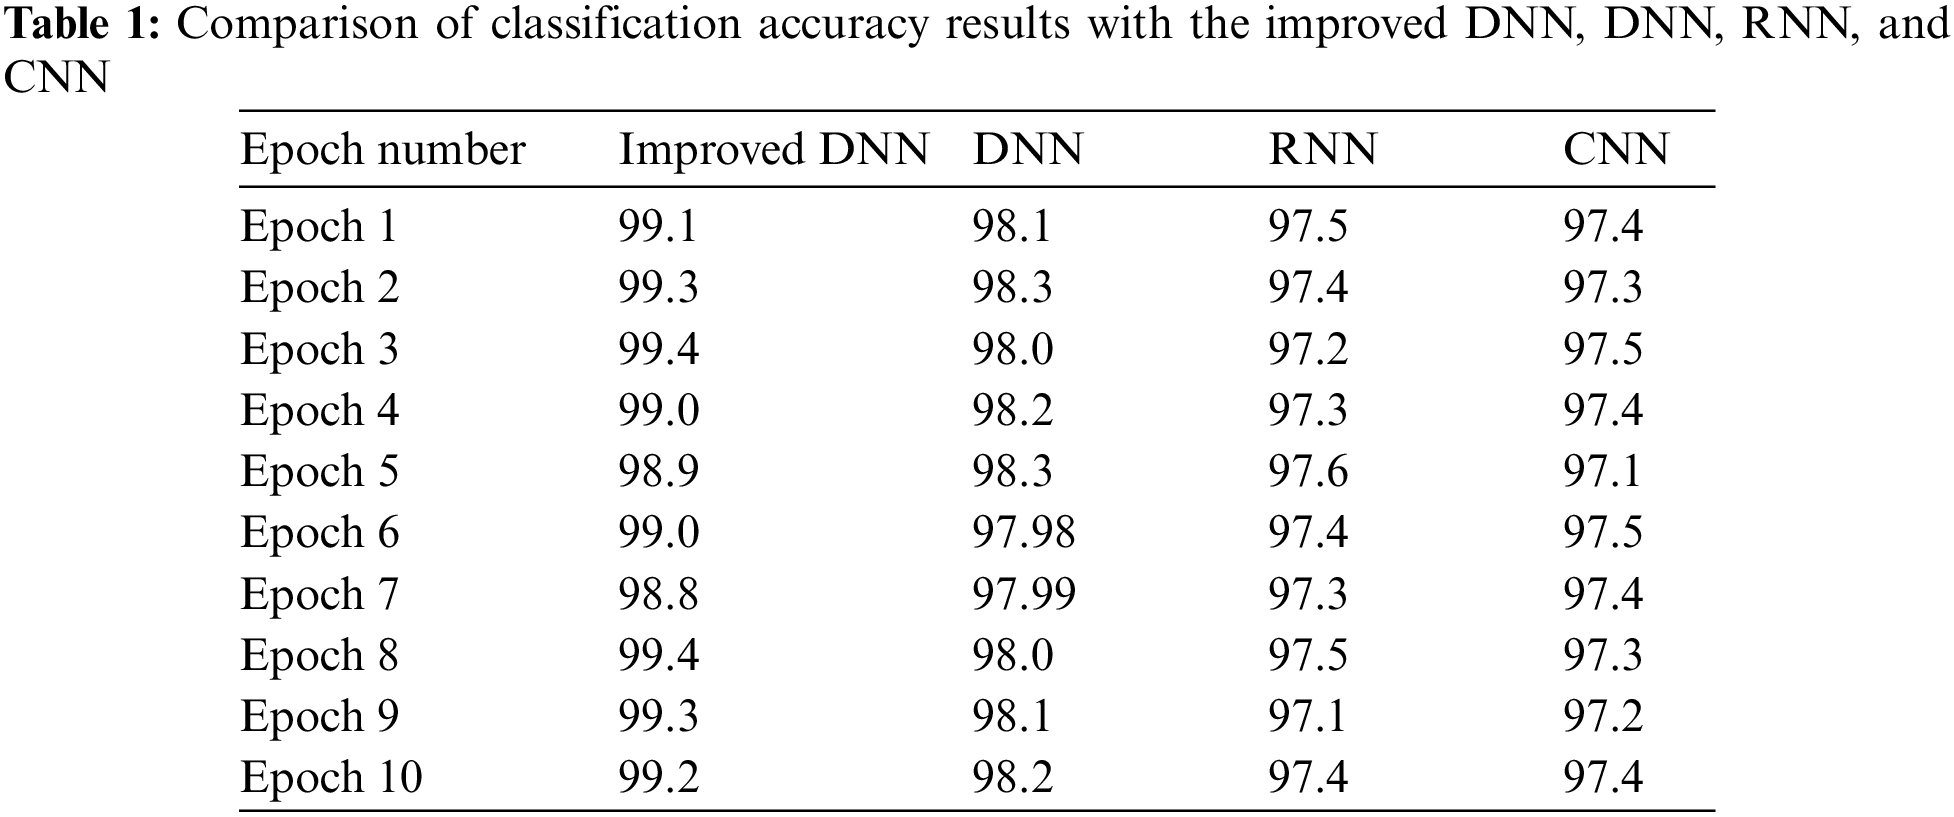
Overall, the improved DNN algorithm can be observed that attained maximum accuracy in this study’s dataset. There were 100 epochs in total. Fig. 7 shows the curves of the high-accuracy model discovered by Improved DNN on the convex dataset for 100 epochs when compared to DNN, RNN, and CNN models. We can see that accuracy of our models have improvement when compared to other models, implying that the Improved DNN is actually capable of identifying perfect models for a given dataset.
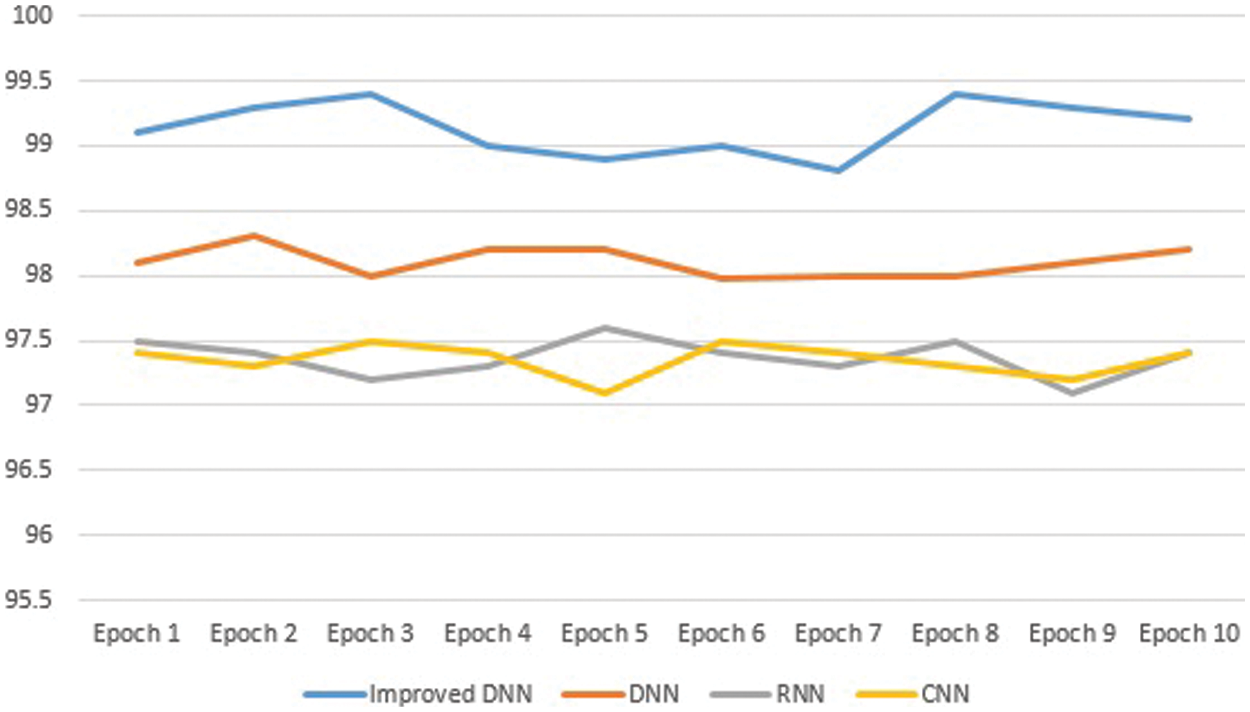
Figure 7: The comparison results
The performance results based on the three matrices (Accuracy, specificity, and precision) are shown in Table 2. Accuracy, specificity, and precision have respective means of 99.4%, 98.64%, and 91.85%.
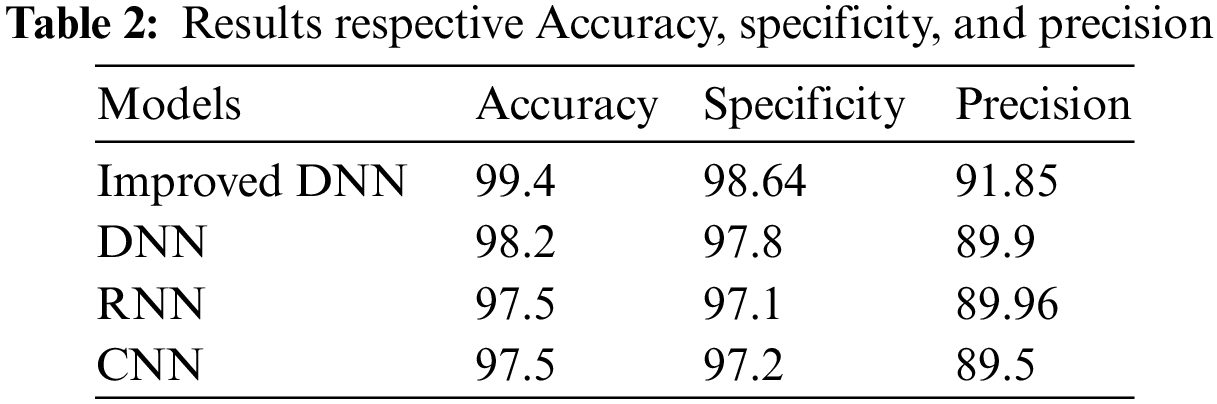
Fig. 8 shows the curves of the performance results based on the three matrices (Accuracy, specificity, and precision) when compared to DNN, RNN, and CNN models. We can see that accuracy of our models, specificity, and precision have improved when compared to other models.
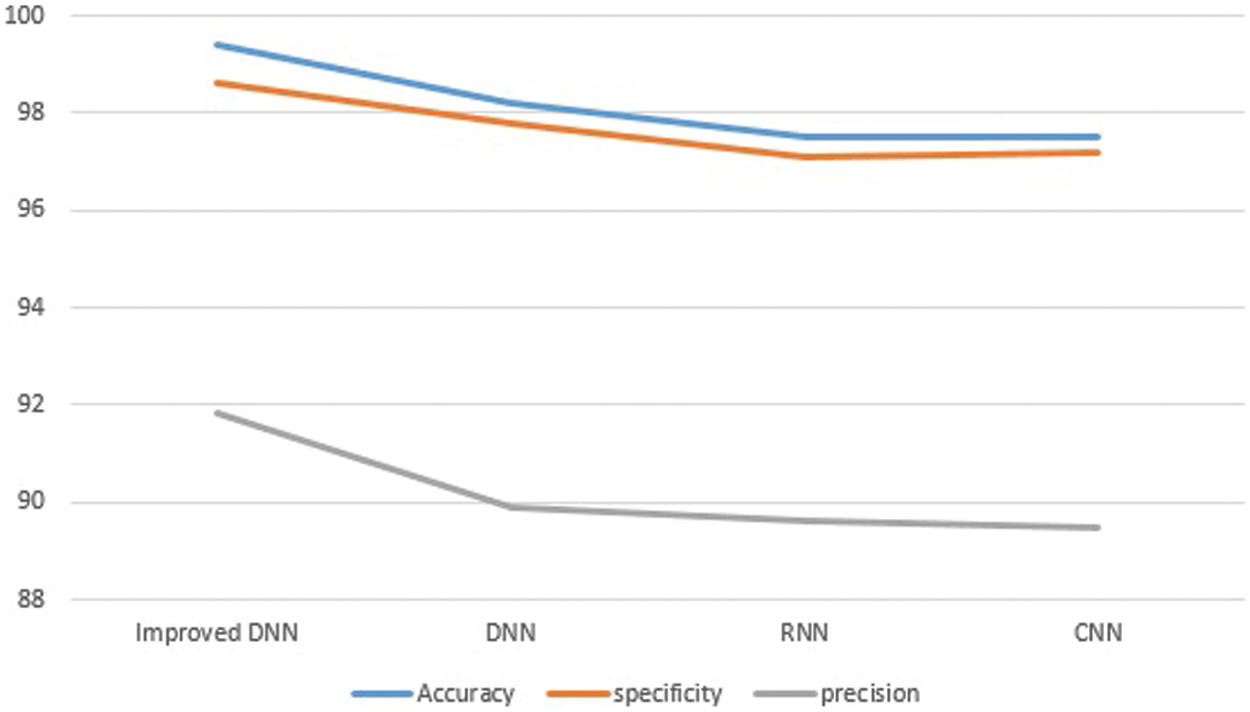
Figure 8: The comparison results (Accuracy, specificity, and precision)
In this paper, we have presented a novel deep learning-based model which improves DNN by applying the dropout model to classify Wheat gene expressions. In addition to, the deep learning algorithms CNN, DNN, and RNN, and the proposed model are implemented for the classification of gene expression data. Moreover, the outliers and noisy data are addressed, by using a pre-processing methodology for all features of gene expression, after that we trained all of our models individually using a perfect framework and learning method. Finally, our learned models are applied to testing data to classify it. For all of the datasets studied, the Improving-DNN outperformed other models in accuracy terms from the result illustrated our Improving-DNN has a high accuracy of 99.4%, while DNN has 98.2% accuracy, RNN and CNN have 97.5% accuracy. Therefore, the Improving-DNN model is actually more appropriate for solving the wheat gene expression dataset.
Acknowledgement: This research was supported by Korea Institute for Advancement of Technology (KIAT) grant funded by the Korean government, the National Research Foundation of Korea, and the Soonchunhyang University Research Fund.
Funding Statement: This research was supported by Korea Institute for Advancement of Technology (KIAT) grant funded by the Korea Government (MOTIE) (P0012724, The Competency Development Program for Industry Specialist), the National Research Foundation of Korea (NRF) grant funded by the Korea government (MSIT) (No. RS-2023-00218176), and the Soonchunhyang University Research Fund.
Author Contributions: Conceptualization, A.I., M.A.; methodology, A.I., W.H., M.A.; software, A.M.A., W.A.A., A.I.E., M. A.; validation, A.I., Y.N. and M.A.; formal analysis, B-G.K., W.H., A.M.A. and M.A.; investigation, A.I., W.A.A. and M.A.; resources, A.I., A.I.E. and W.H.; data curation, A.I., W.A.A. and M.A.; writing–original draft preparation, A.I., W.H. and M.A.; writing–review and editing, A.M.A., A.I.E., Y.N., B-G.K. and M. A.; visualization, A.I., A.M.A., M.A. and W.H.; supervision, W.A.A.; funding, Y.N., B-G.K.; project administration, A.I., A.M.A. and M.A. All authors have read and agreed to the published version of the manuscript.
Availability of Data and Materials: The data that support the findings of this study are available from the corresponding author, B-G.K., upon reasonable request.
Conflicts of Interest: The authors declare that they have no conflicts of interest to report regarding the present study.
References
1. U. N. Desa, World population prospects 2019: Highlights, vol. 11, no. 1. New York, USA: United Nations Department for Economic and Social Affairs, pp. 125, 2019. [Google Scholar]
2. S. McGuire, “FAO, IFAD, and WFP. The state of food insecurity in the world 2015: Meeting the 2015 international hunger targets: Taking stock of uneven progress. Rome: FAO,” Advances in Nutrition, vol. 6, pp. 623–624, 2015. [Google Scholar] [PubMed]
3. M. W. Rosegrant, S. Tokgoz, P. Bhandary and S. Msangi, “Looking ahead: Scenarios for the future of food. 2012 global food policy report. IFPRI. Washington,” International Food Policy Research Institute (IFPRI), vol. 4, no. 3, pp. 1–15, 2013. [Google Scholar]
4. D. Tilman, C. Balzer, J. Hill and B. L. Befort, “Global food demand and the sustainable intensification of agriculture,” in Proc. of the National Academy of Sciences, vol. 108, no. 50, pp. 20260–20264, 2011. [Google Scholar]
5. D. K. Ray, N. D. Mueller, P. C. West and J. A. Foley, “Yield trends are insufficient to double global crop production by 2050,” PLoS One, vol. 8, no. 6, pp. e66428, 2013. [Google Scholar] [PubMed]
6. H. Spiertz, “Avenues to meet food security. The role of agronomy on solving complexity in food production and resource use,” European Journal of Agronomy, vol. 43, no. 5, pp. 1–8, 2012. [Google Scholar]
7. J. L. Araus, R. Park, D. Calderini, D. Miralles, T. Shen et al., “Prospects of doubling global wheat yields,” Food and Energy Security, vol. 2, no. 1, pp. 34–48, 2013. [Google Scholar]
8. W. Hamdy, A. Ismail, W. A. Awad, A. H. Ibrahim and A. Hassanien, “A support vector machine model for rice (Oryza sativa L.) leaf diseases based on particle swarm optimization,” in Artificial Intelligence: A Real Opportunity in the Food Industry. Cham: Springer, pp. 45–54, 2023. [Google Scholar]
9. Y. LeCun, Y. Bengio and G. Hinton, “Deep learning,” Nature, vol. 521, no. 7553, pp. 436–444, 2015. [Google Scholar] [PubMed]
10. A. Elaraby, W. Hamdy and M. Alruwaili, “Optimization of deep learning model for plant disease detection using particle swarm optimizer,” Computers, Materials & Continua, vol. 71, no. 2, pp. 4019–4031, 2022. [Google Scholar]
11. J. R. Ubbens and I. Stavness, “Corrigendum: Deep plant phenomics: A deep learning platform for complex plant phenotyping tasks,” Frontiers in Plant Science, vol. 8, no. 12, pp. 2245, 2018. [Google Scholar] [PubMed]
12. A. Elaraby, W. Hamdy and S. Alanazi, “Classification of citrus diseases using optimization deep learning approach,” Computational Intelligence and Neuroscience, vol. 2022, no. 10, pp. 9153207–9153212, 2022. [Google Scholar] [PubMed]
13. N. Ni and S. Xu, “Model optimization strategies based on deep neural networks Learning and application of pruning optimization algorithms,” Journal of Physics: Conference Series, vol. 2303, no. 1, pp. 012033, 2022. [Google Scholar]
14. A. N. Diaye, B. Byrns, A. T. Cory, K. T. Nilsen, S. Walkowiak et al., “Machine learning analyses of methylation profiles uncovers tissue-specific gene expression patterns in wheat,” The Plant Genome, vol. 13, no. 2, pp. e20027, 2020. [Google Scholar]
15. K. S. Sandhu, D. N. Lozada, Z. Zhang, M. O. Pumphrey and A. H. Carter, “Deep learning for predicting complex traits in spring wheat breeding program,” Frontiers in Plant Science, vol. 11, no. 4, pp. 613325–613335, 2021. [Google Scholar] [PubMed]
16. L. Li, M. A. Hassan, S. Yang, F. Jing, M. Yang et al., “Development of image-based wheat spike counter through a Faster R-CNN algorithm and application for genetic studies,” The Crop Journal, vol. 12, no. 3, pp. 1–12, 2022. [Google Scholar]
17. P. Matteo, “Machines that morph logic: Neural networks and the distorted automation of intelligence as statistical inference,” Glass Bead, vol. 1, no. 1, pp. 25–36, 2017. [Google Scholar]
18. L. B. Balzer and M. L. Petersen, “Invited commentary: Machine learning in causal inference-how do I love thee? Let me count the ways,” American Journal of Epidemiology, vol. 190, no. 8, pp. 1483–1487, 2021. [Google Scholar] [PubMed]
19. I. H. Sarker, “Deep learning: A comprehensive overview on techniques, taxonomy, applications and research directions,” SN Computer Science, vol. 2, no. 6, pp. 420, 2021. [Google Scholar] [PubMed]
20. G. Jing, P. Li, Z. Chen and J. Zhang, “A survey on deep learning for multimodal data fusion,” Neural Computation, vol. 32, no. 5, pp. 829–864, 2020. [Google Scholar]
21. G. R. T. de Lima and G. B. Scofield, “Feasibility study on operational use of neural networks in a flash flood early warning system,” Revista Brasileira de Recursos Hídricos, vol. 26, no. 2, pp. 1–10, 2021. [Google Scholar]
22. J. M. Silva, A. Figueiredo, J. Cunha, J. E. Dias, S. Silva et al., “Using rapid chlorophyll fluorescence transients to classify vitis genotypes,” Plants (Basel), vol. 9, no. 2, pp. 174–189, 2020. [Google Scholar] [PubMed]
23. M. Mostavi, Y. C. Chiu, Y. Huang and Y. Chen, “Convolutional neural network models for cancer type prediction based on gene expression,” BMC Medical Genomics, vol. 13, no. 5, pp. 1–13, 2020. [Google Scholar]
24. S. D. O’Donovan, K. Essens, D. Lopatta, F. Wimmenauer, A. Lukas et al., “Use of deep learning methods to translate drug-induced gene expression changes from rat to human primary hepatocytes,” PLoS One, vol. 15, no. 8, pp. e0236392, 2020. [Google Scholar] [PubMed]
25. H. Lahmer, A. E. Oueslati and Z. Lachiri, “Classification of DNA microarrays using deep learning to identify cell cycle regulated genes,” in 5th Int. Conf. on Advanced Technologies for Signal and Image Processing (ATSIP), Sousse, Tunisia, pp. 1–5, 2020. [Google Scholar]
26. B. He, L. Bergenstrahle, L. Stenbeck, A. Abid, A. Andersson et al., “Integrating spatial gene expression and breast tumour morphology via deep learning,” Nature Biomedical Engineering, vol. 4, no. 8, pp. 827–834, 2020. [Google Scholar] [PubMed]
27. O. Ahmed and A. Brifcani, “Gene expression classification based on deep learning,” in 4th Scientific Int. Conf. Najaf (SICN), Najaf, Iraq, pp. 145–149, 2019. [Google Scholar]
28. K. W. Jordan, S. Wang, F. He, S. Chao, Y. Lun et al., “The genetic architecture of genome-wide recombination rate variation in allopolyploid wheat revealed by nested association mapping,” The Plant Journal: For Cell and Molecular Biology, vol. 95, no. 6, pp. 1039–1054, 2018. [Google Scholar] [PubMed]
29. W. Hamdy, A. Darwish and A. E. Hassanien, “Artificial intelligence strategy in the age of COVID-19: Opportunities and challenges,” in Digital Transformation and Emerging Technologies for Fighting COVID-19 Pandemic: Innovative Approaches. Cham: Springer International Publishing, pp. 81–93, 2021. [Google Scholar]
30. Y. C. Chiu, H. Chen, T. Zhang, S. Zhang, A. Gorthi et al., “Predicting drug response of tumors from integrated genomic profiles by deep neural networks,” BMC Medical Genomics, vol. 12, no. 1, pp. 18–155, 2019. [Google Scholar] [PubMed]
31. H. Wang, R. Liu, P. Schyman and A. Wallqvist, “Deep neural network models for predicting chemically induced liver toxicity endpoints from transcriptomic responses,” Frontiers in Pharmacology, vol. 10, no. 4, pp. 42, 2019. [Google Scholar] [PubMed]
32. M. Abouhawwash, K. Deb and A. Alessio, “Exploration of multi-objective optimization with genetic algorithms for PET image reconstruction,” Journal of Nuclear Medicine, vol. 61, no. 1, pp. 572, 2020. [Google Scholar]
33. M. Kumar, K. Venkatachalam, M. Masud and M. Abouhawwash, “Novel dynamic scaling algorithm for energy efficient cloud computing,” Intelligent Automation & Soft Computing, vol. 33, no. 3, pp. 1547–1559, 2022. [Google Scholar]
34. G. Ravikumar, K. Venkatachalam, M. A. AlZain, M. Masud and M. Abouhawwash, “Neural cryptography with fog computing network for health monitoring using IoMT,” Computer Systems Science and Engineering, vol. 44, no. 1, pp. 945–959, 2023. [Google Scholar]
35. K. S. Bhuvaneshwari, J. Uma, K. Venkatachalam, M. Masud, M. Abouhawwash et al., “Gaussian support vector machine algorithm based air pollution prediction,” Computers, Materials & Continua, vol. 71, no. 1, pp. 683–695, 2022. [Google Scholar]
Cite This Article
 Copyright © 2024 The Author(s). Published by Tech Science Press.
This work is licensed under a Creative Commons Attribution 4.0 International License , which permits unrestricted use, distribution, and reproduction in any medium, provided the original work is properly cited.
 Downloads
 Citation Tools