
 Submit a Paper
 Propose a Special lssue
 Open Access
ARTICLE

Modeling of Large-Scale Hydrogen Storage System Considering Capacity Attenuation and Analysis of Its Efficiency Characteristics
1 Key Laboratory of Modern Power System Simulation and Control & Renewable Energy Technology, Ministry of Education (Northeast Electric Power University), Jilin, 132012, China
2 Ministry of Science and Technology, Electric Power Research Institute of State Grid Liaoning Electric Power Co., Ltd., Shenyang, 110006, China
3 Northeast Electric Power Dispatching Control Center, Northeast Branch of State Grid Corporation of China, Shenyang, 110180, China
* Corresponding Author: Cuiping Li. Email:
(This article belongs to the Special Issue: Fault Diagnosis and State Evaluation of New Power Grid)
Energy Engineering 2024, 121(2), 291-313. https://doi.org/10.32604/ee.2023.027593
Received 05 November 2022; Accepted 16 January 2023; Issue published 25 January 2024
 View Full Text
 Download PDF
Abstract
In the existing power system with a large-scale hydrogen storage system, there are problems such as low efficiency of electric-hydrogen-electricity conversion and single modeling of the hydrogen storage system. In order to improve the hydrogen utilization rate of hydrogen storage system in the process of participating in the power grid operation, and speed up the process of electric-hydrogen-electricity conversion. This article provides a detailed introduction to the mathematical and electrical models of various components of the hydrogen storage unit, and also establishes a charging and discharging efficiency model that considers the temperature and internal gas partial pressure of the hydrogen storage unit. These models are of great significance for studying and optimizing gas storage technology. Through these models, the performance of gas storage units can be better understood and improved. These studies are very helpful for improving energy storage efficiency and sustainable development. The factors affecting the charge-discharge efficiency of hydrogen storage units are analyzed. By integrating the models of each unit and considering the capacity degradation of the hydrogen storage system, we can construct an efficiency model for a large hydrogen storage system and power conversion system. In addition, the simulation models of the hydrogen production system and hydrogen consumption system were established in MATLAB/Simulink. The accuracy and effectiveness of the simulation model were proved by comparing the output voltage variation curve of the simulation with the polarization curve of the typical hydrogen production system and hydrogen consumption system. The results show that the charge-discharge efficiency of the hydrogen storage unit increases with the increase of operating temperature, and H2 and O2 partial voltage have little influence on the charge-discharge efficiency. In the process of power conversion system converter rectification operation, its efficiency decreases with the increase of temperature, while in the process of inverter operation, power conversion system efficiency increases with the increase of temperature. Combined with the efficiency of each hydrogen storage unit and power conversion system converter, the upper limit of the capacity loss of different hydrogen storage units was set. The optimal charge-discharge efficiency of the hydrogen storage system was obtained by using the Cplex solver at 36.46% and 66.34%.Keywords
The Guiding Opinions on Accelerating the Development of New Energy Storage issued by the National Development and Reform Commission and the National Energy Administration in July 2021 [1], stating that hydrogen energy is regarded as “new energy storage”, which indicates that hydrogen energy storage has great development prospects. Compared with other electrochemical energy storage, hydrogen energy storage is a green energy storage technology, which can be used in scenarios such as absorbing renewable energy, grid peak shaving and valley filling, and microgrid. However, there are few studies on the charge-discharge efficiency, hydrogen production and hydrogen consumption flow rates of hydrogen storage systems. In order to better understand the performance of hydrogen storage systems (HSS) and provide a basis for their participation in power system peak shaving and capacity allocation [2], it is necessary to conduct in-depth research and analysis of the internal characteristics of the entire hydrogen storage system.
The electrochemical reaction of the HSS during charging and discharging is a nonlinear process affected by many factors. In terms of electrical engineering applications, in order to facilitate research, common electrical components are used, and the external characteristics of the voltage and current of the hydrogen storage system during the charging and discharging process are connected, and an equivalent circuit model is constructed to clearly describe the charging and discharging characteristics of the HSS. In terms of battery characteristics analysis and modeling, Li et al. [3] constructed a third-order dynamic model of lead-acid batteries, which provided a basis for the rational use of lead-acid batteries and state monitoring; He et al. [4] introduced three modeling methods for the operating efficiency and life decay of electrochemical energy storage systems; Feng et al. [5] comprehensively considered factors such as battery capacity, temperature, and rate, and analyzed the power battery terminal voltage and ohmic polarization, electrical The relationship between chemical polarization, concentration polarization, unbalanced potential, hysteresis characteristics and other factors, a dynamic comprehensive equivalent circuit model is proposed to analyze the battery characteristics; Li et al. [6] based on the working mechanism and external characteristics of vanadium redox batteries, we have established a battery simulation model. Through this model, we studied the voltage and current loss characteristics of vanadium redox batteries under rated power charging and discharging modes, and measured the changes in charging and discharging efficiency at low temperatures under different power levels; Liu [7] analyzed a charging and discharging efficiency model for lithium iron phosphate batteries was established and the factors affecting efficiency were analyzed.
For the research on the characteristics of each part of the hydrogen storage system, Liu et al. [8] introduced the characteristics of hydrogen energy storage and the current mathematical model of electricity-hydrogen energy storage; Qin et al. [9] established a wind-hydrogen coupled system model, and has Modeling of hydrogen storage and hydrogen consumption; Ren et al. [10] considered the physical characteristics of the HSS, and established a high-pressure hydrogen storage tank operation model based on Fan’s equation; Gu et al. [11] detailed description of the various characteristics of proton exchange membrane fuel cells and construction of its simulation model; Farrukh et al. [12] established mathematical models of electrolytic cells and fuel cells, and studied the effects of various parameters on system energy efficiency and external energy efficiency from an energy perspective. At the same time, we also considered the participation of hydrogen storage systems; Cai et al. [13] mainly focused on the hydrogen consumption and durability characteristics of fuel cells, and proposes an optimal control method for multi series fuel cell systems that considers system hydrogen consumption and durability, in order to reduce system hydrogen consumption and extend service life; Cai et al. [14] combined the electrochemical characteristics, gas flow, and temperature of proton exchange membrane fuel cells, taking into account the efficiency and lifespan of fuel cells, and establishes a customized dynamic power generation system model based on PSCAD/EMTDC, and a grid-connected control strategy is proposed; Cai et al. [15] analyzed the power exchange characteristics of heterogeneous energy sources in the wind/solar hydrogen production system, establishes a homogenization analysis model of the wind/solar hydrogen production system, analyzes the operating point law and the operating point index range, analyzes the system operation domain and makes a reasonable analysis.
For the existing research on hydrogen storage system, Amir et al. [16] analyzed an innovative combination of solar cells has been established based on parabolic trough collectors and proton exchange membrane electrolyzers and fuel cell as a new green hydrogen production configuration from the perspective of thermodynamics and actual economy; Seyed et al. [17] proposed A new hybrid energy production/storage system has been proposed, including compressed air energy storage, a Brayton cycle driven by a heliostat, and a hydrogen production device. This system can reduce the pollutant emissions of compressed air energy storage technology, and has the advantages of high efficiency and environmental protection; Rama et al. [18] mainly introduced the importance of existing porous materials, polymers, metals and composite metal hydrides in solid hydrogen storage, and emphasized the importance of catalysts; a new hydrogen production system has been constructed using medical waste and zero carbon emissions biogas [19]. The system consists of plasma gasification, solid oxide fuel cells, steam turbine cycles, and autothermal reforming. This system can efficiently utilize waste resources and achieve a zero carbon emission hydrogen production process; research has been conducted on comprehensive efficiency [20], hydrogen production rate, and economic efficiency, and the use of cement waste heat through the Rankine cycle to generate the required electrical energy for the operation of PEM electrolytic cells; the power allocation degradation problem in multi stack fuel cell systems was considered to meet the load power requirements [21].
Research on System Capacity Decay Characteristics, Liu et al. [22] used FLUENT software to establish a numerical model for the leakage and diffusion of high-pressure hydrogen storage tanks, and studied its influencing factors. This method can be used to simulate the leakage and diffusion process of high-pressure hydrogen storage tanks, which helps to evaluate and optimize relevant safety measures. Li et al. [23] tested the durability of fuel cells through power generation-electrolysis cycle experiments, and analyzed the reasons for fuel cell performance degradation through electrochemical impedance spectroscopy and microphysical characterization methods. Zhu et al. [24] has been established to describe the aging degree of metal hydrogen storage tanks, based on the pressure composition temperature curve of the hydrogenation process of metal hydrogen storage tanks. This model can be used to evaluate the aging of hydrogen storage tanks and provide a reference for the maintenance and replacement of hydrogen storage tanks. Xu et al. [25] took 18650 NCM811 lithium-ion battery as the research object to study the influencing factors of the capacity decay of lithium-ion battery. Zhao et al. [26] conducted node tests on lithium titanate batteries for a specific number of cycles, and used the Arrhenius formula to establish a capacity decay characteristic curve.
Current research may not fully consider the factors of the entire hydrogen storage system when modeling hydrogen storage systems, and there are few literature describing the relationship between temperature and pressure on the charging and discharging efficiency of hydrogen storage systems. In addition, there is a lack of detailed description of the factors that affect the capacity decay characteristics of hydrogen storage systems. Therefore, future research can continue to explore the modeling of the entire hydrogen storage system, and delve into the effects of temperature and pressure on the charging and discharging efficiency of the hydrogen storage system, while analyzing and describing the factors that affect the capacity attenuation characteristics of the hydrogen storage system.
In this paper, the capacity attenuation characteristic equation applicable to the hydrogen storage system is constructed first considering the system capacity attenuation. On this basis, the simulation models of each part and the whole of the large-scale hydrogen storage system are established, and the mathematical models and electrical models of each unit of the hydrogen storage system are introduced. The physical meaning of each part is analyzed. The hydrogen storage system is systematically simulated and analyzed in MATLAB/Simulink using the electrical model. The validity of the simulation model is proved by comparing the polarization curves of typical hydrogen production and hydrogen consumption systems. Finally, the optimal charging and discharging efficiency of hydrogen storage system considering the capacity attenuation factor is obtained by synthesizing the unit model.
2 Network Structure of Large-Scale Hydrogen Storage System
The simplified structure of the power system with hydrogen storage system is shown in Fig. 1. The DC bus connects the large-scale hydrogen storage system with the public power grid and the photovoltaic power generation system. The large-scale hydrogen storage system constructed in this paper refers to a large-scale system consisting of a collection of multiple internal hydrogen storage units and an external power conversion system (PCS) converter. Each hydrogen storage unit includes a hydrogen production unit (PEM electrolyzer), a hydrogen storage tank and a hydrogen consumption unit (Proton exchange membrane fuel cell) [27]. Each electrolyzer unit and fuel cell unit are connected in series and parallel. Hydrogen production needs to meet the needs of local industries. By connecting the photovoltaic system, cheap renewable energy can be used to power the electrolyzer to obtain hydrogen and oxygen, which can be stored in the hydrogen storage tank. Acceptable electrical energy is delivered to the grid and can also reduce the amount of electricity purchased from the grid [28]. Since the actual electricity-to-hydrogen-to-electricity conversion efficiency is not high, it is necessary to study the characteristics of each part of the hydrogen storage system more specifically to improve its energy conversion efficiency within the artificially controllable range [29]. Based on this, this paper combines the mathematical model and electrical model of each part of the hydrogen storage system for simulation.
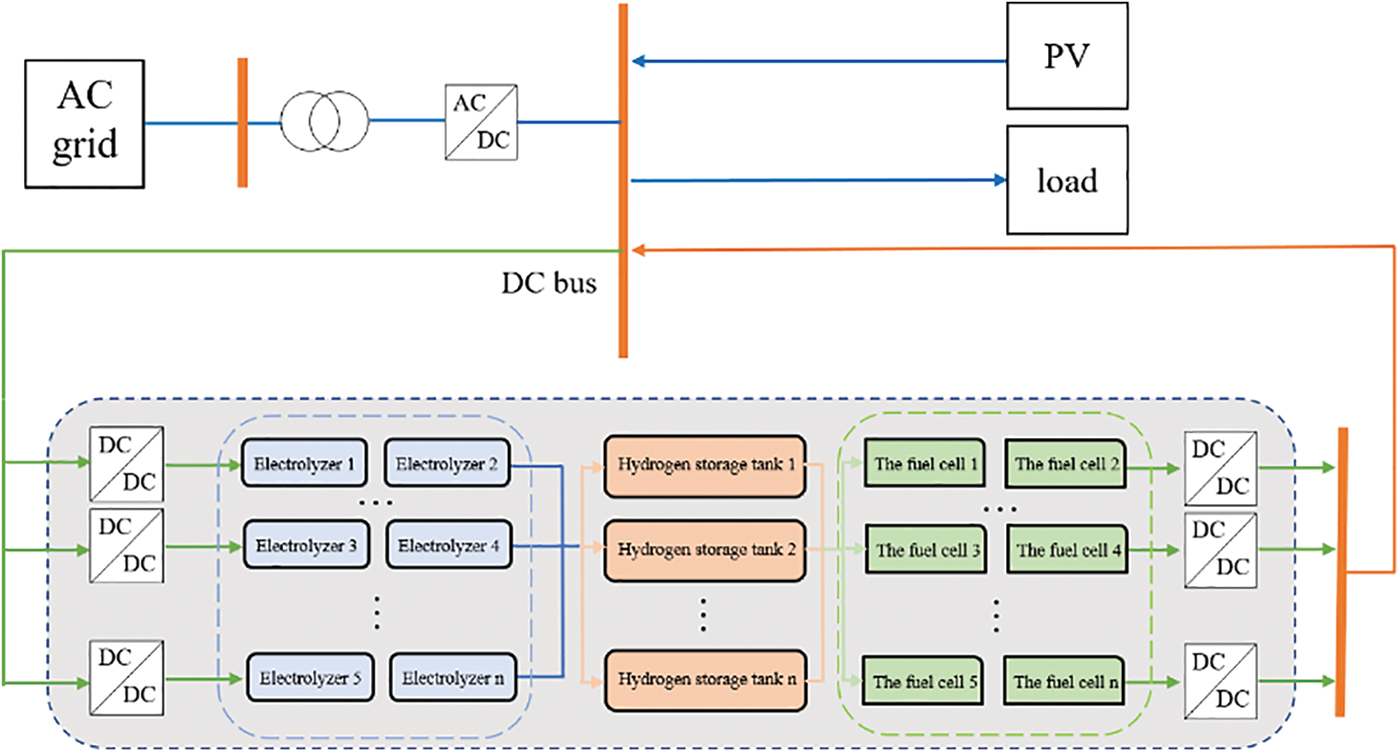
Figure 1: Structure of power system with hydrogen storage system
3 Simulation Model of Large-Scale Hydrogen Storage System
3.1 Simulation Model of Hydrogen Storage System
The hydrogen storage system consists of multiple electrolytic cell units, hydrogen storage tanks, and multiple fuel cell units. After the system is connected to the power grid, each electrolytic cell unit generates hydrogen gas and compresses it into a hydrogen storage tank. When electrical energy is needed, each fuel cell unit converts the hydrogen stored in the hydrogen storage tank into electrical energy.
Due to the different internal characteristics of each electrolyzer unit and fuel cell unit, and when the internal temperature and gas pressure of the hydrogen storage system are different, the charge and discharge efficiency will also change accordingly. Considering the series-parallel combination of the monomer model, the construction is composed of the large-scale hydrogen storage system is shown in Fig. 2.
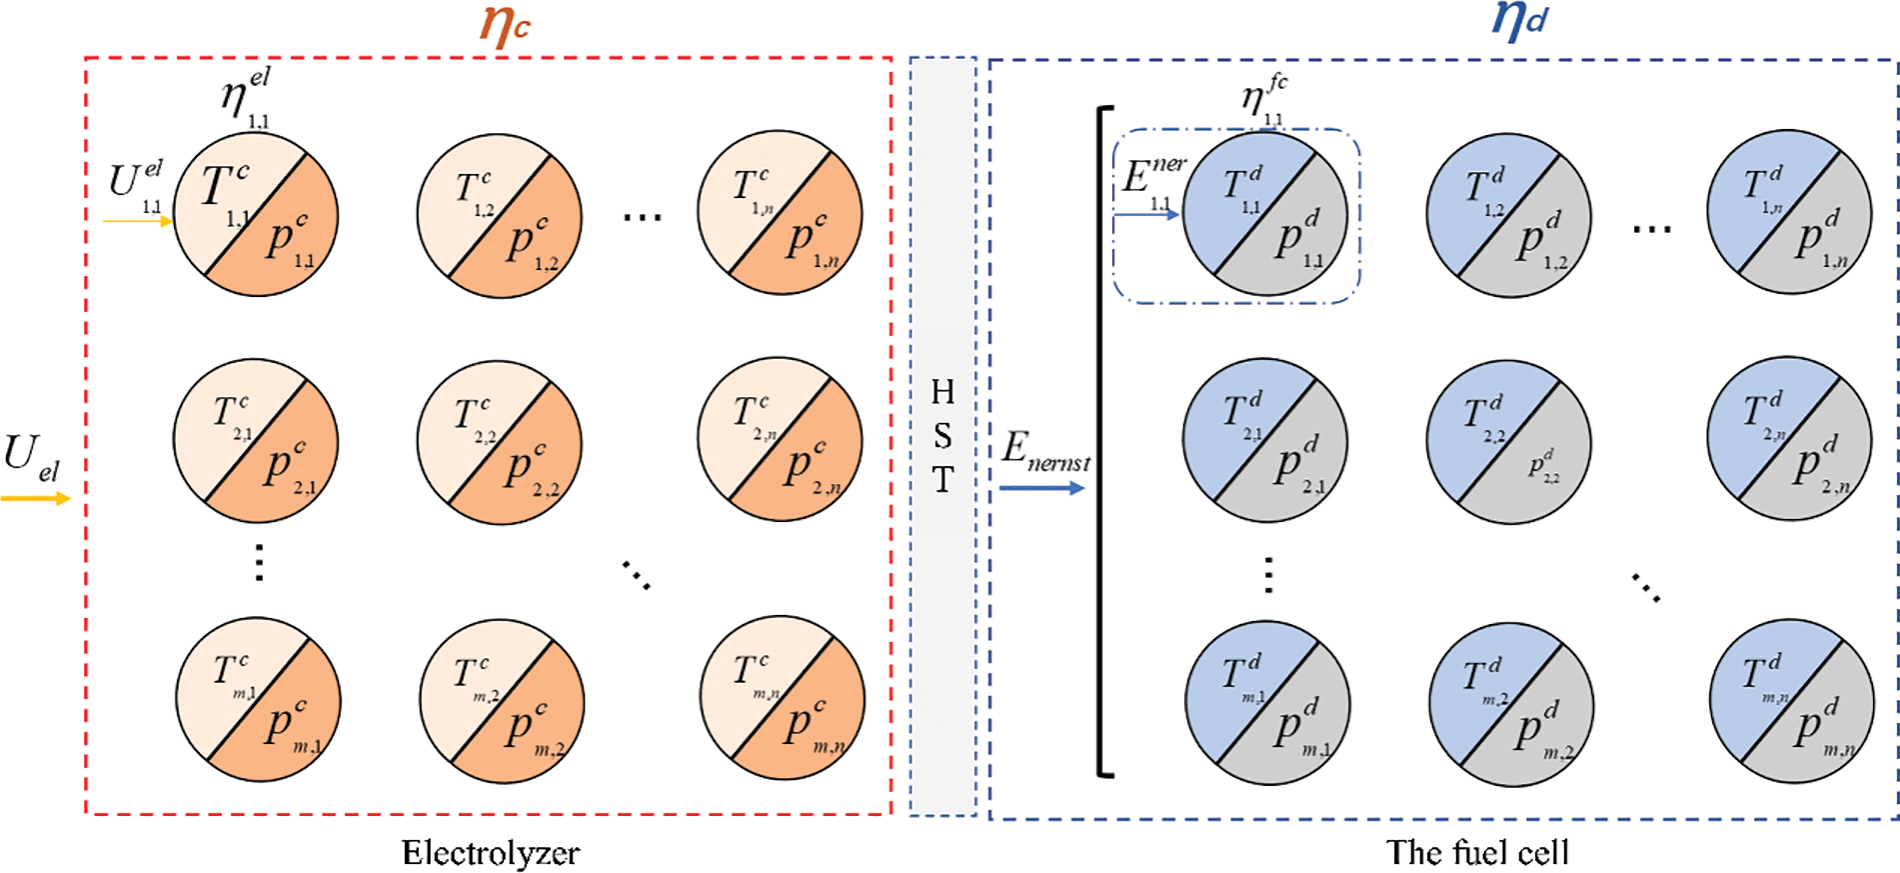
Figure 2: Simplified structure of large-scale hydrogen storage system
Assume that the temperature set and pressure set of each single cell in the series-parallel combination are
The temperature and pressure set for each single fuel cell are
m and n are the number of parallel and series connected large-scale hydrogen storage systems, respectively.
From this, the formulas for the charge and discharge efficiency of large-scale hydrogen storage systems are obtained as follows:
where
The energy conversion efficiency of PCS (Power Conversion System) in hydrogen storage systems during external charging and discharging processes will also have an impact on the efficiency of the entire large-scale hydrogen storage system. In addition to considering the impact of internal characteristics of large hydrogen storage systems on efficiency, it is also necessary to consider the impact of PCS energy conversion efficiency on the efficiency of the entire hydrogen storage system. The efficiency of PCS has a nonlinear relationship with the output power of the hydrogen storage system [30], The efficiency of PCS is as follows:
where
In summary, the total charge-discharge efficiency of the large-scale hydrogen storage system is:
In the actual production process, the capacity of the hydrogen storage system will gradually decrease due to a decrease in the number of cycles. The changes in working temperature and internal pressure within the system will have an impact on the absorption and release of hydrogen in the hydrogen storage system, and thus affect the capacity of the hydrogen storage system. In order to better fit the engineering practice, The capacity decay effect formula [22–24] that affects the capacity decay of the hydrogen storage system is:
where
According to the above formula, the total life loss of the hydrogen storage system is:
where
3.2 Hydrogen Storage Unit Model
1) Electrolyzer Model
The electrolytic cell voltage model is derived from the relationship between the electrolysis voltage and electrolytic current [31], and the single electrolytic cell voltage model can be expressed by the following formula:
where
In an electrolytic cell, the open circuit voltage is related to temperature and the activity of each component involved in the reaction. The open circuit voltage of the electrolytic cell can be derived through the Nernst equation. This equation is used to calculate the equilibrium voltage of a specific redox pair on the electrode relative to the standard potential:
where
The standard electromotive force expression is:
where
where
The ohmic polarization overvoltage is:
where
The cell efficiency formula is equal to the ratio of the input voltage inside the cell to the voltage at the cell port.
2) Fuel cell model
The output voltage of a single fuel cell [32] port can be expressed as:
where
Thermodynamic electromotive force means that the work done to transfer electrons during the H2 combustion reaction is equal to the Gibbs free energy released during the reaction without considering the loss, expressed by the Nernst equation and the Gibbs free energy change.
where
The activation polarization overvoltage is mainly manifested as a slow rate phenomenon when the electrode surface is just about to activate the electrochemical reaction, which is generally expressed by a fixed parameter.
where
The ohmic overvoltage of the PEMFC module is mainly caused by the voltage drop generated by the membrane impedance corresponding to the proton membrane, which is equivalent to the voltage drop generated by the internal resistance of the fuel cell.
where
The concentration overvoltage of the PEMFC module mainly occurs in the working state of high current. At this time, the electrochemical reaction is too fast, which causes the slow diffusion of reactants or products and the restriction of mass transfer of reactants. The mathematical expression is as follows:
where
The current density is:
The fuel cell efficiency formula is equal to the ratio of the output voltage of the fuel cell port to the thermodynamic electromotive force of the internal reaction.
3) Hydrogen storage tank model
The hydrogen production flow rate of a single electrolyzer is [33]:
The principle of hydrogen consumption molar flow rate is the same as above:
Hydrogen storage:
1) Equivalent circuit model of electrolyzer
The electrolytic cell model can be equivalent to the charging process, so the electrolytic cell can be considered as an equivalent power source. In an electrolytic cell, internal current flows from the positive pole of the power supply to the negative pole. However, the direction of overvoltage caused by activation polarization loss and ohmic overvoltage is opposite to the direction of open circuit voltage. That is to say, the effects of activated polarization and ohmic overvoltage will require a higher voltage than the open circuit voltage for the actual electrolysis process to proceed. Ohmic loss is mainly caused by the current passing through electrode materials, connecting components, liquid junction potential when in contact with different solutions, and the resistance of ions in the electrolyte. The relationship between Ohm voltage loss and current follows Ohm’s law, which means that voltage loss is equal to current multiplied by resistance. Polarization loss is mainly caused by the deviation of cell equilibrium potential caused by changes in concentration in the electrolytic cell. When the electrolyte concentration changes, polarization loss can lead to a difference between the working voltage and open circuit voltage of the electrolytic cell. In summary, ohmic loss and polarization loss are the two main factors causing voltage loss in the electrolysis process.
According to the above analysis, the equivalent circuit model of the electrolytic cell [34] is shown in Fig. 3.
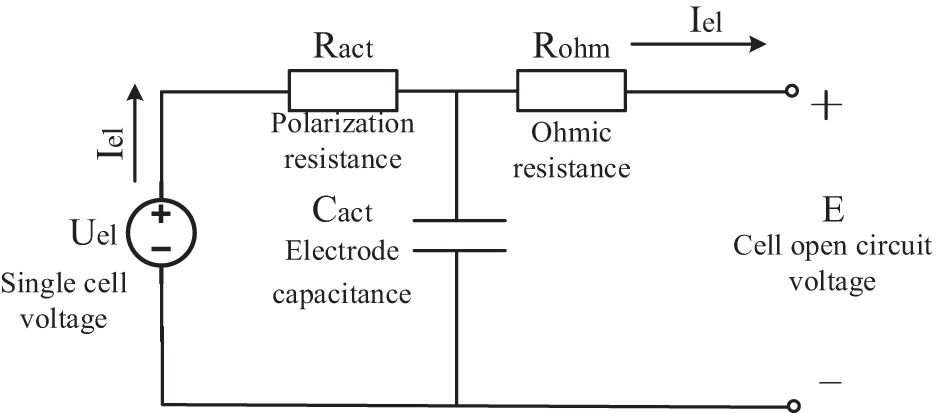
Figure 3: Electrolyzer equivalent circuit model
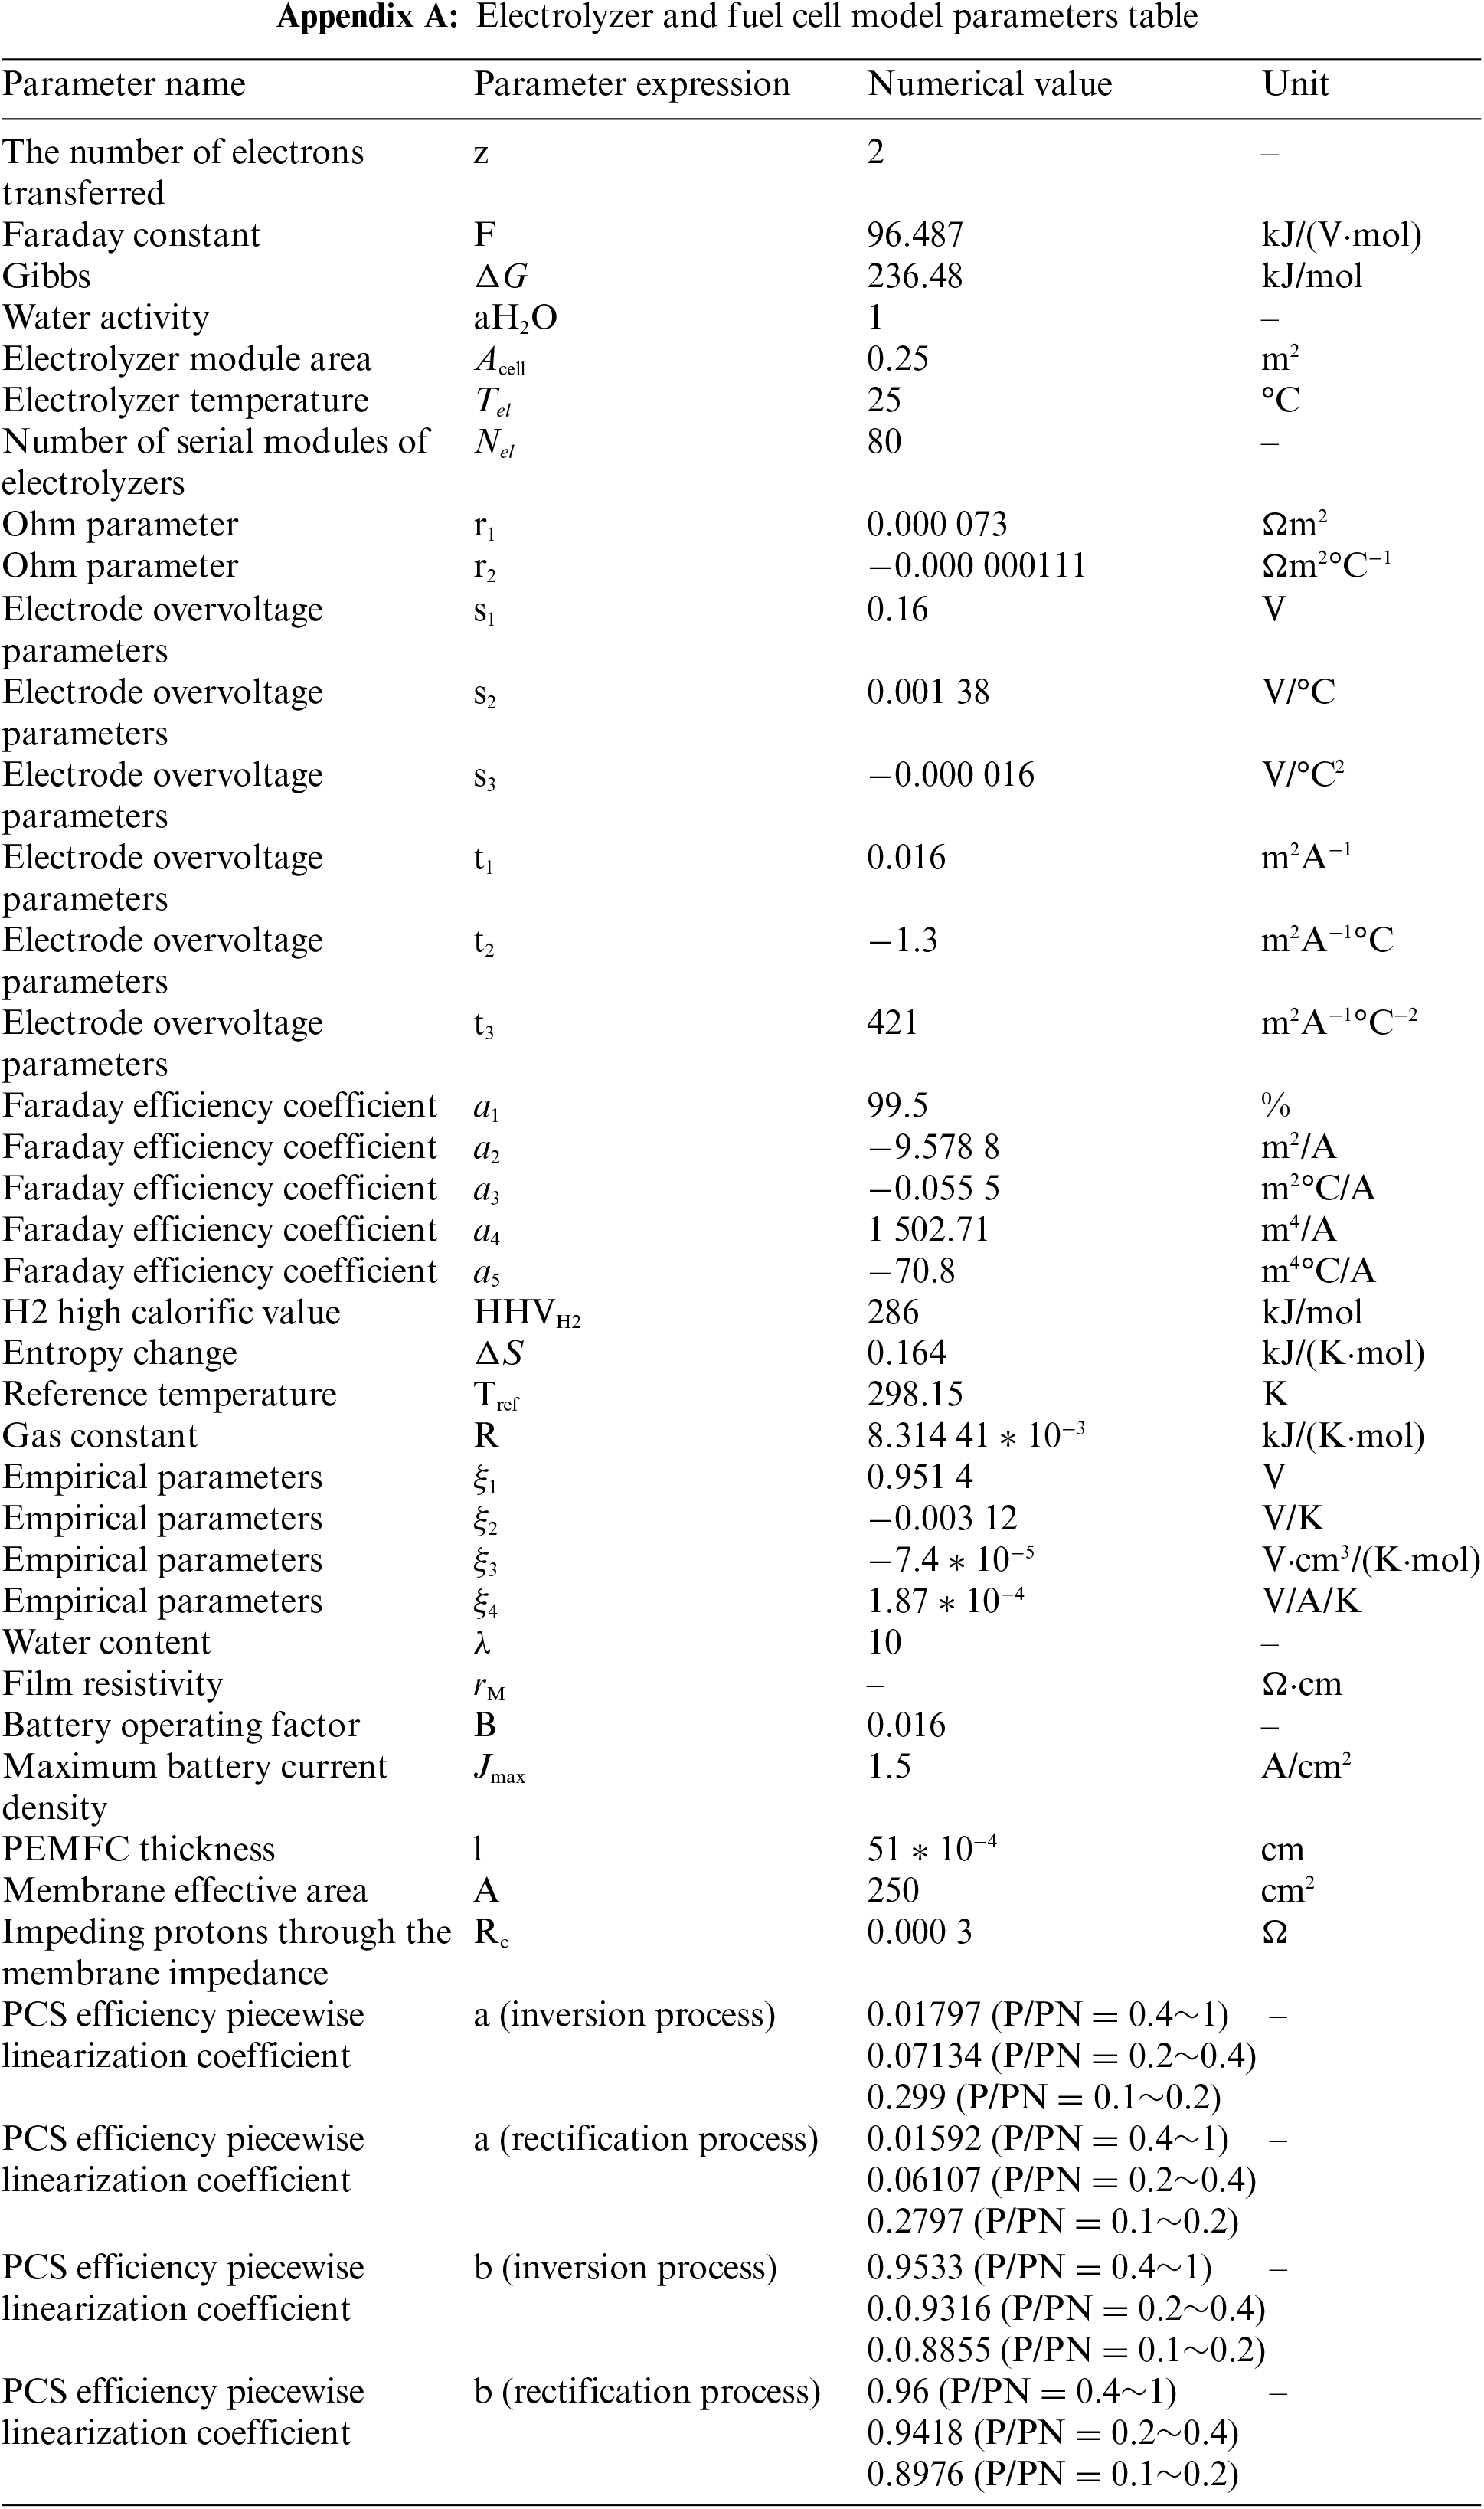
According to the equivalent circuit and mathematical model, a simulation model is built through MATLAB/Simulink [35], as shown in Fig. 4. Refer to Appendix A for each model parameter. In order to reflect the characteristics of the electrolytic cell model, the voltage and current constraints during charging and discharging are not considered for the time being.
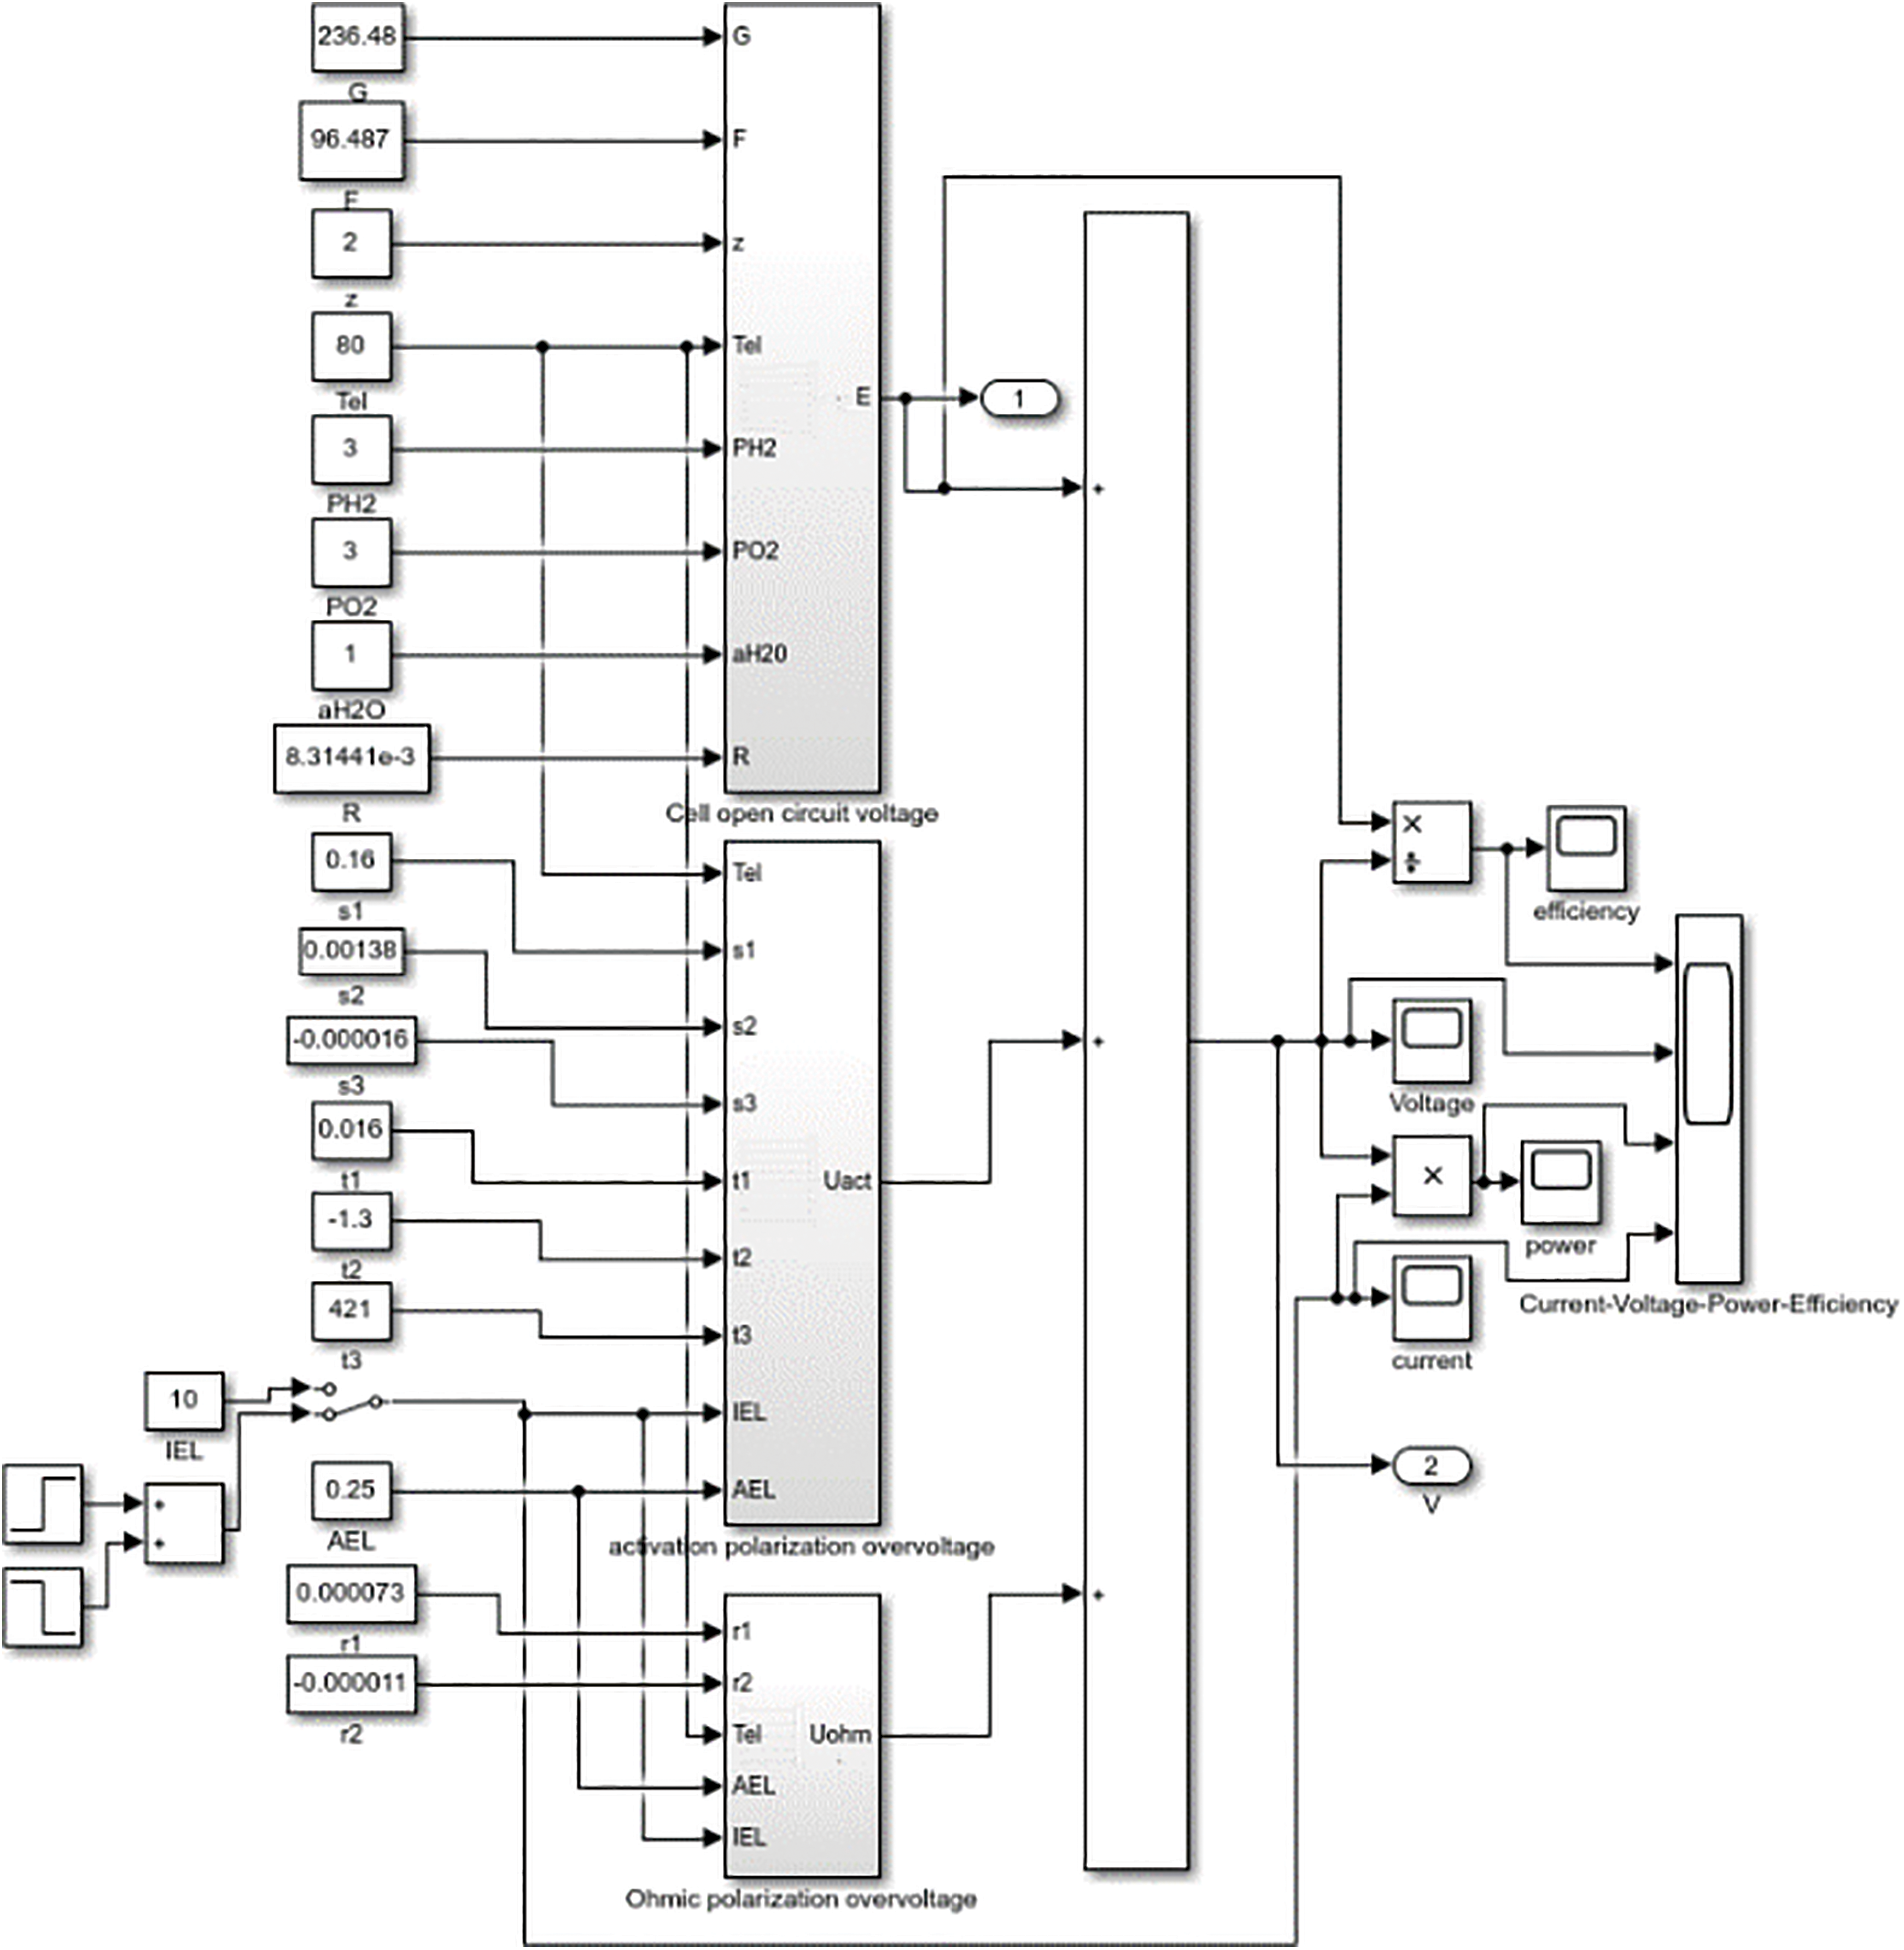
Figure 4: Electrolyzer simulation model
2) Equivalent circuit model of fuel cell
Since a series of physical and chemical changes will occur on the positive and negative electrodes of the fuel cell during operation, each process will generate a certain resistance. In order to make the reaction on the electrodes continue to occur, it needs to consume its own energy to overcome the resistance. During this process, the electrode potential shift phenomenon will occur, and the losses generated during the reaction include activation polarization voltage, ohmic polarization voltage and concentration overvoltage. The corresponding fuel cell equivalent circuit model [36] is shown in Fig. 5.
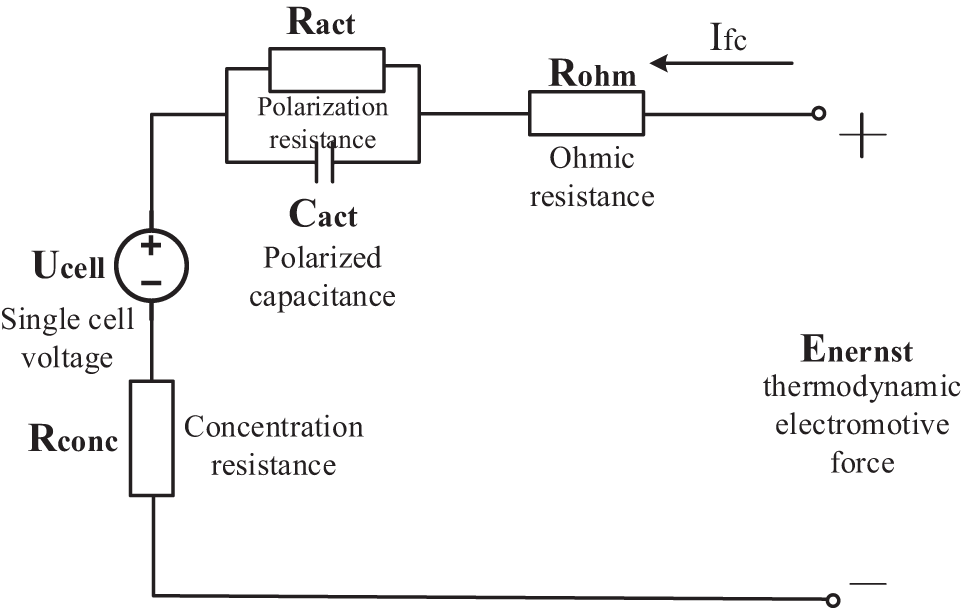
Figure 5: Equivalent circuit diagram of single fuel cell
The fuel cell simulation model structure [37] is shown in Fig. 6. The fuel cell reaction is equivalent to the discharge process in the entire hydrogen storage system, where the thermodynamic electromotive force is equivalent to the internal voltage of the fuel cell, and
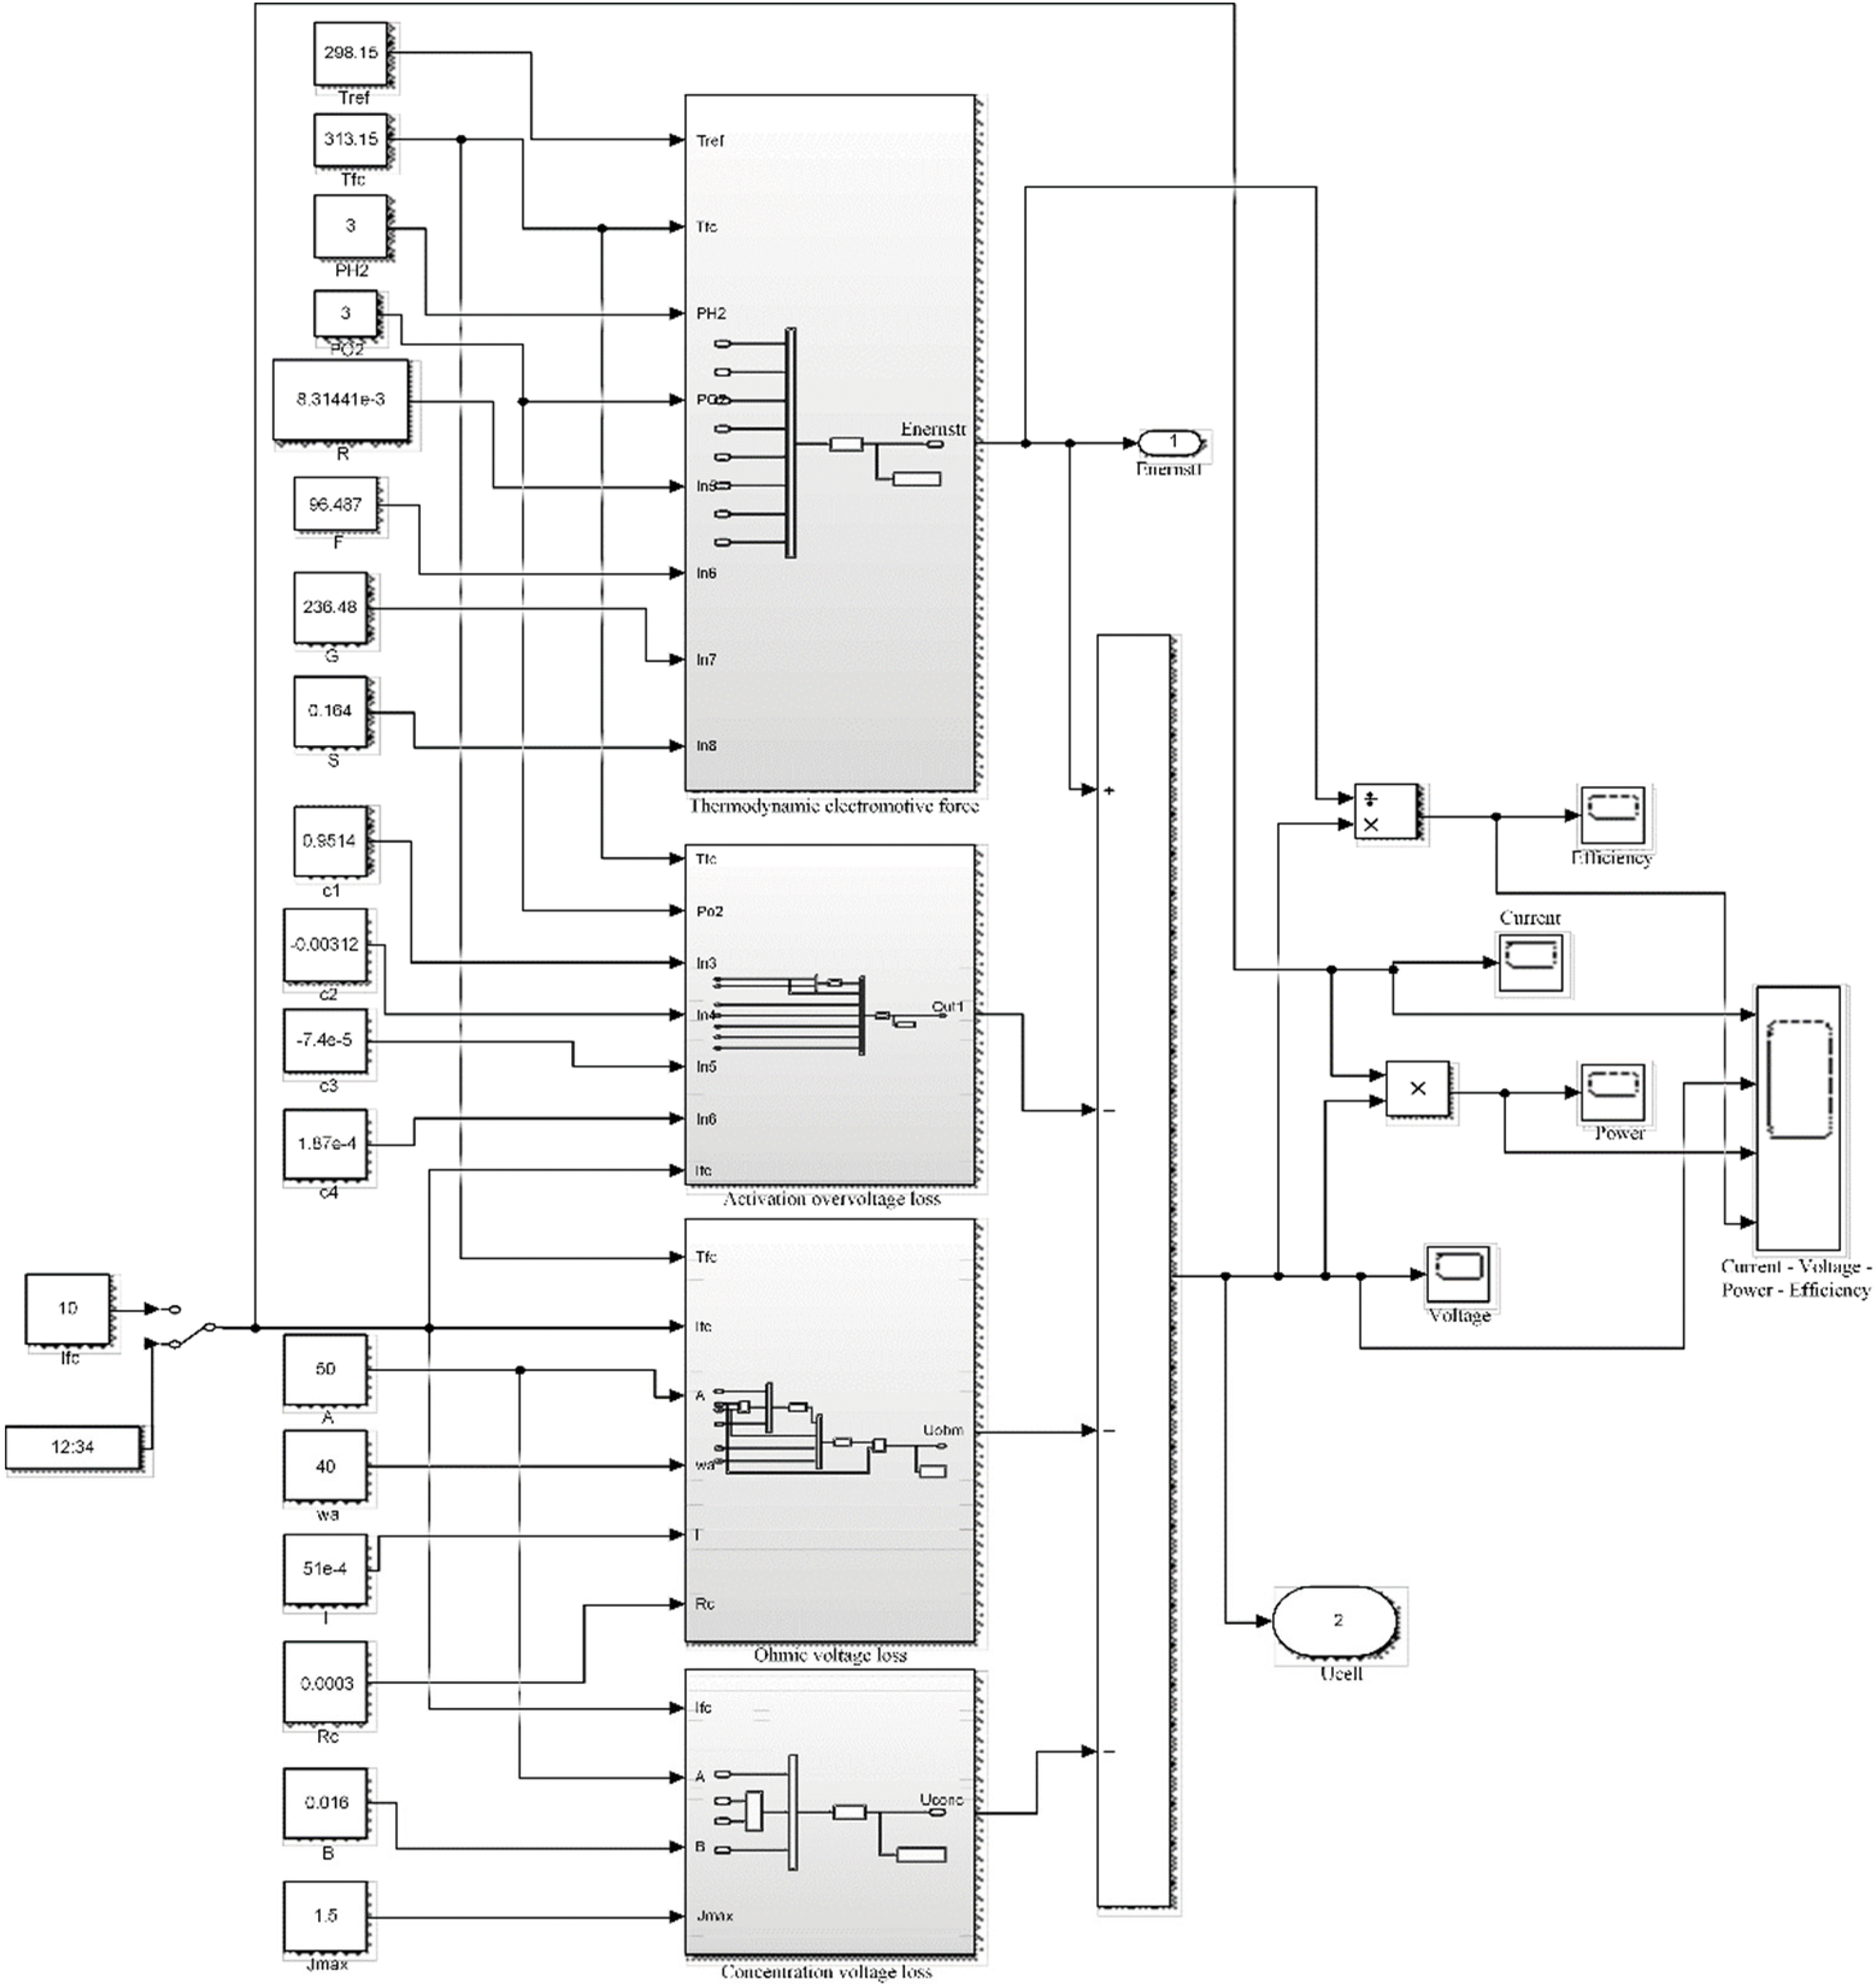
Figure 6: Fuel cell simulation structure diagram
In order to verify the validity of the model established in this paper, some parameters are set as shown in Appendix A [38]. Combined with the simulation model of the PEM electrolyzer and Proton exchange membrane fuel cell built in Simulink, the variation of the voltage of the electrolyzer and the fuel cell with the current is obtained. Figs. 7 and 8 respectively show the variation of the input voltage of the electrolyzer and the output voltage of the fuel cell with current and the typical polarization curves of the above-mentioned electrolyzer and fuel cell. It can be seen from the figure that the variation trend of the voltage and current of the electrolyzer and the fuel cell model constructed in this paper and the typical polarization curves of the two, which shows the correctness and effectiveness of the simulation model established in this paper.
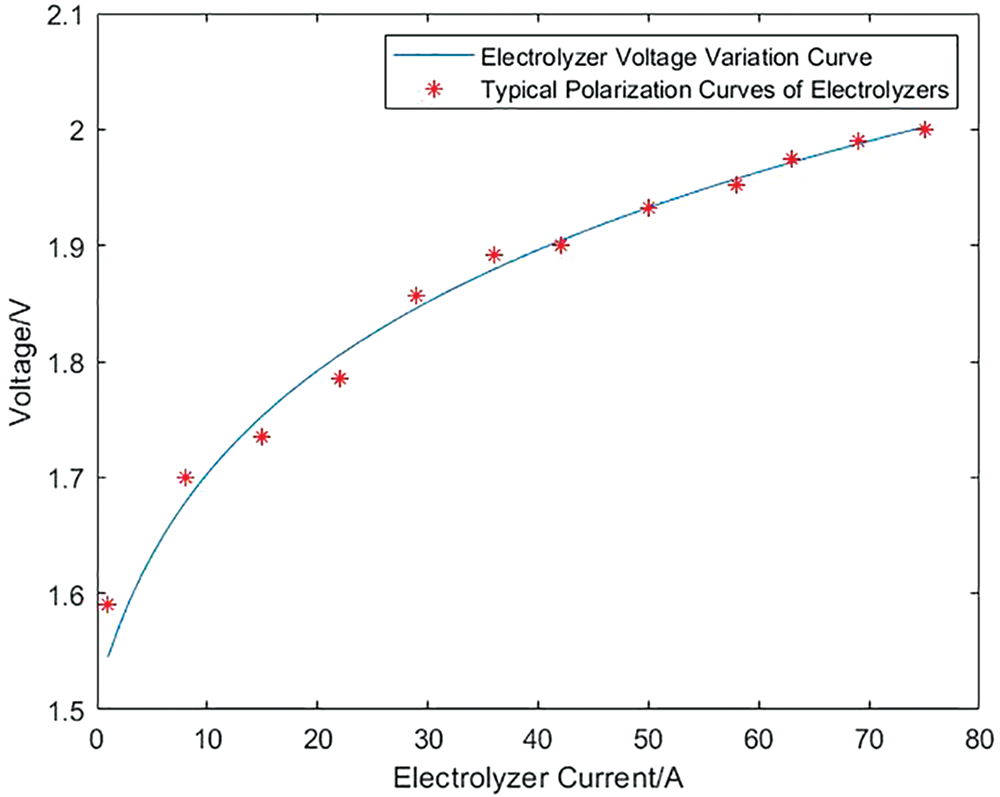
Figure 7: Comparison between the input voltage and current curve of the electrolyzer and the typical polarization curve
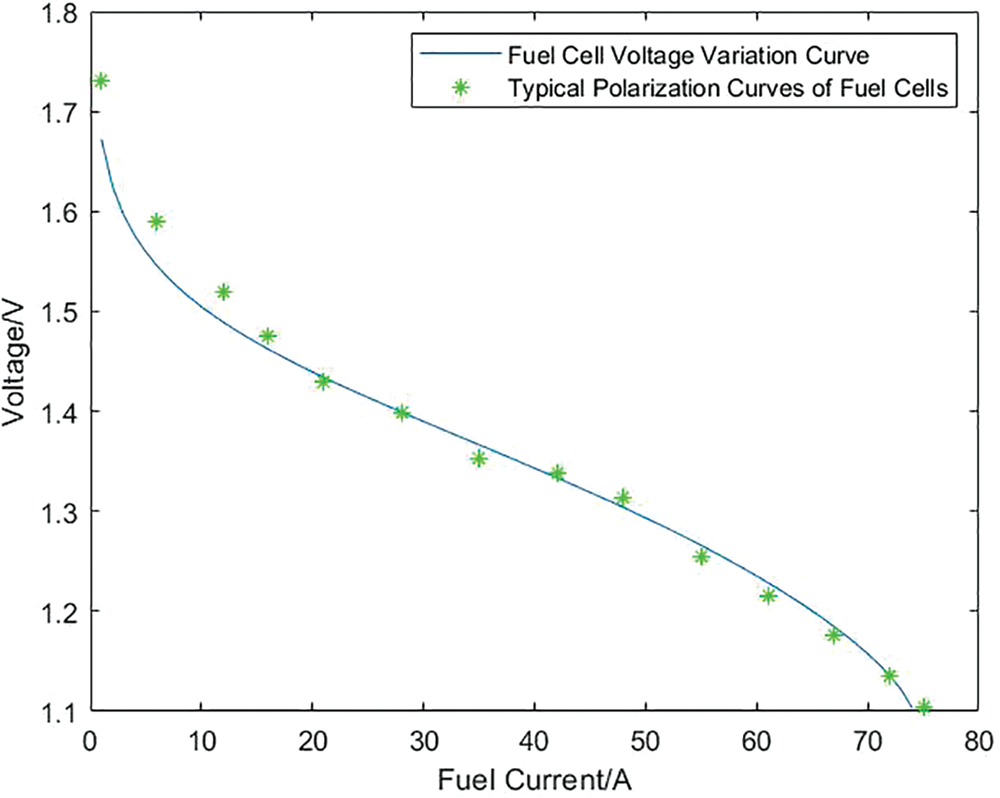
Figure 8: Comparison of output voltage vs. current curve of fuel cell and typical polarization curve
4.1 Analysis of the Influence of Hydrogen Storage Unit Efficiency
In order to analyze the influence of temperature and partial gas pressure of each part of the hydrogen storage unit on the charging and discharging efficiency of the hydrogen storage unit, the hydrogen storage unit is charged and discharged under the constant current of 10, 30, 50 and 70 A, that is, the current density is 0.04, 0.12, 0.2 and 0.28 A/cm2. Figs. 9 and 10 show the variation curves of hydrogen storage unit charge-discharge efficiency with operating temperature and gas partial pressure under each constant current density charge-discharge state.
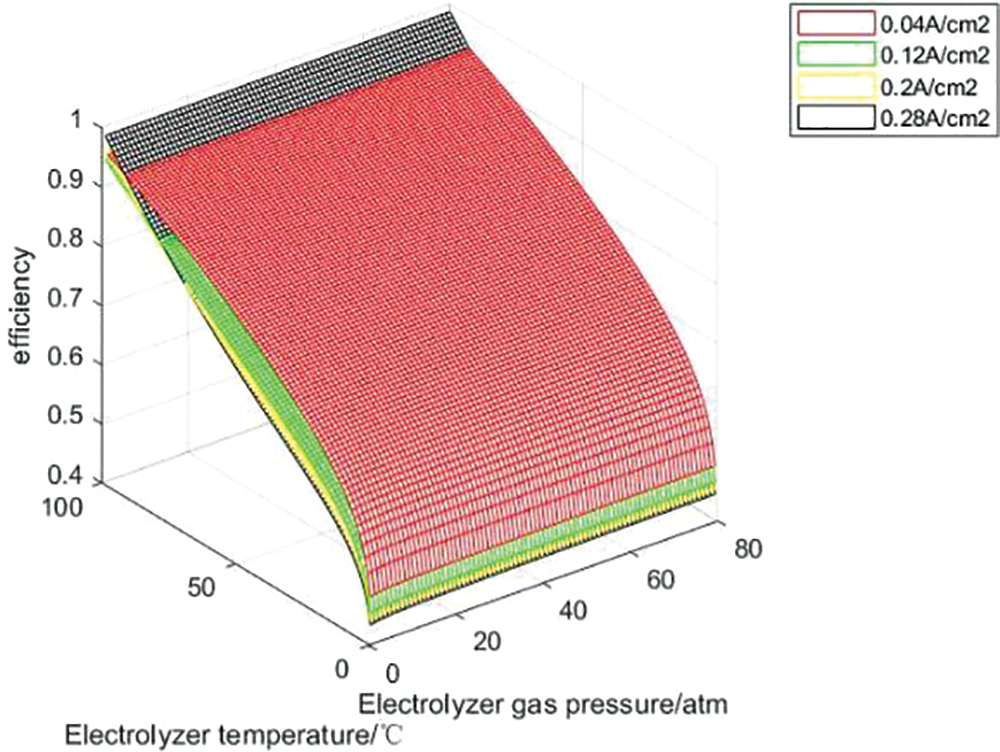
Figure 9: Charge efficiency curves at constant current density
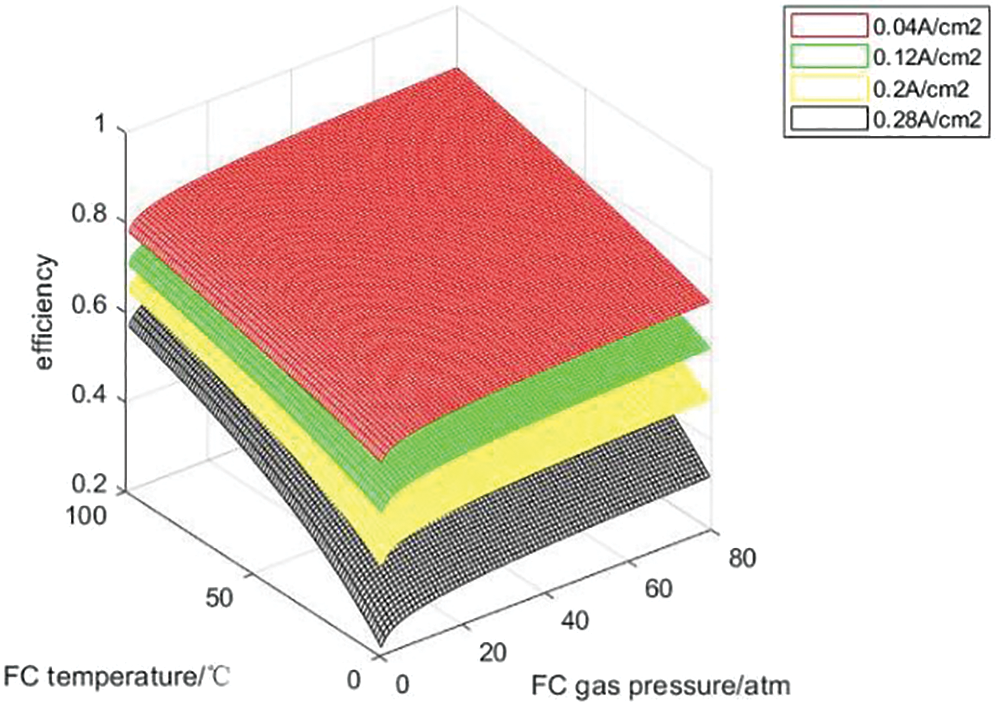
Figure 10: Discharge efficiency curves under constant current density
It can be seen from Figs. 9 and 10 that under the condition of constant current density and constant gas partial pressure, the charge discharge efficiency of the hydrogen storage system increases with the increase of operating temperature, because the increase of temperature enhances the activity of the catalyst. When the system operating temperature and gas partial pressure are constant, the charging efficiency decreases with the increase of current density, because the increase of current leads to the increase of activation polarization overvoltage and ohmic polarization overvoltage in the electrolytic cell reaction, which leads to the decrease of efficiency; The discharge efficiency decreases with the increase of current density because the increase of current leads to the increase of activation over-voltage, ohmic over-voltage and concentration over-voltage during the fuel cell reaction process, which reduces the efficiency. At constant operating temperature and current density, with the increase of H2 and O2 partial pressure, the charging and discharging efficiency of the hydrogen storage system will increase, but the range is not large. Because changing the gas partial pressure will only affect the open circuit voltage of the electrolytic cell and the thermodynamic electromotive force and activation overvoltage of the fuel cell, H2 and O2 partial pressure have little effect on the charging and discharging efficiency. With the increase of current, the voltage loss of electrolytic cell and fuel cell will increase, thus reducing the charge discharge efficiency. Theoretically, within the upper and lower limits of the current temperature and gas partial pressure settings, the optimal charging and discharging efficiency of the hydrogen storage unit can be 98.5% and 86.16%, respectively.
The PCS converter efficiency is strongly related to the output power of the large-scale hydrogen storage system. When considering the influence of the internal characteristics of the hydrogen storage system on the system charge and discharge efficiency, changes in the internal temperature and pressure of the system will also affect the power and lead to changes in the PCS efficiency. Figs. 11 and 12 describe the influence curves of temperature and pressure on PCS efficiency in the rectification process and the inversion process, respectively.
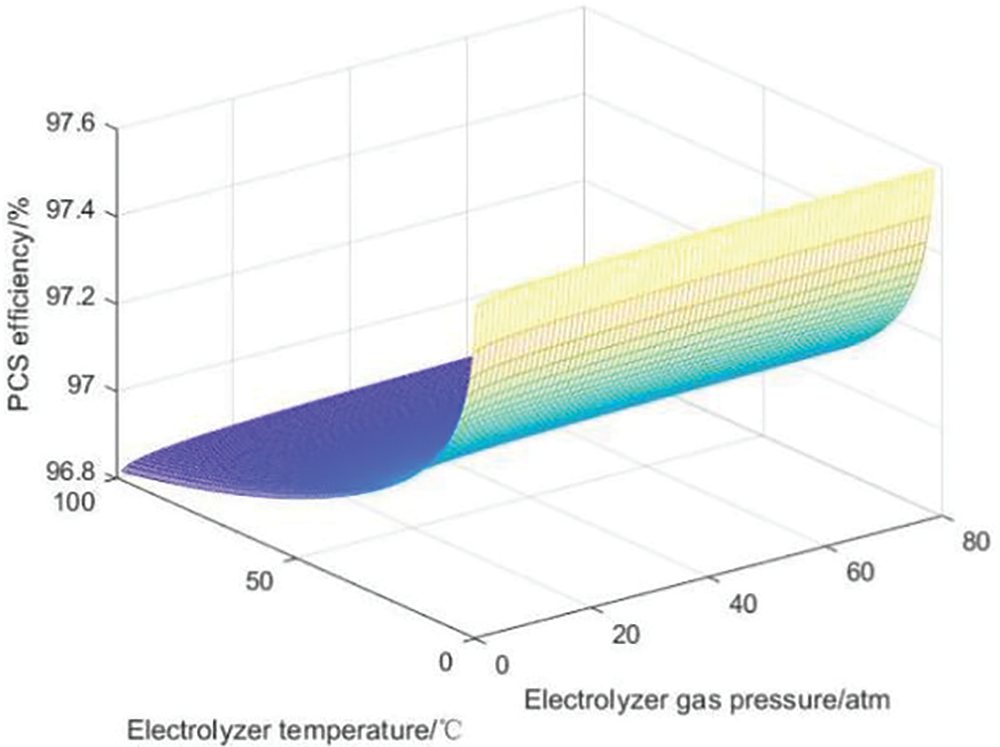
Figure 11: Influence curve of PCS efficiency in rectification process
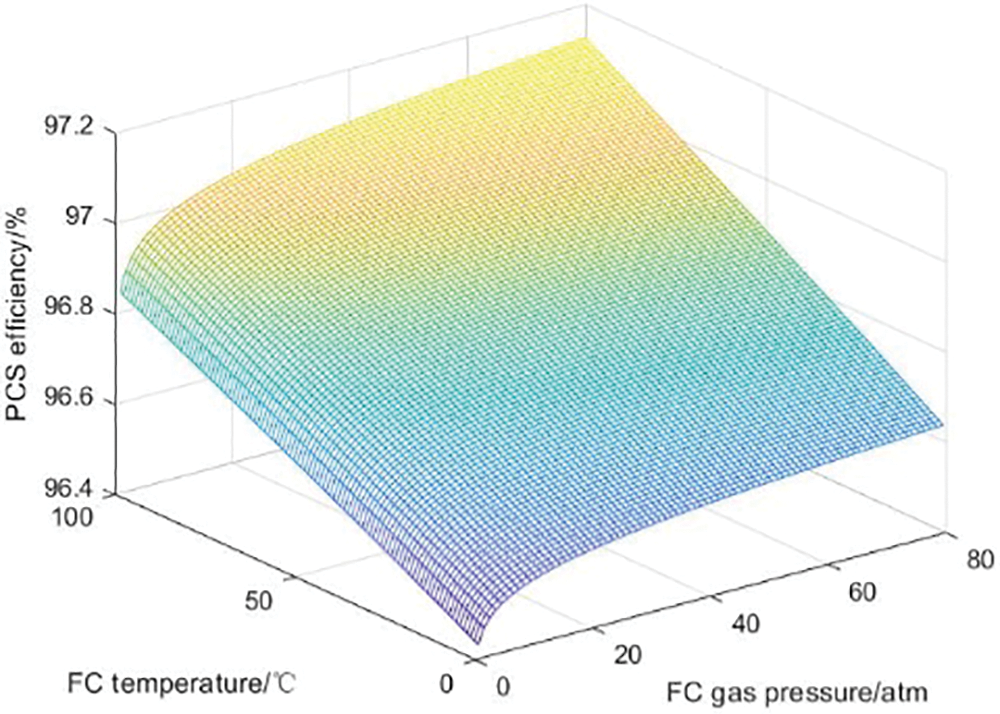
Figure 12: Inverting process PCS efficiency influence curve system
In the rectification stage of the PCS converter, as the temperature increases, the efficiency of the PCS converter will decrease, while the pressure has little effect on it. This is because during the rectification operation, power flows to the PCS converter, causing high current and low voltage, resulting in poor heat dissipation conditions inside the converter. However, an increase in temperature will further reduce the heat dissipation effect, thus negatively affecting the rectification efficiency.
In the inverter operation of the PCS converter, the PCS efficiency increases with increasing temperature and slightly increases with increasing pressure. This is because during the operation of the inverter, power is output from the PCS, and at this time, the current is low and the voltage is high, making the requirements for heat dissipation relatively low. At the same time, a high-temperature environment is beneficial for improving the performance of certain components, thereby improving inverter efficiency. The reason why the impact of pressure on efficiency is relatively small may be due to the small impact of pressure changes on the working state of circuit components.
4.2 Analysis of the Influence of Hydrogen Storage Efficiency
In this paper, it is assumed that the capacity of the hydrogen storage tank is infinite, and the upper limit of the capacity decay rate is set to limit the quality of hydrogen that the hydrogen storage tank can hold. Since the partial pressure of the gas has little effect on the hydrogen storage unit, it is assumed that the partial pressure of the gas and the pressure in the tank are constant at 3 atm, the number of cycles of the hydrogen storage system is 2000 times, and the working environment is set to a constant temperature of 25°C. At this time, the capacity loss of the electrolyzer and the fuel cell increases with the increase of the internal working temperature, and the change curve of the capacity loss with temperature is shown in Fig. 13.
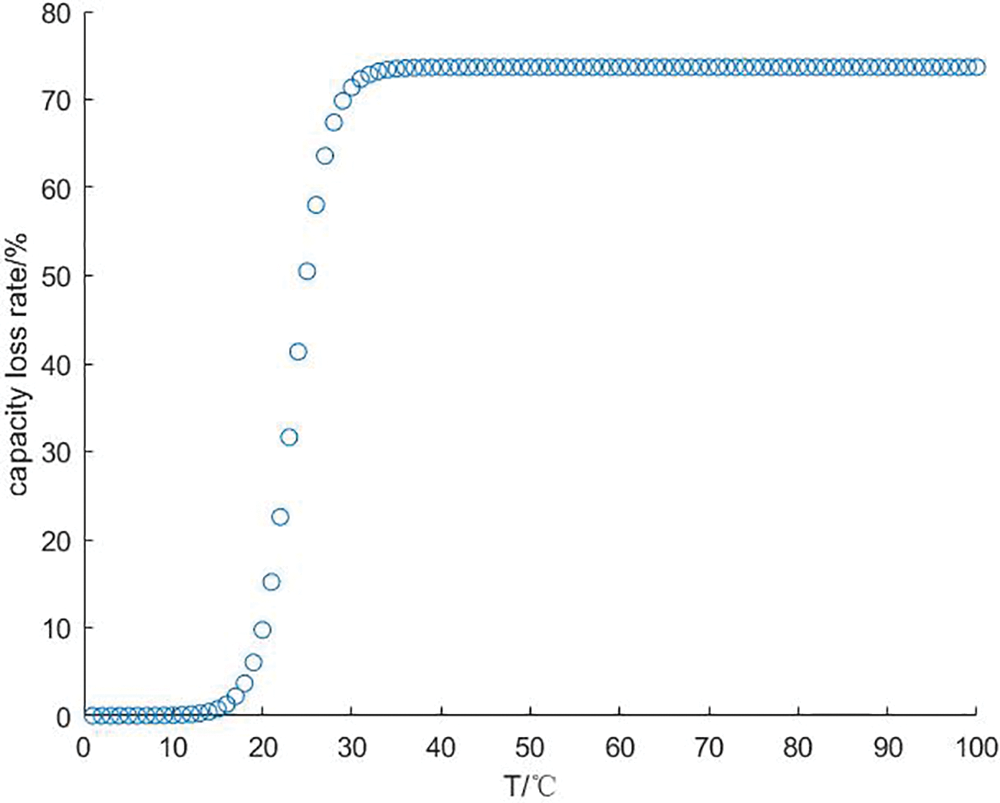
Figure 13: Capacity loss vs. temperature curve
Theoretically, if the temperature is kept at a high level, higher charge-discharge efficiency can be obtained, but in the actual production process, the capacity of the electrolyzer and fuel cell will decrease with the increase of temperature and the number of cycles. In order to be more practical, different upper limits of capacity decay are set for the hydrogen storage unit, as shown in Table 1, combined with the charge-discharge efficiency of the hydrogen storage unit and the influence curve of the PCS efficiency, and the Cplex solver is used to obtain the optimal value of the efficiency of the hydrogen storage system and the corresponding operating temperature.
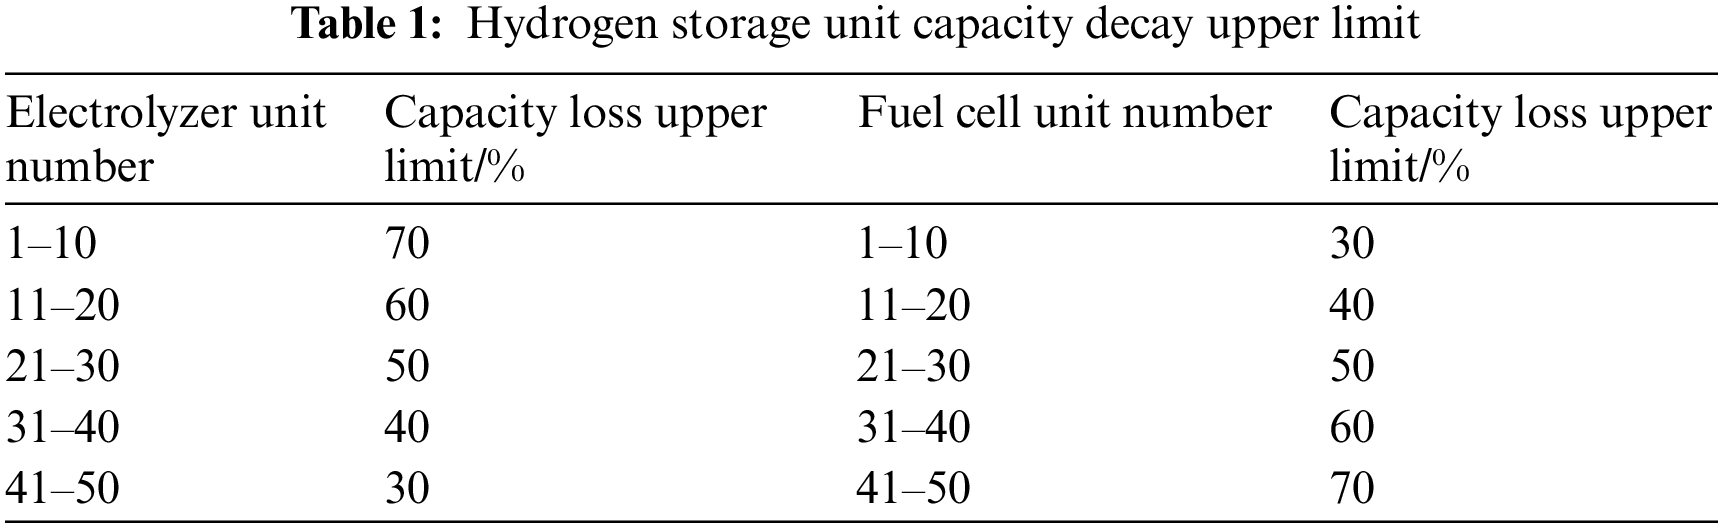
It can be seen from Section 4.1 that the higher the working temperature of each unit electrolyzer and fuel cell, the higher the charge and discharge efficiency of the corresponding unit. Through calculation, it can be seen from Figs. 14 and 15 that after considering the capacity loss of the hydrogen storage unit, in the large-scale hydrogen storage system, each unit electrolyzer and fuel cell can no longer maintain the upper temperature limit. Through the solution, it is concluded that the optimal charging efficiency of the internal system of the hydrogen storage system is 63.46%, the PCS efficiency of the charging process is 97.57%, and the total charging efficiency of the system is 61.92%. The capacity loss of each unit is maintained within a controllable range, and the total system loss is 50%; The temperature range of a single fuel cell unit is between 22.9°C and 29.1°C, and it decreases with the decrease of the upper limit of capacity loss. Correspondingly, the optimal internal discharge efficiency of the hydrogen storage system is 68.34%, and the PCS efficiency during the discharge process is 97.09%. The total discharge efficiency of the system is 66.34%, and the total system capacity loss is 49.9%.
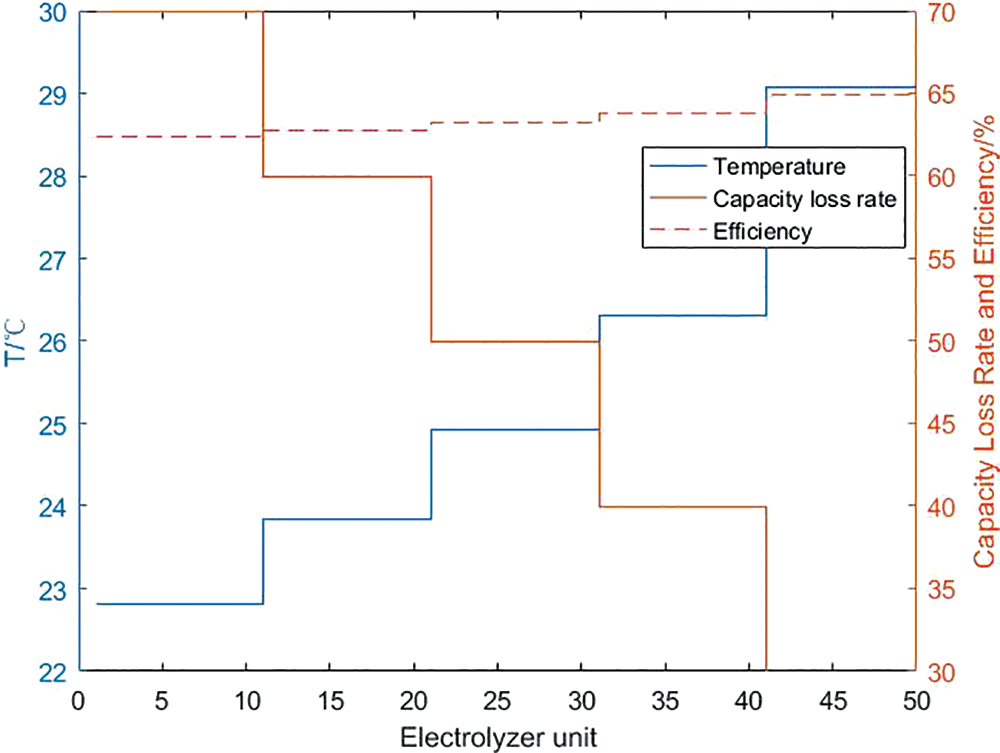
Figure 14: Calculation result of charging efficiency of hydrogen storage system
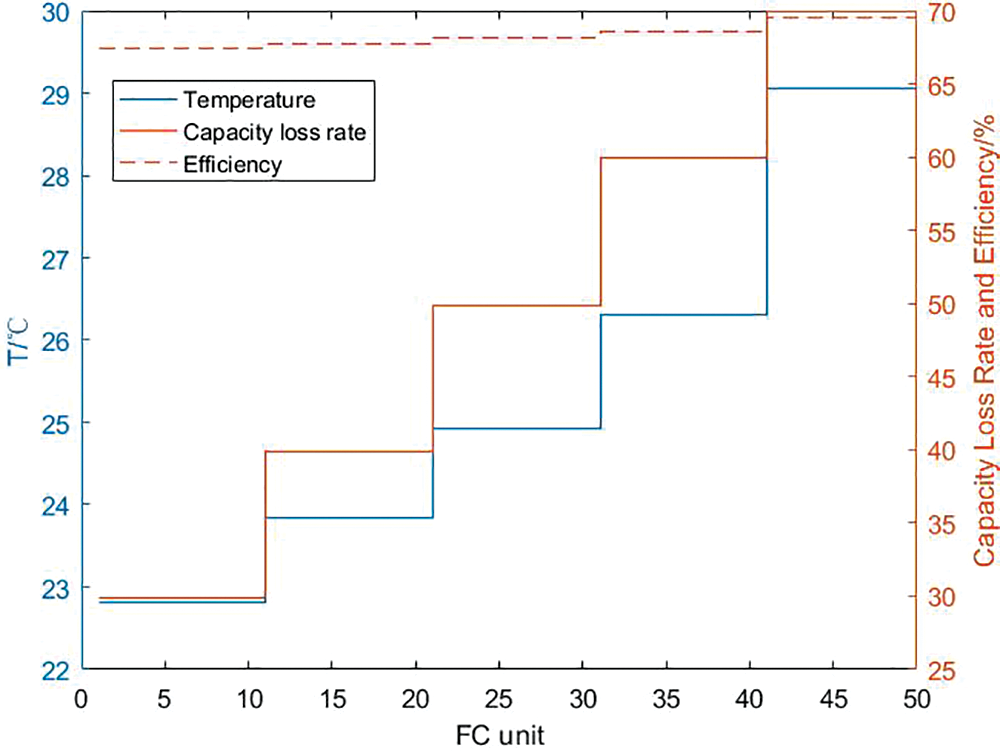
Figure 15: Calculation result of discharge efficiency of hydrogen storage system
In this paper, firstly, the attenuation characteristics of the battery are considered, and the simulation model of each part of the large-scale hydrogen storage system is systematically constructed in detail. Secondly, the steady-state simulation model of each component of the hydrogen storage unit is constructed, as well as the charge-discharge efficiency model and PCS efficiency model considering the temperature of the hydrogen storage system and the internal gas partial pressure. Through the simulation and modeling of the hydrogen storage system in MATLAB/Simulink, the efficiency characteristics of the hydrogen storage system and hydrogen storage unit are analyzed. With the goal of optimizing the efficiency of the large-scale hydrogen storage system, the results obtained by using the Cplex solver are as follows:
(1) The overall efficiency of a large-scale hydrogen storage system is affected by the internal characteristics of each hydrogen storage unit that makes up the system, including charging and discharging current, operating temperature, gas partial pressure and hydrogen storage tank capacity attenuation, as well as the efficiency of the PCS converter during AC/DC conversion with the outside world.
(2) Properly increasing the internal working temperature of the hydrogen storage unit can improve the charging and discharging efficiency of the system and the PCS efficiency during inverter operation, but will reduce the PCS efficiency during rectifier operation; Increasing H2 and O2 partial pressure can increase the efficiency of the hydrogen storage unit and PCS, but the increase is small, indicating that the pressure has little effect on the efficiency of the hydrogen storage system. The efficiency of the hydrogen storage unit will increase with the increase of charge-discharge current.
(3) The overall efficiency of the large-scale hydrogen storage system is linear with the system loss and working temperature. The capacity decay rate of the hydrogen storage tank increases with the temperature and changes fastest between 20°C and 30°C. Although the high working temperature will affect the capacity attenuation of the system, it will increase the charging and discharging efficiency. Under the above conditions, the optimal total charging efficiency of the system is 63.46%, and the total discharge efficiency is 66.34%.
To sum up the actual situation, in order to obtain appropriate charging and discharging efficiency and ensure that the system capacity loss is within a certain range, it is necessary to reasonably design the parameters.
Acknowledgement: The authors acknowledge the reviewers for providing valuable comments and helpful suggestions to improve the manuscript.
Funding Statement: This work was supported by the Jilin Province Higher Education Teaching Reform Research Project Funding (Contract No. 2020285O73B005E).
Author Contributions: The authors confirm their contribution to the paper as follows: study conception: Junhui Li; design, data collection: Haotian Zhang; analysis and interpretation of results: Cuiping Li and Xingxu Zhu; draft manuscript preparation: Ruitong Liu, Fangwei Duan and Yongming Peng. All authors reviewed the results and approved the final version of the manuscript.
Availability of Data and Materials: All data generated or analysed during this study are included in this published article.
Conflicts of Interest: The authors declare that they have no conflicts of interest to report regarding the present study.
References
1. Development and Reform Commission (2021). Guiding opinions of the national development and reform commission and the energy administration on accelerating the development of new energy storage. Bulletin of the State Council of the People’s Republic of China, pp. 43–46. [Google Scholar]
2. Li, J. H., Zhang, J. H., Mu, G., Ge, Y. F., Yan, G. G. et al. (2019). Hierarchical optimal scheduling for deep peak shaving of energy storage-assisted thermal power units. Power Grid Technology, 43(11), 3961–3970. [Google Scholar]
3. Li, J. H., Jiao, J., Yan, G. G., Mu, G., Gao, C. L. et al. (2013). Simulation study on the third-order dynamic model of lead-acid battery. Journal of Northeast Electric Power University, 33(1), 103–108. [Google Scholar]
4. He, H. J., Zhang, N., Du, E. S., Ge, Y., Kang, C. Q. (2020). A review of the operation efficiency and life decay modeling methods of large-scale electrochemical energy storage on the grid side. Automation of Electric Power Systems, 44(12), 193–207. [Google Scholar]
5. Feng, J. Q., Si, Y. W., Wu, L., Huang, K. F., Zhang, X. (2020). Characteristic analysis of power battery based on dynamic comprehensive equivalent circuit model. Energy Storage Science and Technology, 9(3), 986–992. [Google Scholar]
6. Li, J. H., Hu, D. C., Mu, G., Wang, S., Zhang, Z. S. et al. (2020). Optimal control strategy for large-scale VRB energy storage auxiliary power system in peak shaving. International Journal of Electrical Power & Energy Systems, 120, 106007. [Google Scholar]
7. Liu, Y. (2021). Power distribution strategy of electrochemical energy storage power station participating in secondary frequency regulation of power system (Master Thesis). Northeast Electric Power University, China. [Google Scholar]
8. Liu, D. B., Yuan, Y., Li, S. C., Cao, H. J., Jin, Z. T. et al. (2022). A review of capacity allocation in systems with renewable energy using hydrogen energy storage. Electrical Measurement and Instrumentation, 59(12), 1–13. [Google Scholar]
9. Qin, M. Z., Zhang, G. Y., Qi, D. L. (2016). Modeling and simulation of wind power-hydrogen energy coupling system. Electronic Technology, 45(8), 18–23. [Google Scholar]
10. Ren, Z. Y., Luo, X., Qin, H. L., Jiang, Y. P., Yang, Z. X. et al. (2022). Mid- and long-term optimal operation of a hydrogen-containing regional integrated energy system considering the physical properties of hydrogen storage. Power Grid Technology, 46(9), 3324–3333. [Google Scholar]
11. Gu, T., Yuan, Y. (2021). Simulation modeling and analysis of proton exchange membrane fuel cells. Power Technology, 45(4), 459–462. [Google Scholar]
12. Farrukh, K., Ibrahim, D., Marc, A. R. (2016). Analysis and assessment of an integrated hydrogen energy system. International Journal of Hydrogen Energy, 41(19), 7960–7967. [Google Scholar]
13. Cai, L. D., Li, Q., Liu, Q., Wang, T. H., Yang, W. et al. (2022). An optimal control method for multi-stack fuel cells considering system hydrogen consumption and durability. Chinese Journal of Electrical Engineering, 42(10), 3670–3680. [Google Scholar]
14. Cai, G. W., Kong, L. G. (2016). PEMFC grid-connected power generation system modeling and optimal control. China Electric Power, 49(11), 75–81. [Google Scholar]
15. Cai, G. W., Bian, Y. D., Kong, L. G., Song, J., Xu, H. (2020). Homogeneous modeling of wind/light hydrogen production system. China Electric Power, 53(10), 59–65. [Google Scholar]
16. Amir, R. R., Seyed, M. A., Mohammad, H. N., Ehsanolah, A., Mahdi, S. (2022). A green hydrogen energy storage concept based on parabolic trough collector and proton exchange membrane lectrolyzer/fuel cell: Thermodynamic and exergoeconomic analyses with multi-objective optimization. International Journal of Hydrogen Energy, 47(62), 26468–26489. [Google Scholar]
17. Seyed, M. A., Amir, R. R., Ahmad, A. (2021). Comprehensive assessment and multi-objective optimization of a green concept based on a combination of hydrogen and compressed air energy storage (CAES) systems. Renewable and Sustainable Energy Reviews, 142, 1364–0321. [Google Scholar]
18. Rama, C. M., Paresh, K. (2022). Silicon nanostructures for solid-state hydrogen storage: A review. International Journal of Hydrogen Energy, 48(4), 1401–1439. [Google Scholar]
19. Zhao, X. Y., Chen, H., Zheng, Q. W., Liu, J., Pan, P. Y. et al. (2022). Thermo-economic analysis of a novel hydrogen production system using medical waste and biogas with zero carbon emission. Energy, 265, 126333. [Google Scholar]
20. Mohamed, N., Hamdy, H. (2022). Assessment of hydrogen production from waste heat using hybrid systems of Rankine cycle with proton exchange membrane/solid oxide electrolyzer. International Journal of Hydrogen Energy, 48(20), 0360–3199. [Google Scholar]
21. Liang, Y. F., Liang, Q. C., Zhao, J. F., He, J. N. (2022). Downgrade power allocation for multi-fuel cell system (MFCS) based on minimum hydrogen consumption. Energy Reports, 8, 15574–15583. [Google Scholar]
22. Liu, Y. L., Zheng, J. Y., Xu, P., Zhao, Y. Z., Chen, H. G. (2008). Numerical simulation of the effect of ambient temperature on leakage and diffusion of high-pressure hydrogen storage tanks. Journal of Engineering Thermophysics, 5, 770–772. [Google Scholar]
23. Li, P. G., Qiu, D. K., Shen, S. Y., Peng, L. F. (2021). Research on performance degradation of integrated regenerative fuel cell. Power Technology, 45(6), 749–752+796. [Google Scholar]
24. Zhu, D., Chabane, D., Ait-Amirat, Y., N’Diaye, A., Djerdir, A. (2017). Estimation of the state of charge of a hydride hydrogen tank for vehicle applications. 2017 IEEE Vehicle Power and Propulsion Conference (VPPC), pp. 1–6. New York, USA. [Google Scholar]
25. Xu, Z., Li, X. C., Jia, L. Z., Chen, B., Dai, Z. Q. et al. (2022). The influence of overcharge cycle on the capacity attenuation and safety of lithium-ion batteries. Energy Storage Science and Technology, 11(12), 3978–3986. [Google Scholar]
26. Zhao, J. N., Jin, Y., Wang, S. J., Guo, X. J. (2017). Temperature characteristics and capacity decay model of commercial Li4Ti5O12 batteries. Chinese Journal of Electrical Engineering, 37(17), 5069–5075+5226. [Google Scholar]
27. Yuan, T. J., Cao, J. L. (2022). Capacity optimization of wind-hydrogen low-carbon energy system considering wind power-load uncertainty. High Voltage Technology, 48(6), 2037–2044. [Google Scholar]
28. Cai, Q. Q., Xiao, Y., Zhu, Y. Q. (2021). A day-ahead economic coordination dispatching model of electric heating microgrid considering electricity-to-hydrogen and fuel cells. Electric Power Automation Equipment, 41(10), 107–112+161. [Google Scholar]
29. Li, Z., Zhang, R., Sun, H. X., Zhang, W. D., Mei, C. X. (2022). A review of key technologies for renewable energy multi-energy complementary production-storage-hydrogen transport. Journal of Electrotechnical Technology, 36(3), 446–462. [Google Scholar]
30. Yan, G. G., Liu, Y., Duan, S. M., Li, H. B., Mu, G. et al. (2020). Power distribution strategy of battery energy storage unit group participating in secondary frequency regulation of power system. Automation of Electric Power Systems, 44(14), 26–34. [Google Scholar]
31. Zhang, C. Z. (2009). Modeling and simulation research of solar water electrolysis hydrogen production system (Master Thesis). Southwest Jiaotong University, China. [Google Scholar]
32. L, Q. (2011). Research on the modeling and control method of proton exchange membrane fuel cell system (Ph.D. Thesis). Southwest Jiaotong University, China. [Google Scholar]
33. Cai, G. W., Chen, C., Kong, L. G., Peng, L., Li, Z. X. (2018). Control strategy of wind hydrogen coupling combined network system. Journal of Solar Energy, 39(10), 2970–2980. [Google Scholar]
34. Wu, J., Yin, Z., Li, H., Zhao, B., Ji, Q. et al. (2021). High-frequency equivalent circuit model of lithium-ion battery based on fractional order theory. Journal of Electrotechnical Technology, 36(18), 3902–3910. [Google Scholar]
35. Mi, L. X. (2021). Study on the electrolysis characteristics of wind power electrolysis water hydrogen production system (Master Thesis). Xinjiang Agricultural University, China. [Google Scholar]
36. Yang, X. B., Zheng, Y. J., Gao, W. K., Ren, D. S., Han, X. B. et al. (2021). Power state estimation of high specific energy energy storage lithium battery system based on improved equivalent circuit model. Power Grid Technology, 45(1), 57–66. [Google Scholar]
37. Liu, X. R., Jiang, Y., Zhang, X. X., Chen, W. R. (2021). A review of three-dimensional numerical simulation of proton exchange membrane fuel cells. Chinese Journal of Electrical Engineering, 41(21), 7352–7370. [Google Scholar]
38. Kong, L. G., Cai, G. W., Chen, C., Xing, L. (2017). Modeling and grid connection control of active permanent magnet direct drive wind turbine based on hydrogen energy storage. Journal of Electrotechnical Engineering, 32(18), 276–285. [Google Scholar]
Appendix A
Cite This Article
 Copyright © 2024 The Author(s). Published by Tech Science Press.
This work is licensed under a Creative Commons Attribution 4.0 International License , which permits unrestricted use, distribution, and reproduction in any medium, provided the original work is properly cited.
 Downloads
 Citation Tools