
 Submit a Paper
 Propose a Special lssue
 Open Access
ARTICLE

Experimental Evaluation of Compressive Strength and Gas Permeability of Glass-Powder-Containing Mortar
School of Civil Engineering, Architecture and Environment, Hubei University of Technology, Wuhan, 430068, China
* Corresponding Author: Wei Chen. Email:
(This article belongs to the Special Issue: Advances in Solid Waste Processing and Recycling Technologies for Civil Engineering Materials)
Fluid Dynamics & Materials Processing 2023, 19(10), 2639-2659. https://doi.org/10.32604/fdmp.2023.027622
Received 06 November 2022; Accepted 14 March 2023; Issue published 25 June 2023
 View Full Text
 Download PDF
Abstract
Glass powder of various particle sizes (2, 5, 10 and 15 μm) has been assessed as a possible cement substitute for mortars. Different replacement rates of cement (5%, 10%, 15%, and 20%) have been considered for all particle sizes. The accessible porosity, compressive strength, gas permeability and microstructure have been investigated accordingly. The results have shown that adding glass powder up to 20% has a significantly negative effect on the porosity and compressive strength of mortar. The compressive strength initially rises with a 5% replacement and then decreases. Similarly, the gas permeability of the mortar displays a non-monotonic behavior; first, it decreases and then it grows with an increase in the glass powder content and particle size. The porosity and gas permeability attain a minimum for a 5% content and 10 μm particle size. Application of a Nuclear magnetic resonance (NMR) technique has revealed that incorporating waste glass powder with a certain fineness can reduce the pore size and the number of pores of the mortar. Compared with the control mortar, the pore volume of the waste glass mortar with 5% and 10 μm particle size is significantly reduced. When cement is partially replaced by glass powder with a particle size of 10 μm and a 5% percentage, the penetration resistance and compressive strength of the mortar are significantly improved.Keywords
Cement is one of the essential building materials and is utilized extensively in construction projects and other fields [1,2]. It is widely known that a significant portion of greenhouse gas emissions are caused by the manufacture of cement [3,4]. In 2020, the emissions from cement production was 4.1 billion tons, this corresponded to almost 9% of global CO2 emissions from burning of fossil fuels that year [5,6]. Many studies have focused on the potential of replacing cement in cement-based materials with recycled substance like glass powder, rice husk ash, fly ash, silica fume, and metakaolin [7–12]. As a typical building and industrial material, glass production and consumption are increasing yearly, and the waste glass produced is also increasing. Due to the chemical stability of waste glass, it is difficult to decompose, landfill disposal will occupy a lot of land [13,14], and the utilization rate is only about 10% [15]. Glass powder shows a potential for development because of its SiO2 content in amounts greater than 70%. Due to its large particulate surface area, portlandite can react with it. Micron-sized glass powder has been demonstrated to have a number of benefits, including pozzolanic activity, strong durability, good cementation, and minimal water absorption [16–19]. In addition, using 104 tons of glass powder instead of cement can save 1.93 × 10⁴ kW-h of electricity, reduce 800 tons of standard coal, and emit 21.11 × 10⁴ tons of CO2 and 27.8 tons of SO2 to the air less per year, etc. [20].
The ideal amount of glass powder replacement for cement and the size of its particles have a major impact on the mechanical properties of mortar and concrete. Jang et al. [21] found that TFT-LCD glass powder blended mortars demonstrated greater compressive strengths at up to 10% cement replacement level compared with mortar without glass powder. Due to the pozzolanic reaction, the microstructure of mortar containing glass powder was finer, with fewer and smaller pores. According to Calmon et al. [22], at the age of 28 days, the compressive strength of mortar with various replacement rates (0%, 5%, 10%, 15%, and 20% by weight) was lower than the control sample. At 270 days, the compressive strength of the mortars was roughly 6% higher than that of the control sample. Higher concentrations of Na2O (15.41%) and Al2O3 (6.07%) in glass powder created some delayed ettringite, which was the explanation for the decreases. Wang et al. [23] showed that the compressive strength did not significantly change even at a 25% cement replacement level. In contrast, Du et al. [18] found that, concrete containing glass powder showed a 12% improvement in compressive strength at a 60% cement replacement level after a year. Mirzahosseini et al. [24] showed that mortar containing glass powder with particle sizes less than 25 μm demonstrated around 30% higher compressive strength than other particle sizes (63–75 μm and 25–38 μm) at comparable cement replacement levels and curing ages. According to Lu et al. [25], the compressive strength of mortar containing glass powder of 28.3 μm was nearly 40% higher than that of 204 μm. Due to the stronger pozzolanic reaction and filler effect of the finer glass particles, some researchers noted that utilizing very fine glass powder (particle sizes 20 μm) in concrete and mortar increased compressive strength significantly [26–28]. However, Nassar et al. [29] reported that concrete containing glass powder of median particle size 13 μm showed 3% lower compressive strength than the control group.
Glass powder’s pozzolanic reaction was influenced by the type and color of the glass as well as its content and particle size [30–34]. The cement paste, pore structure, and interfacial transition zone made up the heterogeneous microstructure of the mortar and concrete. Enhancing these components improves their durability and mechanical properties. Reactive particles had a significant influence on the expansion induced by the alkali-silica reaction (ASR). Alkali and amorphous silica are both abundant in glass powder, and as a result, when utilized as an additional cementitious material, glass powder can promote the pozzolanic reaction or the development of expansive product [33–36]. The strength of mortar and concrete are significantly influenced by cement paste porosity, whereas low durability is indicated by high permeability and vice versa. According to several articles, the resistance to chloride attack mainly depends on the content, fineness, and age of the glass powder used as a supplementary cementitious material in mortar and concrete [18,23,29,37]. At 50% and 60% cement replacement with glass powder, Du et al. [18] and Wang et al. [23] observed 76.2% and 92% higher resistance to chloride attack. According to Nassar et al. [29], concrete containing fine glass powder with an average particle size of 13 μm had a higher resistance to chloride permeation. According to Carsana et al. [37], at the same replacement level, the mortar with glass powder fineness of 600 m2/kg demonstrated better resistance against chloride attack than the mortar with glass powder fineness of 400 m2/kg.
Many studies have been conducted on the use of glass powder as a supplementary binder for cement-based materials. However, there is limited available literature analyzing the strength, permeability, and microstructure of mortar containing very fine particle size taking into account their replacement levels. Based on this motivation, an experimental study was carried out on mortar specimens. Glass powder with particle sizes of 2, 5, 10 and 15 μm was selected as replacement for cement at levels of 5%, 10%, 15%, and 20%. Parameters such as compressive strength, gas permeability, and microstructure were studied to determine the optimal content-size combination.
2.1 Raw Materials and Mortar Preparation
Mortar with a water/cement ratio of 0.5 was made with ordinary cement PO 42.5 and river sand with a fineness modulus of 2.65, according to the procedures described in EN-196-1-2005. The gradation curve of river sand is shown in Fig. 1. The chemical composition and physical properties of the cement are shown in Tables 1 and 2. The glass powder was obtained by a process of crushing and dry grinding, after which the particles were separated according to the size required; in this study particle sizes of 2, 5, 10, and 15 μm. The XRD patterns of the glass powder is shown in Fig. 2. From the XRD image, the glass powder was predominantly made of SiO2. The mortar specimens were prepared as shown in Fig. 3. The mix proportion is presented in Table 3; the amount of glass powder substituted for cement, i.e., the replacement level was 5%, 10%, 15%, and 20% by mass of the cement. The glass powder cement mortar is prepared using four different particle sizes and four different contents for a total of 16 groups. The cylindrical mortar specimens ϕ 50 mm × 100 mm were prepared at room temperature for 24 h and then demolded. All specimens were stored up to 28 days in water at a temperature of 22°C ± 2°C.
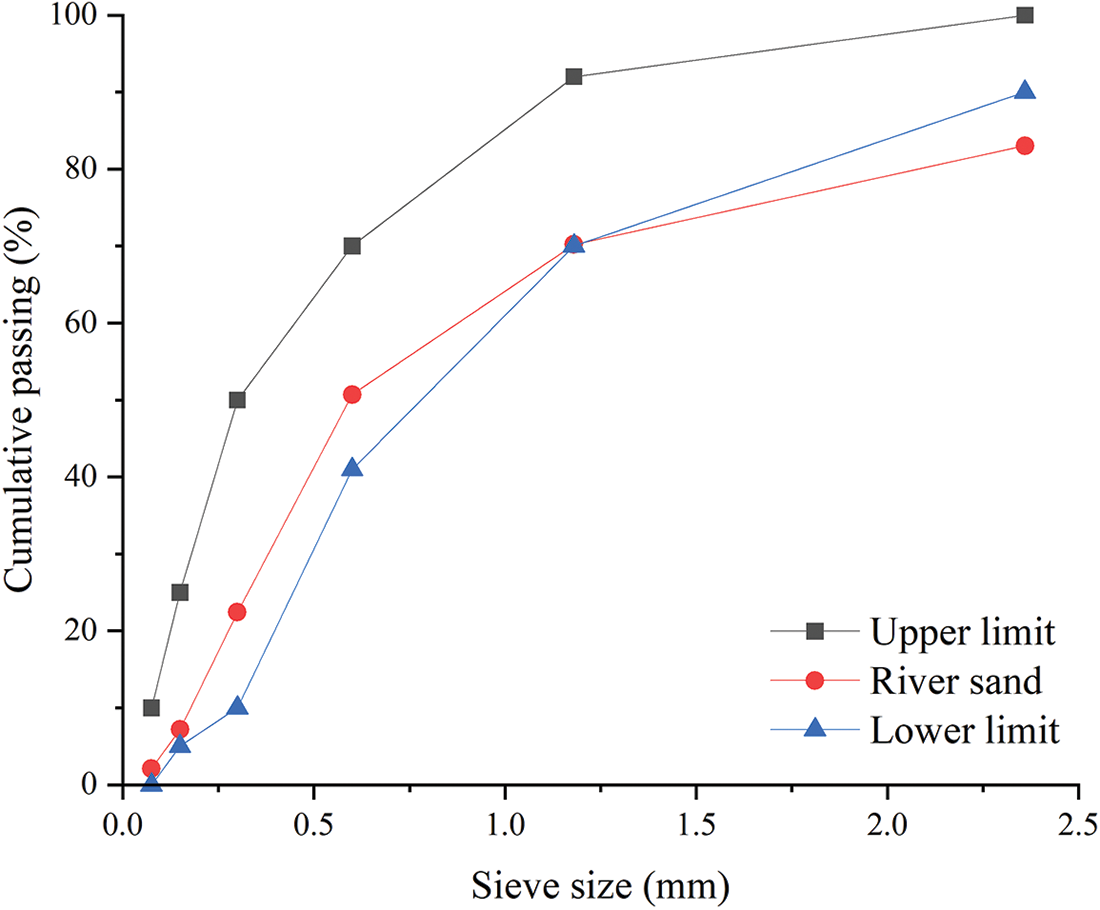
Figure 1: Gradation curve of the river sand


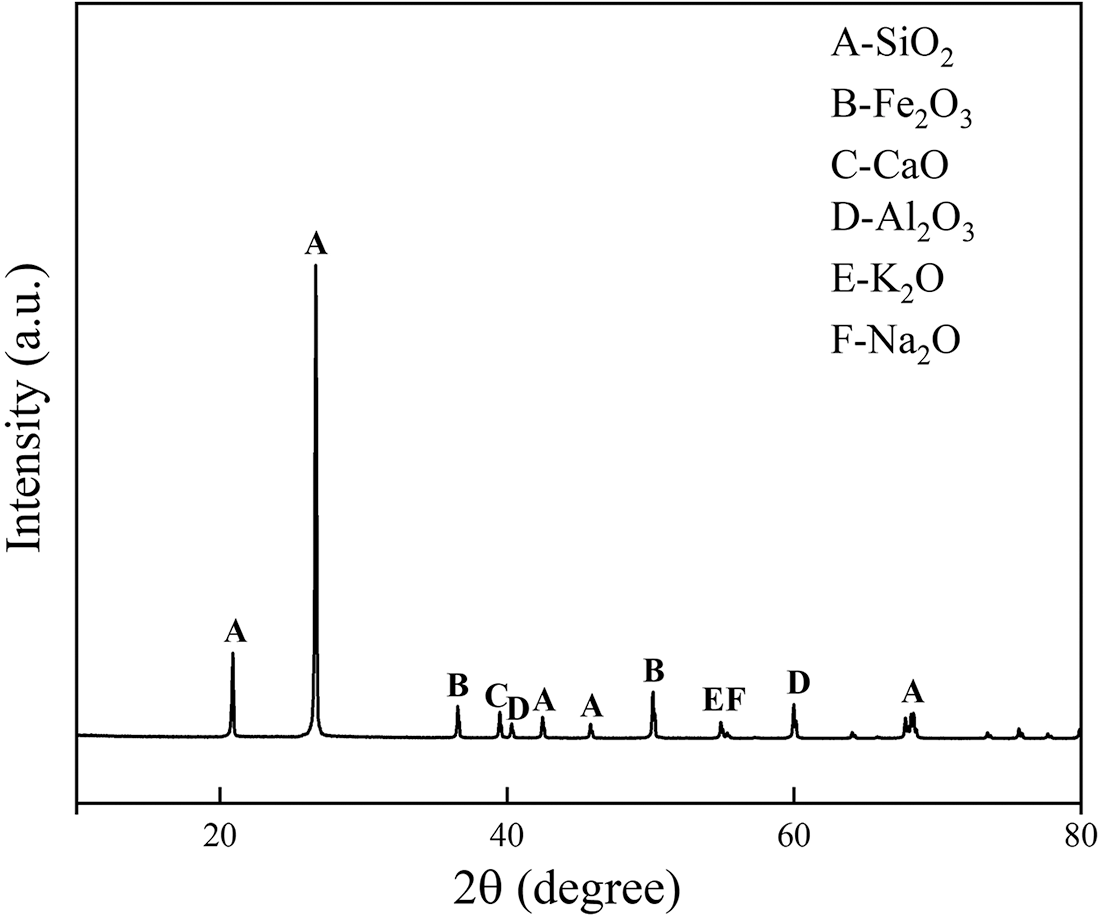
Figure 2: XRD pattern of the prepared glass powder
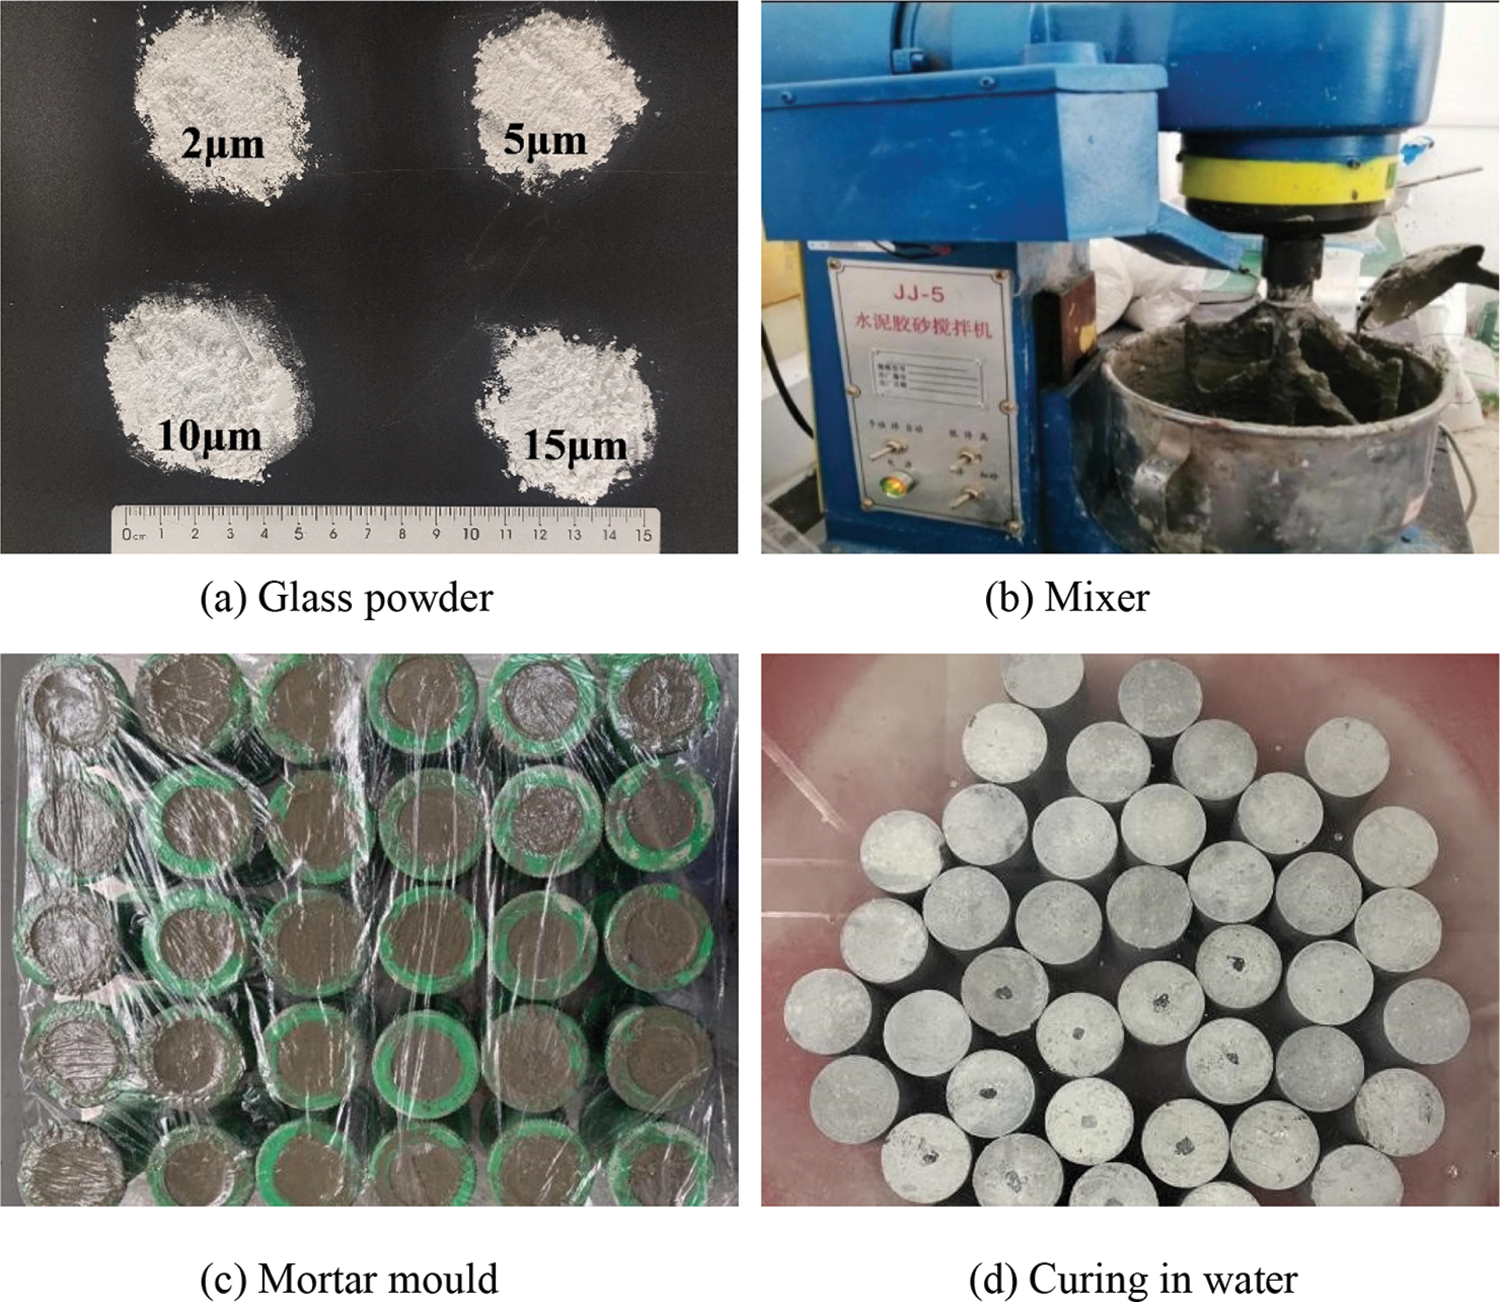
Figure 3: Mortar specimen preparations

The porosity was measured by the mass loss method. The mortar specimen is totally re-saturated with water by a vacuum pump, and then all mortar specimens were dried in a drying oven at 60°C to a constant weight (about 30 days). The porosity Φ of the mortar specimen was calculated by weighing the mass at the time of vacuum saturation and the mass after the complete drying process with an electronic balance with an accuracy of 0.01 g. The equation for calculating the porosity was as follows:
where VP in Eq. (1) represents the pore volume of the mortar specimen, MS and MD represent the mass of the mortar specimen when it is completely saturated with water and the mass after complete drying treatment, respectively, and ρs represent the density of water (1 g/m3); V in Eq. (2) represents the volume of the mortar specimen in its natural state. The porosity of the mortar specimen can be calculated by combining Eqs. (1) and (2).
The authors’ previous publications [38–40] elucidated the method of gas permeability measurement used in this study. The instrument of gas permeability measurement included a confining cell, high-pressure servo oil pump, and gas injection system, see Fig. 4. Argon was used for the test, which has a dynamic viscosity of 2.2 × 10⁻⁵ Pa⋅s at 20°C. To ensure the safety and accuracy of the test, the inlet pressure was set to 1.5 MPa, and the gas permeability was tested during loading confining pressures of 3, 5, 10, and 20 MPa, for each specimen.
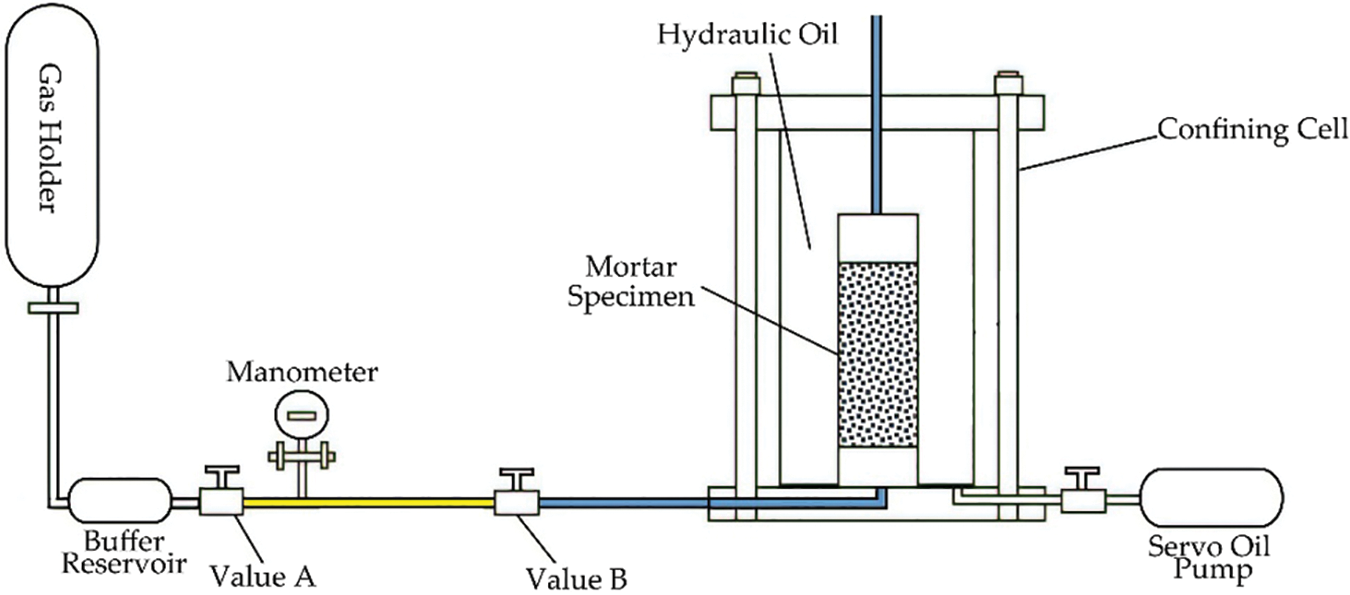
Figure 4: Schematic diagram of the gas permeability and porosity measurement device
The gas permeability K indicates the connection of pore structure inside the material that allows the passage capacity. According to Darcy’s law, the gas permeability is calculated by:
where K is the gas permeability; μ is the gas viscosity; L is the height of the mortar specimen; Δt is the time variation; ΔP1 is the variation of the inlet gas pressure at Δt time; A is the cross-sectional area of the mortar specimen; P0 is the atmospheric pressure; Pavg is the variation of the gas pressure at Δt time.
2.2.3 Compressive Strength Test
For the compressive strength test, an ETM series universal testing machine equipped with a capacity of 300 kN was used, as shown in Fig. 5. The measurements of axial stress and deformation were performed on cylindrical specimens. A special ball joint, with the same diameter as the specimen, was placed between the specimen and the upper plate of press to reduce the parasitic bending. The loading displacement speed was controlled at a rate of 1 mm/min. According to the RILEM recommendations [41], the Young’s modulus was measured after three loading/unloading cycles, characterized by a rise to 9 MPa, then an unload to 1 MPa. Fig. 5 shows a picture of the compressive strength test.
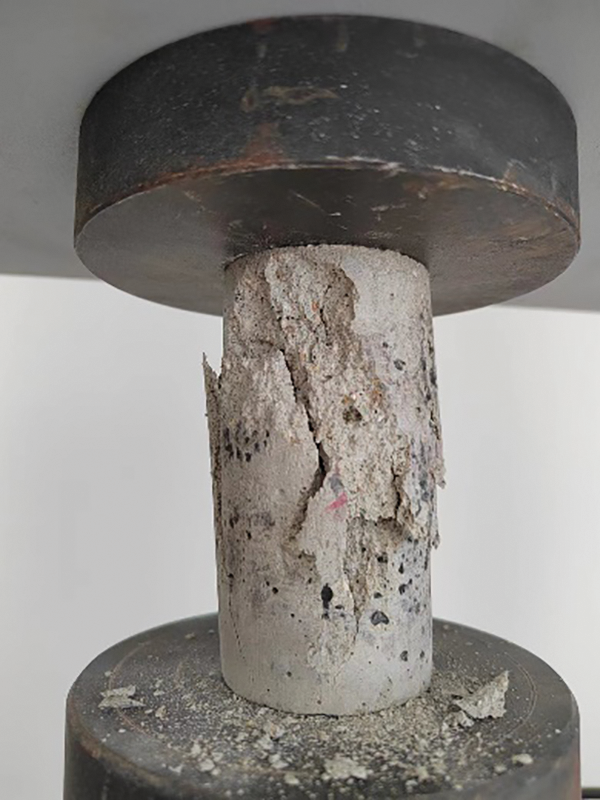
Figure 5: Picture of the compressive strength test
2.2.4 Nuclear Magnetic Resonance (NMR) Test
The nuclear magnetic resonance (NMR) test is commonly used to measure the size of pores inside porous media materials [42], which has the advantages of being fast and accurate. The Newmark’s NMR analyzer (PQ-001, Manhattan, NY, USA) was used for the analysis to obtain the pore structure of all mortars. The crushed pieces (approximately 1 cm × 1 cm), produced after the compressive strength test, were selected and then subjected to vacuum saturation before the NMR test without any surface preparation, as shown in Fig. 6. After saturation treatment, the pores of the specimen were completely saturated by water, so the distribution of the hydrogen atom content of the mortar could be measured by an NMR instrument, and the mass of water in the test could be deduced from the hydrogen atom content. The internal pore volume could be calculated by combining it with the density of water, and the T2 spectrum of the mortar could be derived from the NMR analyzer. Eq. (4) gives the relationship between relaxation time and pore volume:
where T2 is the relaxation time, ρ is the signal intensity, S is the pore surface area, and V is the pore volume.
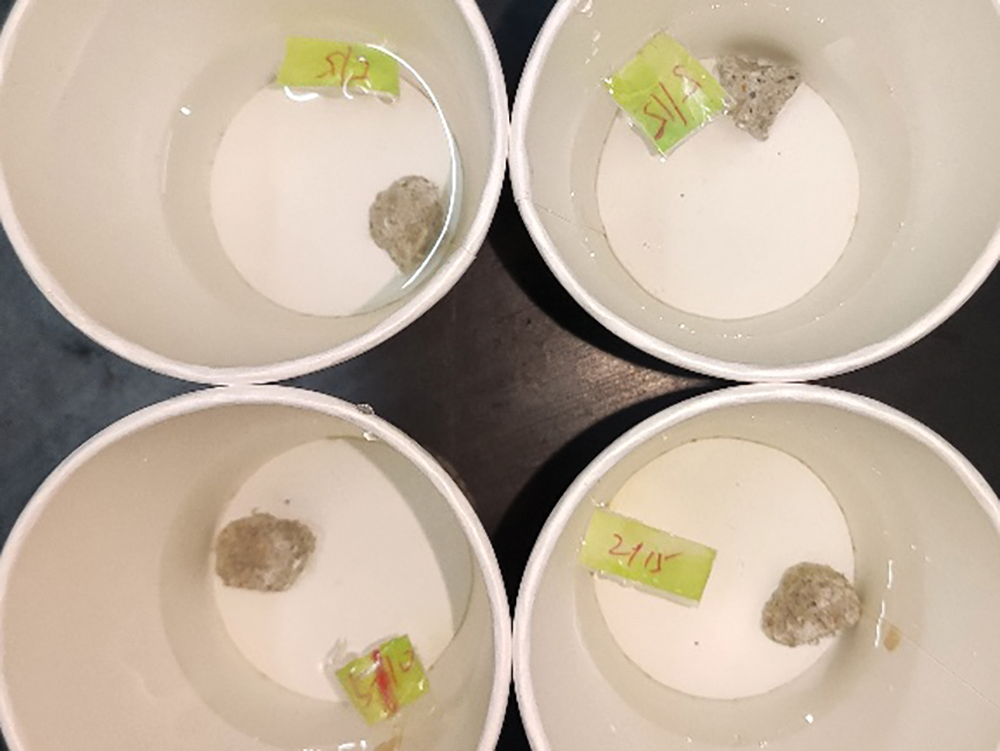
Figure 6: Mortar specimens for the NMR test
2.2.5 Electron Microscope Scanning (SEM) Test
Electron microscope scanning (SEM) is a microscopic morphological observation means between projection electron microscope and optical microscope, which can directly use the properties of the sample surface for microscopic imaging, mainly used for microscopic analysis and composition analysis of various materials. A ZEISS Gemini SEM 500 field emission scanning electron microscope was used to characterize the microstructure and morphology of the mortar specimens. Before this SEM test, small thin slices of about 5 mm × 5 mm were taken from the internal specimens of mortar, and after vacuum freeze-drying and gold spraying treatment, the microstructure of mortar was imaged and analyzed by SEM test to reveal the change pattern between the microstructure morphology and macroscopic properties of mortar with different particle sizes and different blending amounts of glass powder. Fig. 7 shows the mortar specimens for the SEM test.
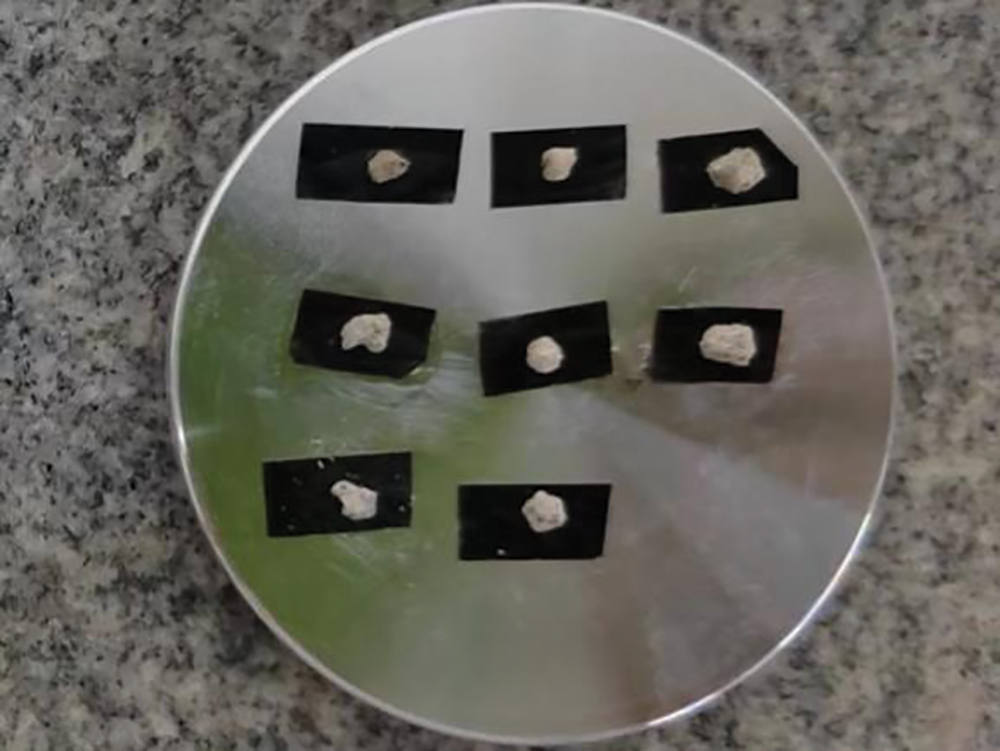
Figure 7: Mortar specimens for the SEM test
The porosity of mortar with varying glass powder content of different particle sizes are shown in Fig. 8 and Table 4. The porosity increased with increasing glass powder content and decreased with increasing glass powder particle size compared with the control group. The porosity of mortars containing glass powder of particle sizes 5 and 15 μm were comparable with the control group whatever the content. Because the cement was replaced by glass powder by mass, with the latter having a smaller specific gravity, the volume fraction of cement pastes increased, which resulted in slight increases in porosity [18]. The glass powder replaced cement with a smaller average particle size, producing a less dense matrix with higher porosity. However, the use of 10 μm glass powder reduced the porosity by 18.7%, 7.3%, 5.9%, and 1% at increasing contents. The lowest value was obtained with 5% replacement and 10 μm particle size. This finding supports the compressive strength results. On the other hand, when ultra-fine glass powder was used, the pore refinement by the pozzolanic reaction increased the porosity with increasing content. In the case of the 2 μm particles, with increasing content, there was a marked increase in the porosity (which has a negative effect on the strength of the mortar), which could be related to the maturation time.
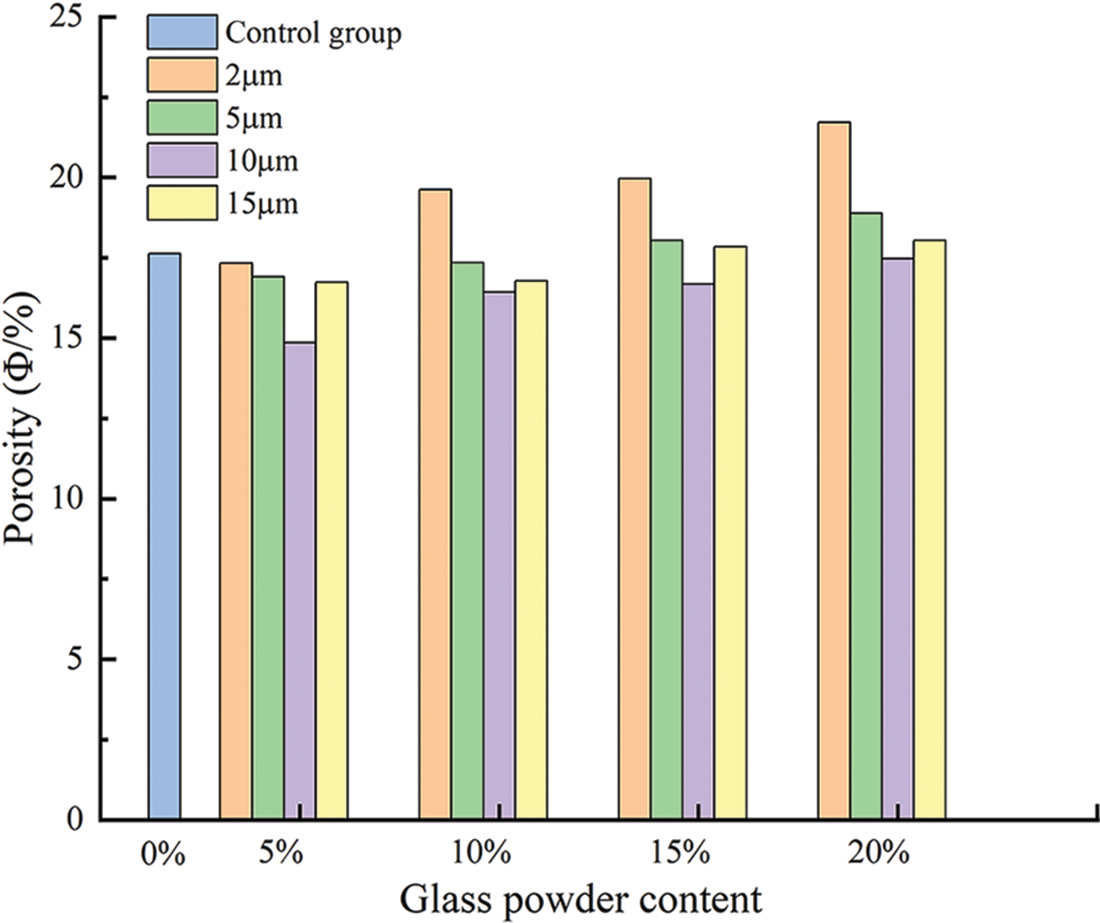
Figure 8: Porosity of all the prepared mortars with different contents particle sizes of glass powder

The gas permeability coefficients for each group at different confining pressures were calculated according to Eq. (3) and showed in Figs. 9 and 10.
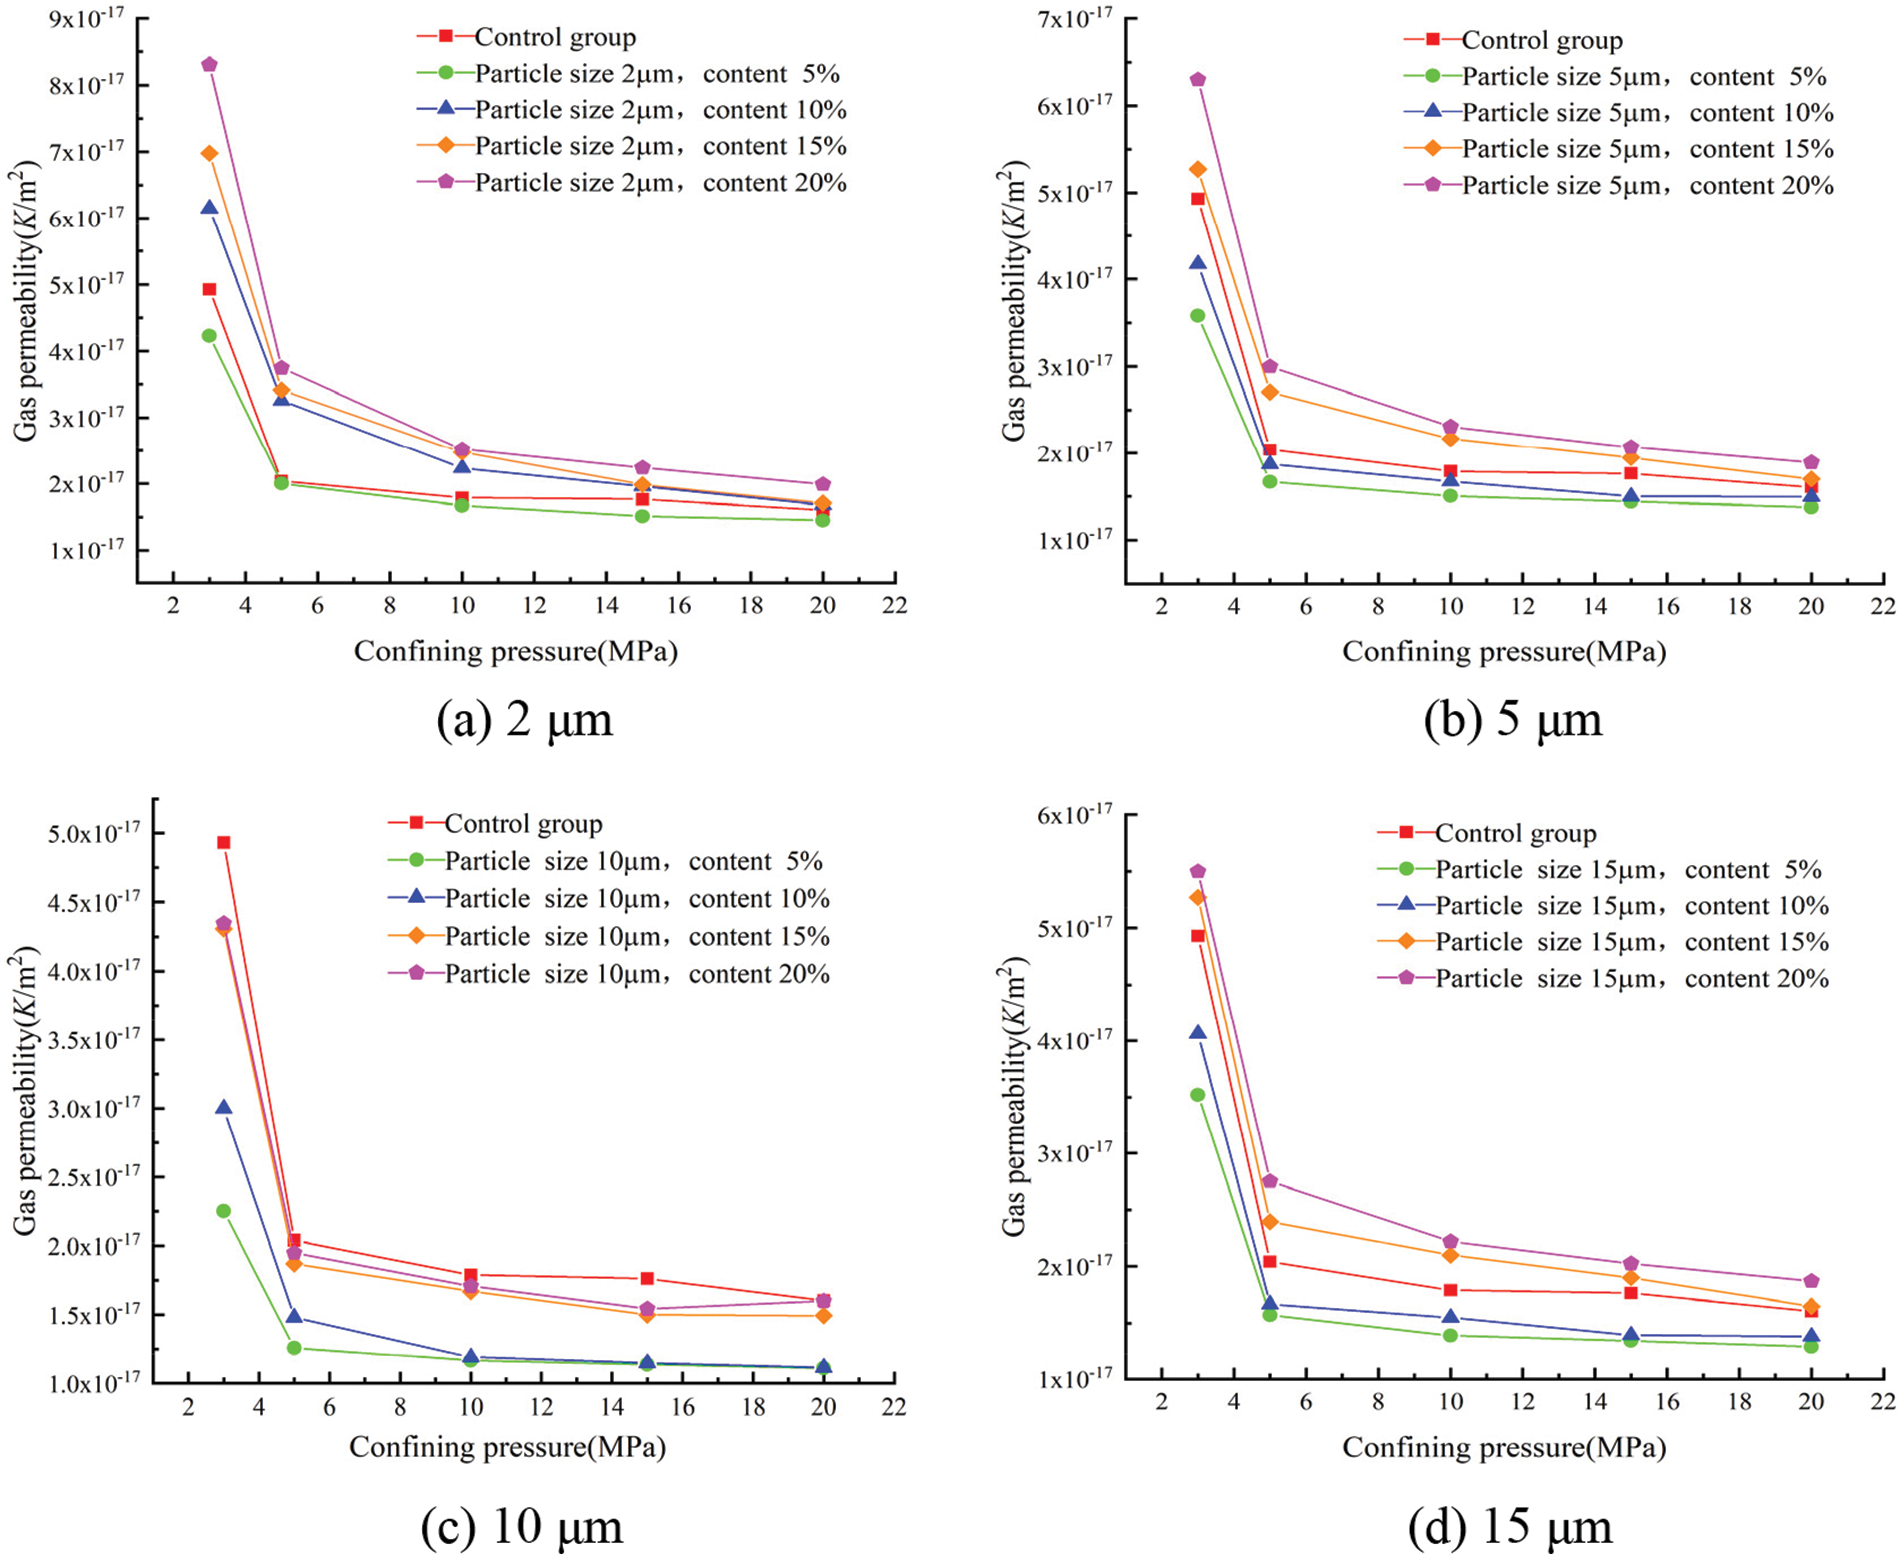
Figure 9: Effect of the different glass powder contents of uniform particle size on gas permeability
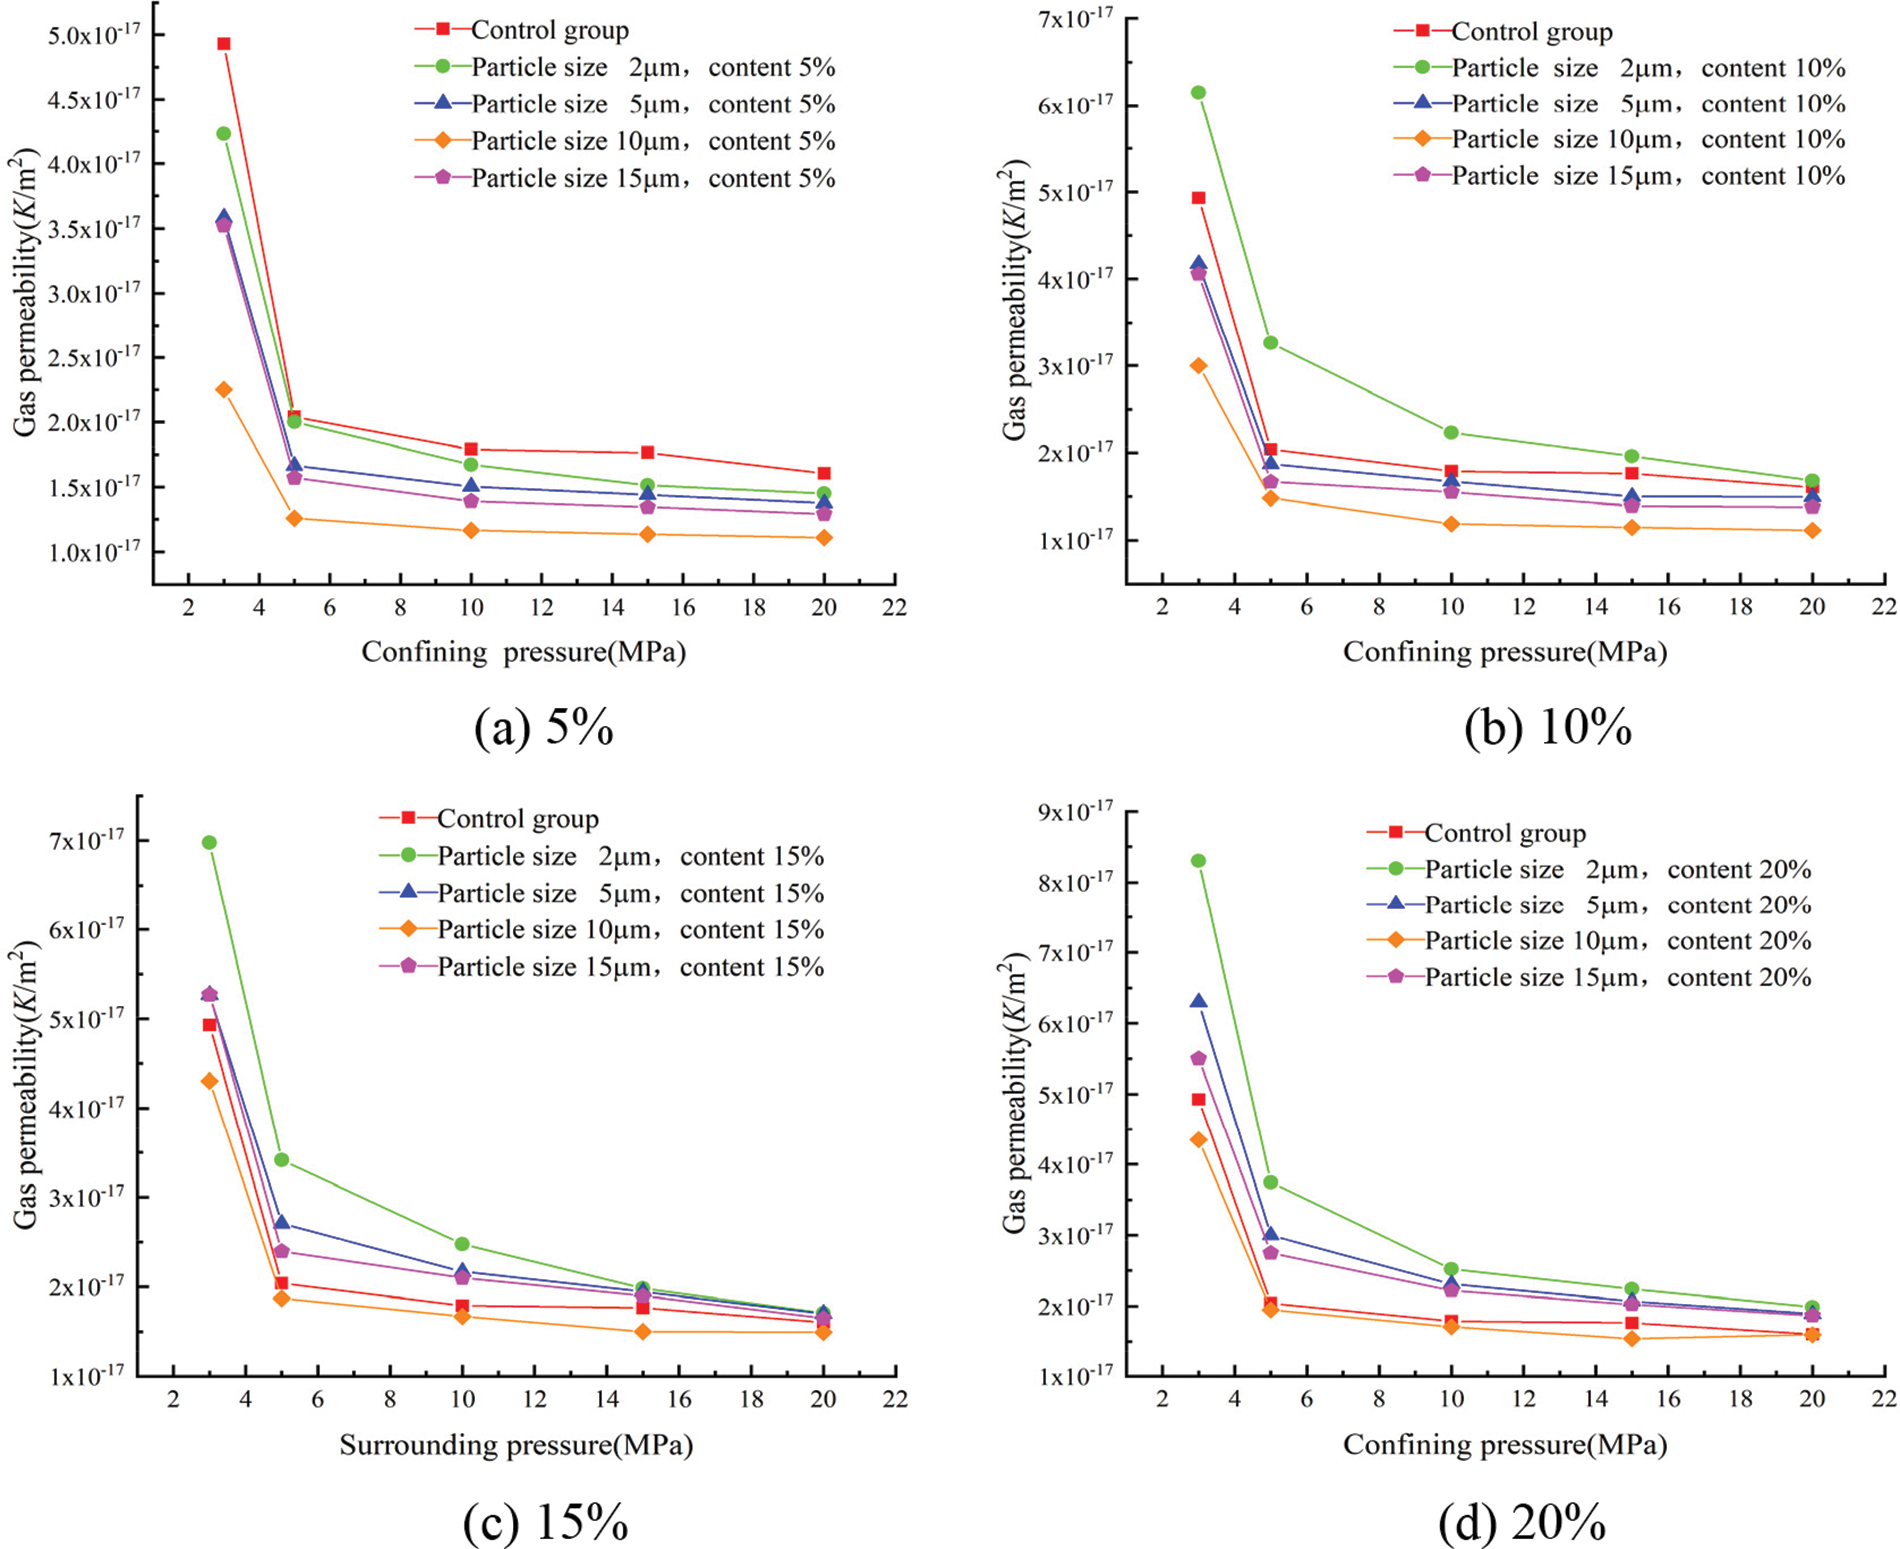
Figure 10: Effect of the different particle sizes of glass powder at uniform content on gas permeability
Fig. 9 shows the effect of glass powder content at each particle size on the gas permeability of mortar. The effect of confining pressure on gas permeability was more significant, and the gas permeability gradually decreased with the increase in confining pressure, whatever the content of glass powder. The change in gas permeability was very sudden, up until 10 MPa of confining pressure. Over 10 MPa, the gas permeability was restricted to a very narrow band. There was an initial microcrack closure phase that should be distinguished from the following confining pressure. The lowest gas permeability was obtained with 5% replacement whatever the particle size and confining pressure. In the case of 3 MPa of confining pressure, the gas permeability for the control group was 4.93 × 10⁻¹⁷ m2, that decreased to 2.25 × 10⁻¹⁷ m2 for glass powder mortar having 10 μm particle size. This behavior was confirmed with the results of porosity presented in Fig. 2. With the increase of glass powder content, the internal pores of mortar are filled by the appropriate amount of fine glass powder, the gas permeability decreased significantly due to the pozzolanic reaction and filler effect of the finer glass particles. However, exceeding the appropriate amount of finer glass powder had a negative result and restrained the pozzolanic reactivity. Hence, with the increase in the amount of glass powder, mortar gas permeability first reduced and then increased. The gas permeability of mortar for all mixes decreased gradually with the increase of the confining pressure.
Fig. 10 shows the relationship between the particle size of glass powder and gas permeability. A consistent trend with different particle sizes was observed whatever the confining pressure. With increasing the particle size, the gas permeability of mortar decreased and then increased at same confining pressure and content. The lowest gas permeability was obtained with 10 μm, and highest gas permeability with 2 μm. The mortar containing 10 μm glass powder particles improved the pozzolanic reaction and produced a more compact cement paste with all replacement level. The gas permeability mainly depends on porosity, pore size distribution, and connectivity. The gas permeability of mortar at the confining pressure of 3 MPa is fitted with the initial porosity; as shown in Fig. 11, the gas permeability of mortar fits well with the porosity (R2 = 0.92258), and the change of mortar gas permeability is closely related to the porosity.
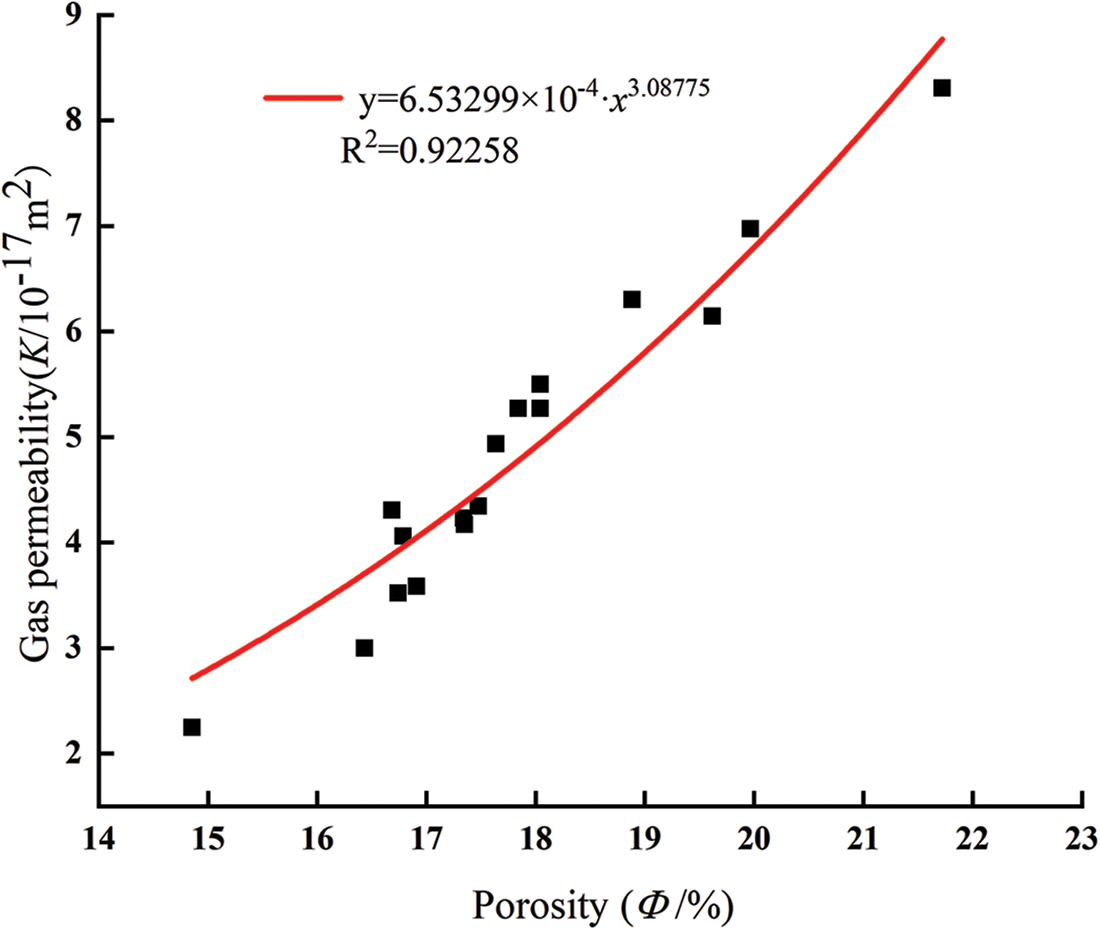
Figure 11: Relationship between porosity and gas permeability
Fig. 12 and Table 5 show the influence of glass powder particles sizes and content on compressive strength. With the increase of glass powder content, the overall compressive strength of glass powder mortar showed a trend of increasing first and then decreasing. Compressive strength of mortar containing 5% cement replacement with 2, 5, 10, and 15 μm sized particles increased by 1%, 16.3%, 36%, and 18.3%, respectively. The highest compressive strength was obtained with the 5% replacement level for all particle sizes compared with the control group, moreover the compressive strength of the 10 μm particle size mortar increased most significantly. The mortar with 10% replacement with glass powder particles of 10 and 15 μm size showed that the compressive strength of mortar increased by 22.5% and 11.9%, respectively, compared with the control group. The other groups showed that the compressive strength decreased with higher replacement level. Previous research used glass powder having similar particle size distribution as that of cement. However, in this study, the mortar was replaced by only one particle size of glass powder for each content, meaning that the binder material had more fine powder. Due to the replacement of cement by glass powder, the water to cement ratio increased. The reductions in compressive strength were proportional to the glass powder content. This could be attributed to the fact that glass powder has no such hydraulic reaction compared with cement. However, the early strength depended mainly on the glass powder microfilling ability. This result is in accordance with a previous study [34]. The compressive strength of mortar was fitted exponentially with the gas permeability of mortar when the confining pressure is 3 MPa. As shown in Fig. 13, the compressive strength of mortar fitted well with the gas permeability (R2 = 0.92806), which could better reflect the relationship between the compressive strength of mortar and gas permeability. The particle size of glass powder and the content had a significant effect on the compressive strength of mortar, therefore the content of fine glass powder can improve the compressive strength of cement mortar.
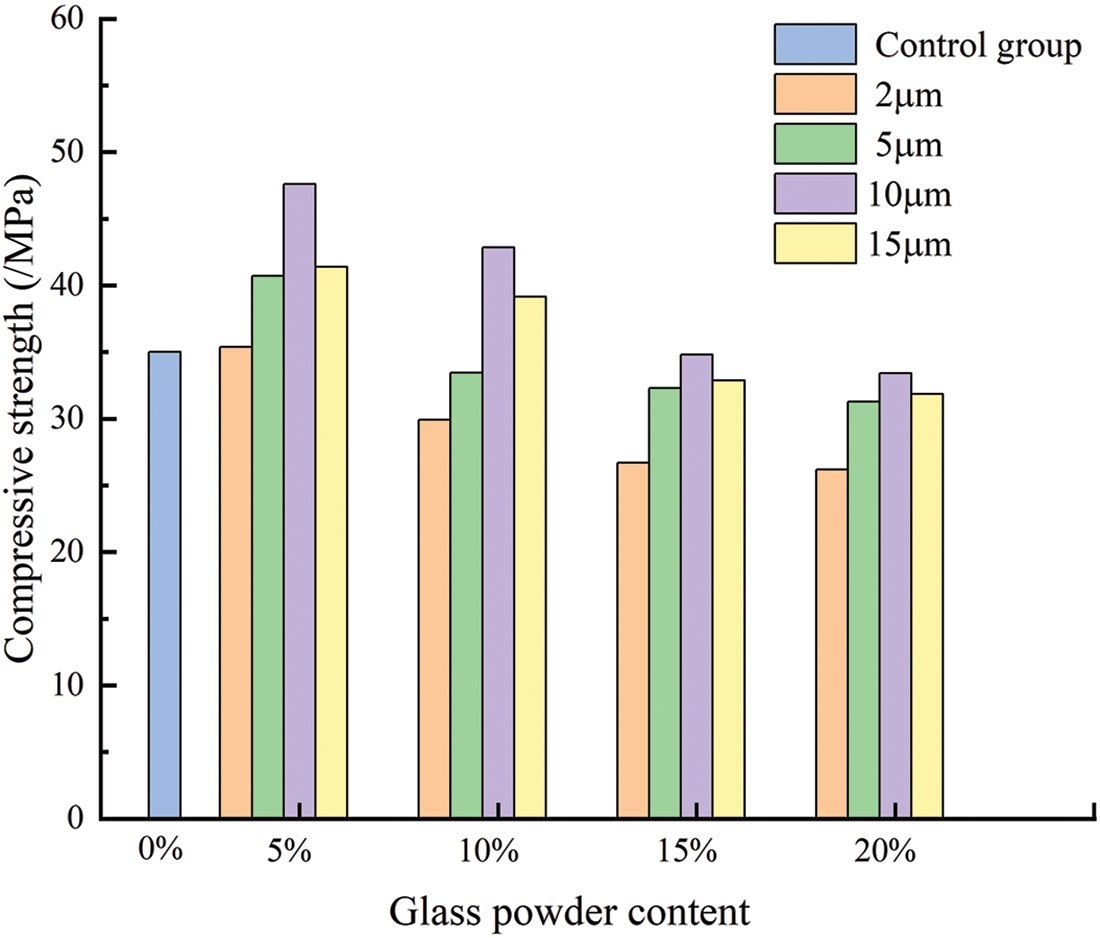
Figure 12: Compressive strength of mortar with different admixtures and particle sizes

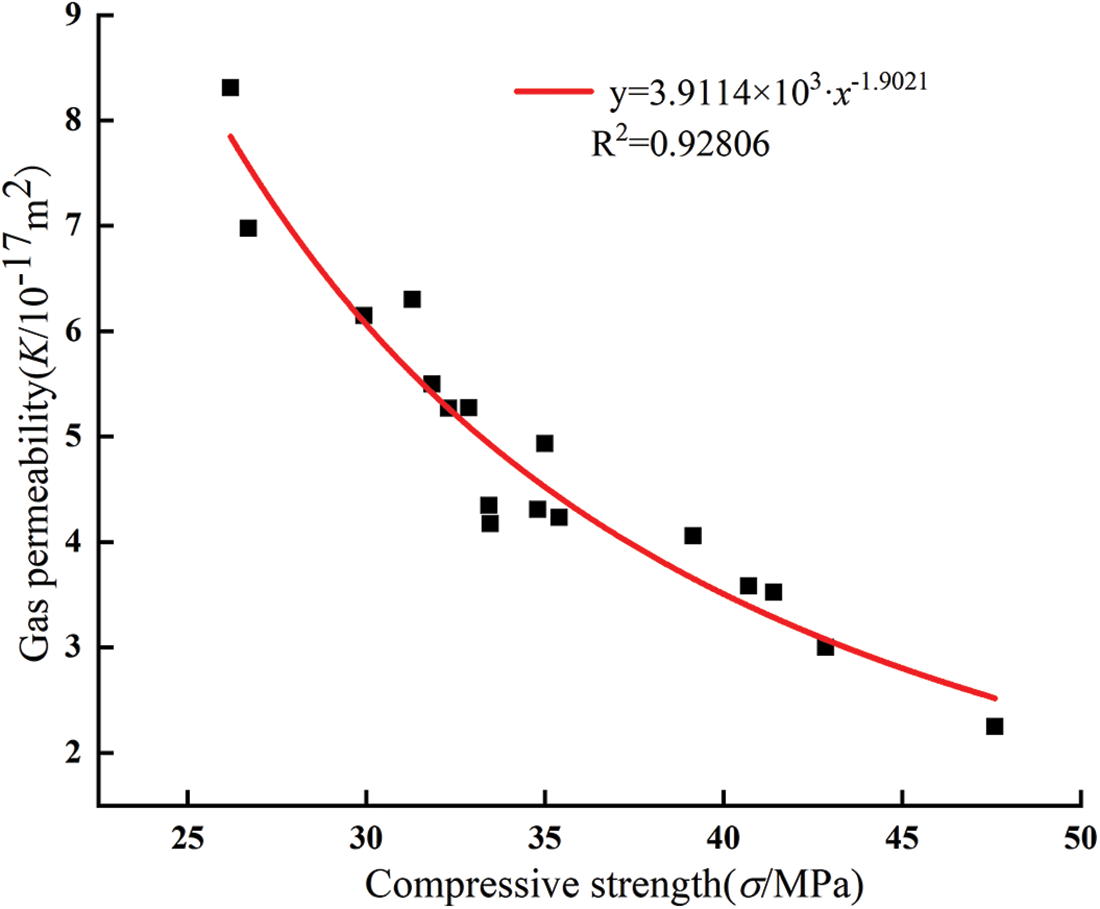
Figure 13: Relationship between compressive strength and gas permeability
3.4.1 Effect of Particle Size on NMR Results
To analyze the microstructure, the mortars containing 5% glass powder were selected. In the T2 spectrum of the NMR graph, the horizontal coordinate relaxation time can reflect the pore distribution of the specimen, and the longer relaxation time represents the larger pore diameter. The more significant the signal intensity in the vertical coordinate means the greater amounts of pores [43,44].
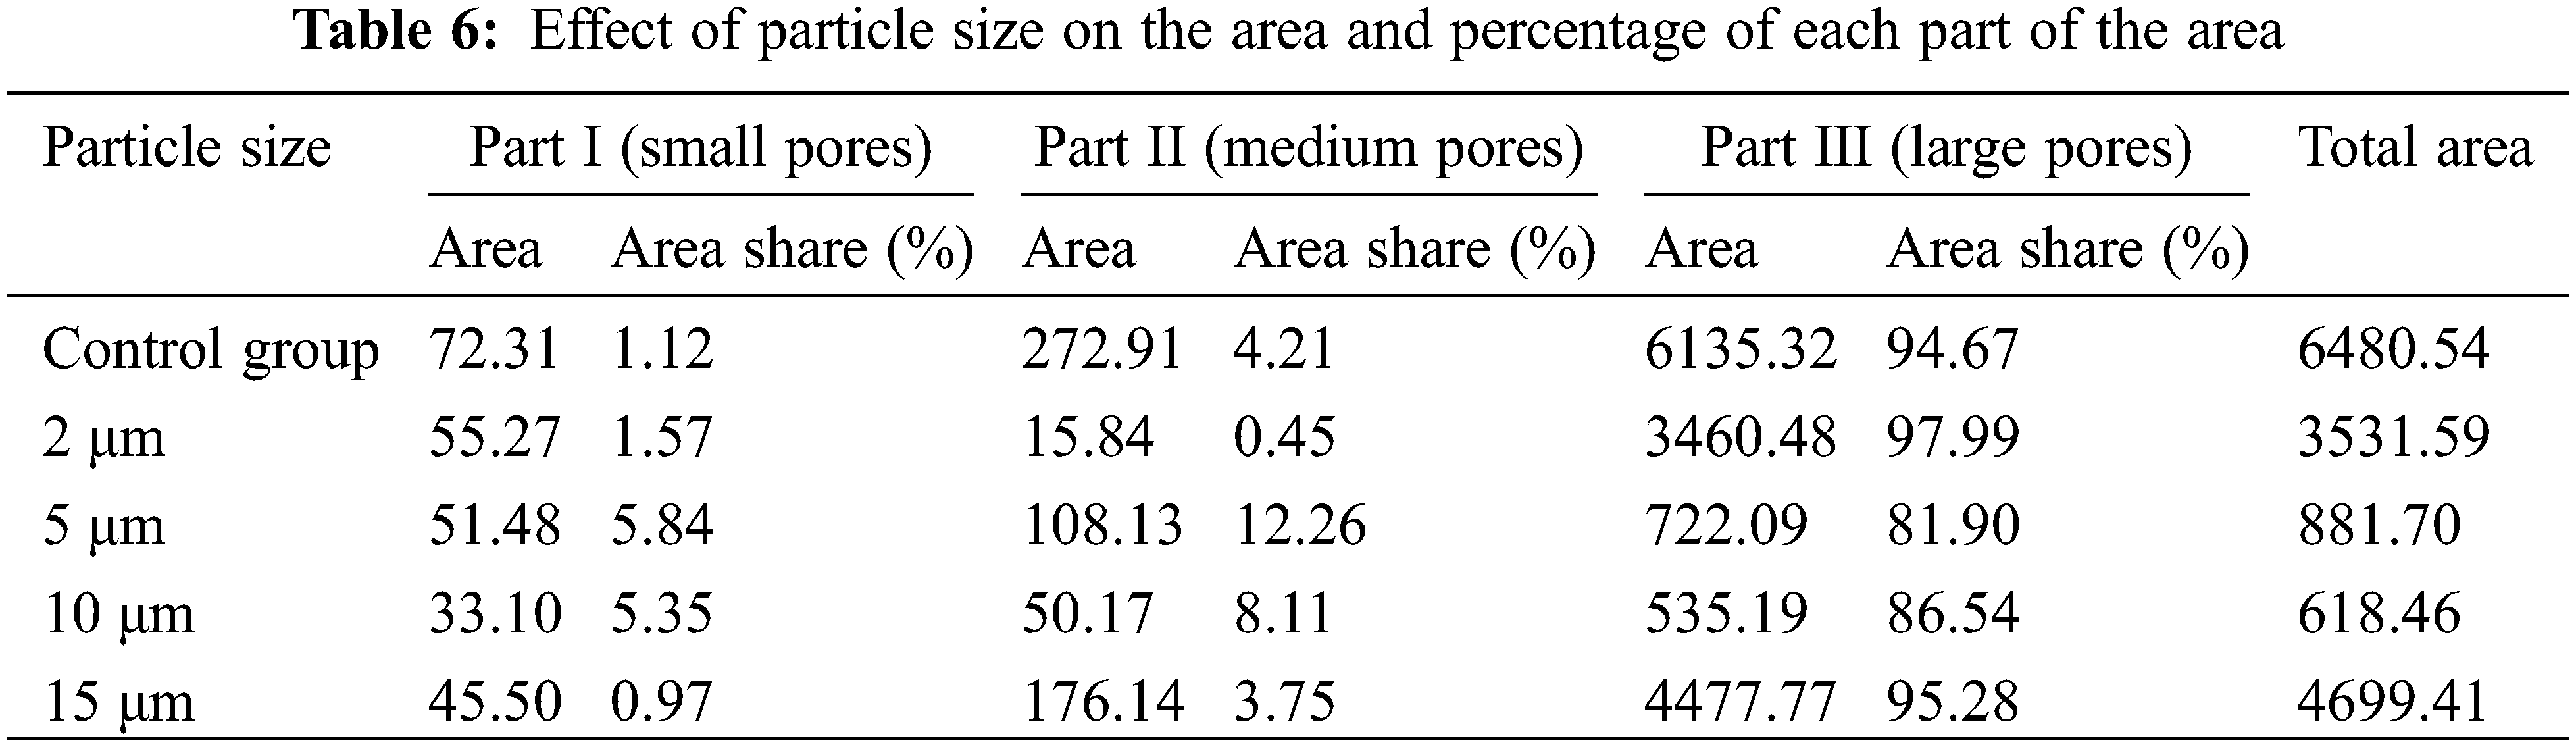
As shown in Fig. 14, there were mainly three distinct wave peaks in the control group, two wave peaks in the specimens with particle sizes of 2, 5, and 15 μm, and only one distinct wave peak for 10 μm. The T2 curves were divided into three parts according to the wave distribution [45], where the first part with a relaxation time of 0.01 to 5 ms represents small pores, the second part with a relaxation time of 5 to 100 ms represents medium pores, and the third part with a relaxation time of 100 to 10000 ms represents large pores. In the first part, the relaxation times corresponding to the wave peaks were similar, and the wave peaks of the control group were significantly higher than those of the specimens that contained glass powder, among which the wave peaks of the 10 μm particle size specimens are the smallest, indicating that the replacement of glass powder can significantly reduce the amounts of small pores. The specimens of 10 μm had the least amounts of small pores. From the second part, it can be seen that the wave peaks of the samples mixed with glass powder were shifted to the left compared with the control group, and the wave peaks of the control group were the longest, which indicates that the glass powder can reduce the internal pore size of mortar and will reduce the amounts of medium pores. It can be seen from the third part that only the control group and specimens of 2 μm sized particles showed significant peaks, the peak of the control group was much larger than the other, and the relaxation time corresponding to the wave peak of the control group is the largest, which indicates that the number of large pores inside the specimens with 5, 10 and 15 μm particle size of glass powder is smaller. The glass powder can effectively reduce the amounts of large pores and the pore diameter simultaneously. The area of the T2 spectral region refers to the T2 distribution curve and the area surrounded by the horizontal axis, and the T2 spectrum area (dimensionless) can reflect the pore volume.
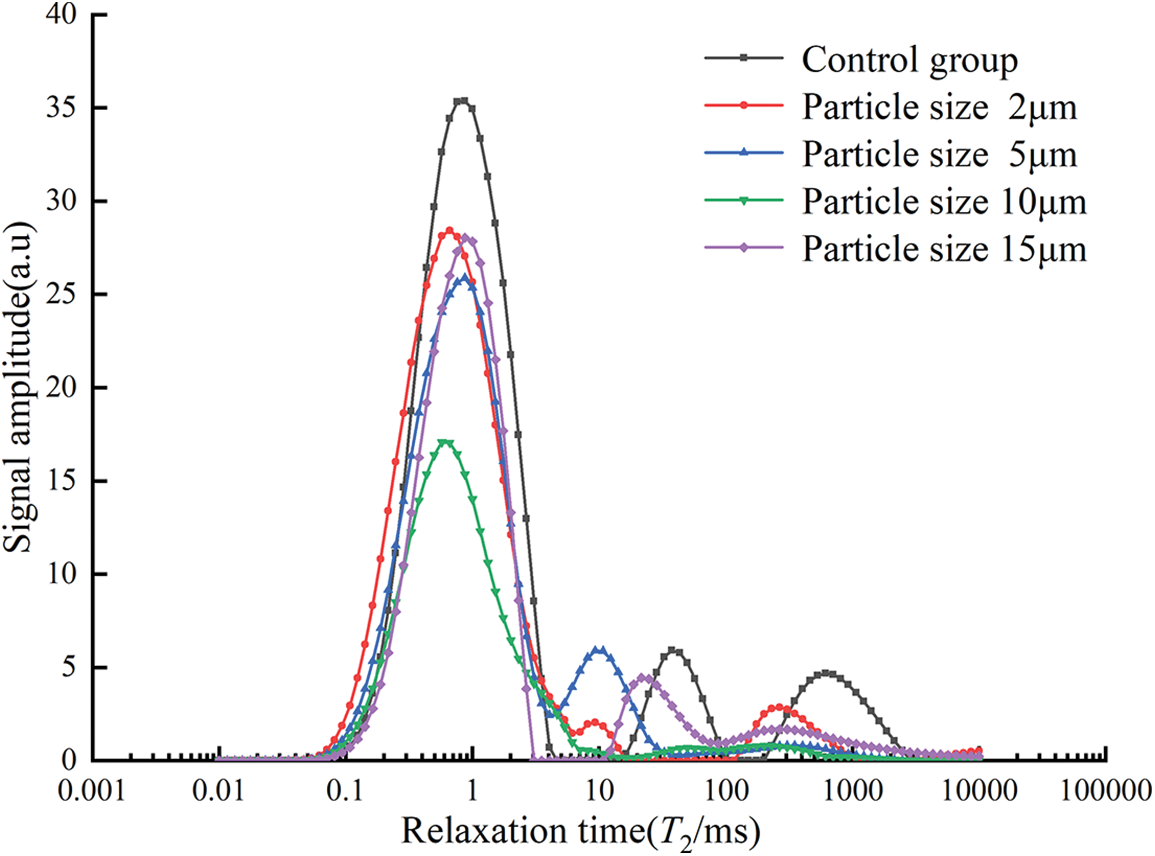
Figure 14: T2 spectra under different particle size conditions
In Table 6, the reduction in the total area of the T2 spectrum attributed to the incorporation of glass powder, and the total area of the T2 spectrum increases and then decreases as the particle size of glass powder increases, and the minimum value was obtained at the particle size of 10 μm. Compared with the control group, the total area of the T2 spectrum of the 10 μm specimen was reduced by 947.85%, indicating that the 10 μm glass powder could significantly reduce the pore area inside the specimen. This result is in accordance with the variation of porosity presented in Fig. 2.
3.4.2 Effect of Content on NMR Results
The T2 spectrum curves for different glass powder contents are shown in Fig. 15. The control group had three pronounced peaks, the glass powder content of 15% and 20% had two pronounced peaks, while the specimens with contents of 5% and 10% had only one pronounced peak. The T2 spectrum showed that the relaxation time of the wave peaks in the first part was similar, and the wave peak of the control group was the largest. In the second part, the control group had the most significant pores and relatively larger pore size with a content of 20% in the specimens. From the third part, it can be seen that the control group has the most significant amounts of large pores. The area and percentage of each part of the area are presented in Table 7.
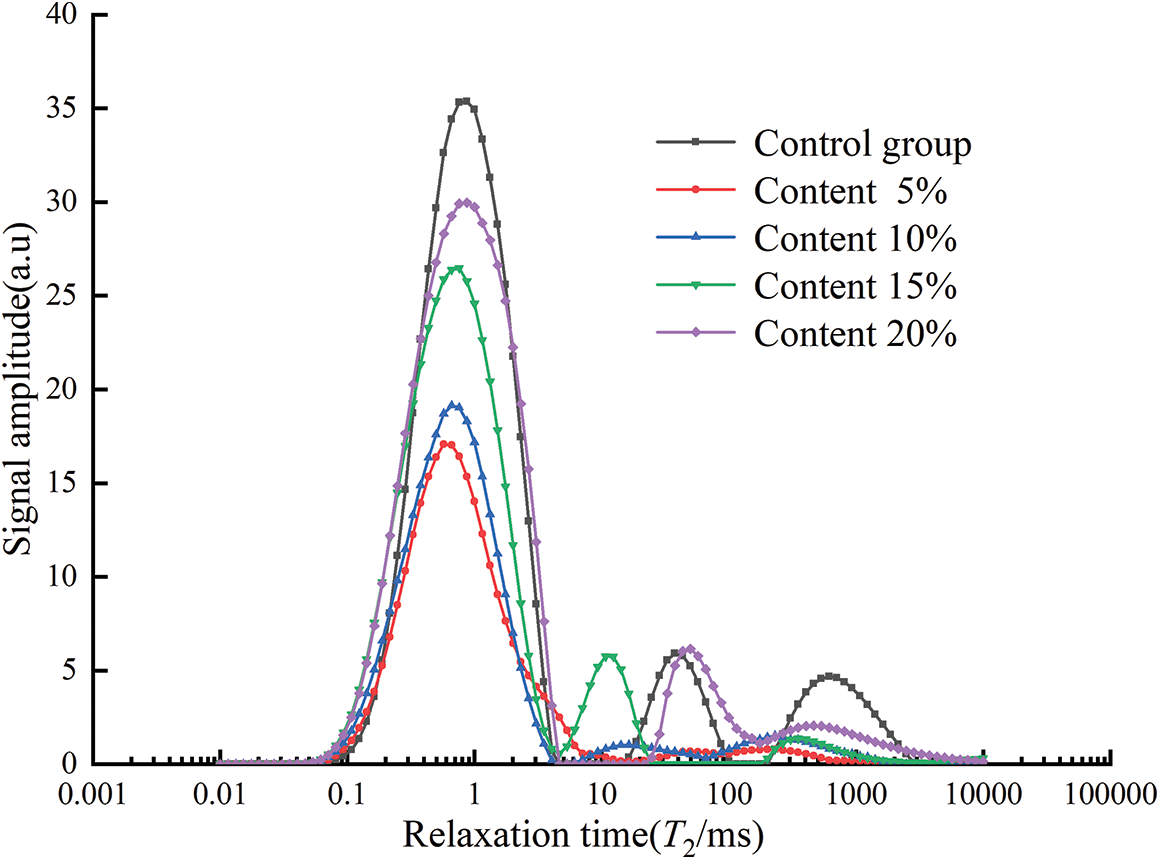
Figure 15: T2 spectrum under different contents

As shown in Table 7, with the increase of glass powder content, the total area first decreased and then increased, and the minimum value was obtained at the particle size of 5%. Compared with Fig. 14 and Table 6, among the three sizes of pore area, the area of large pore area accounts for the most significant proportion. With 5% and 10% content, the proportion of large pore area decreased.
The signal amplitude in the vertical coordinate of the NMR T2 spectrum represents the amounts of pores, and the larger the signal amplitude, the larger the number of pores in the mortar and thus the more significant the pore volume of the mortar, which indirectly affects the porosity, gas permeability, and compressive strength of the mortar. The signal amplitude of T2 spectrum was fitted exponentially with the gas permeability and compressive strength under the condition of the confining pressure of 3 MPa. As shown in Figs. 16 and 17, the signal amplitude of the mortar NMR T2 spectrum was highly correlated with the gas permeability (R2 = 0.94395), and the signal amplitude of the mortar NMR T2 spectrum fits well with the compressive strength (R2 = 0.8505), and the variation of the mortar. The variation of gas permeability and compressive strength were closely correlated with the signal amplitude of the NMR T2 spectrum.
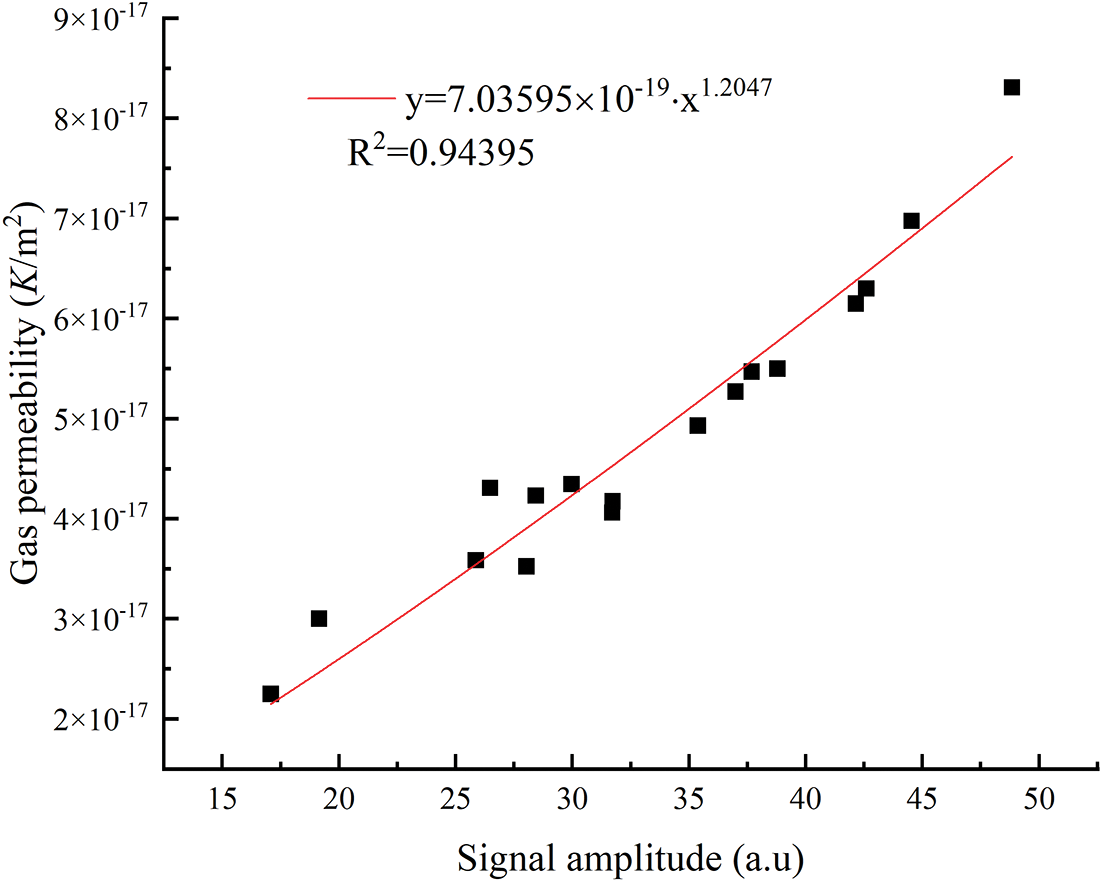
Figure 16: Relationship between T2 spectrum signal amplitude and gas permeability

Figure 17: Relationship between T2 spectrum signal amplitude and compressive strength
3.5 Electron Microscope Scanning (SEM) Results and Analysis
SEM was used to examine the microstructure of the mortars with different replacement of glass powder and particle size. Fig. 18a shows that the control group had a denser microstructure with a few rod-shaped calcium vanadinite crystals, well developed hydration product crystals of Ca(OH)2 in the form of plates and layers stacked together, and C–S–H gels in the form of flocculent with a few pores inside Figs. 18b–18e showed the 5% glass powder mortar with different particle sizes. The mortar mixed with glass powder had a more denser microstructure than the control mortar, with no obvious pores and cracks, and a small amount of rod-like calcium vanadinite crystals precipitated, and its hydration product crystals Ca(OH)2 are well developed and stacked together in plate or layer form. As the particle size of glass powder increases, the hydration product C–S–H was distributed in a large area and closely, and the overall C–S–H gel showed a trend of first increasing and then decreasing, especially the waste glass mortar with a particle size of 10 um had the most hydration product C–S–H, while the waste glass mortar with a particle size of 2 um had only a small distribution of hydration product C–S–H. This is consistent with the above experimental explanation of the effect of particle size on mortar gas permeability (particle size is correlated with the activity of glass powder). Fig. 19 shows the SEM images of the control group and mortar replaced by 10 μm glass powder with different contents. The reduction of the hydration products Ca(OH)2 and C–S–H gel was observed with the increase of glass powder. The pores and microcracks inside the paste gradually increased and became larger with the increase of content, see Figs. 19a, 19c, and 19d. The optimum percentages of cement replacement by glass powder were 5% and 10% due to the fact of filling with the appropriate amount of finer. The SiO2 in the glass powder combined with the Ca(OH)2 produced by cement hydration results in the pozzolanic reaction to generate C–S–H. However, above 10%, there was a restraining effect on the pozzolanic reaction as the microstructure of the glass powder mortar became loose and porous. The SEM results can help understand and explain the development of the compressive strength and gas permeability.
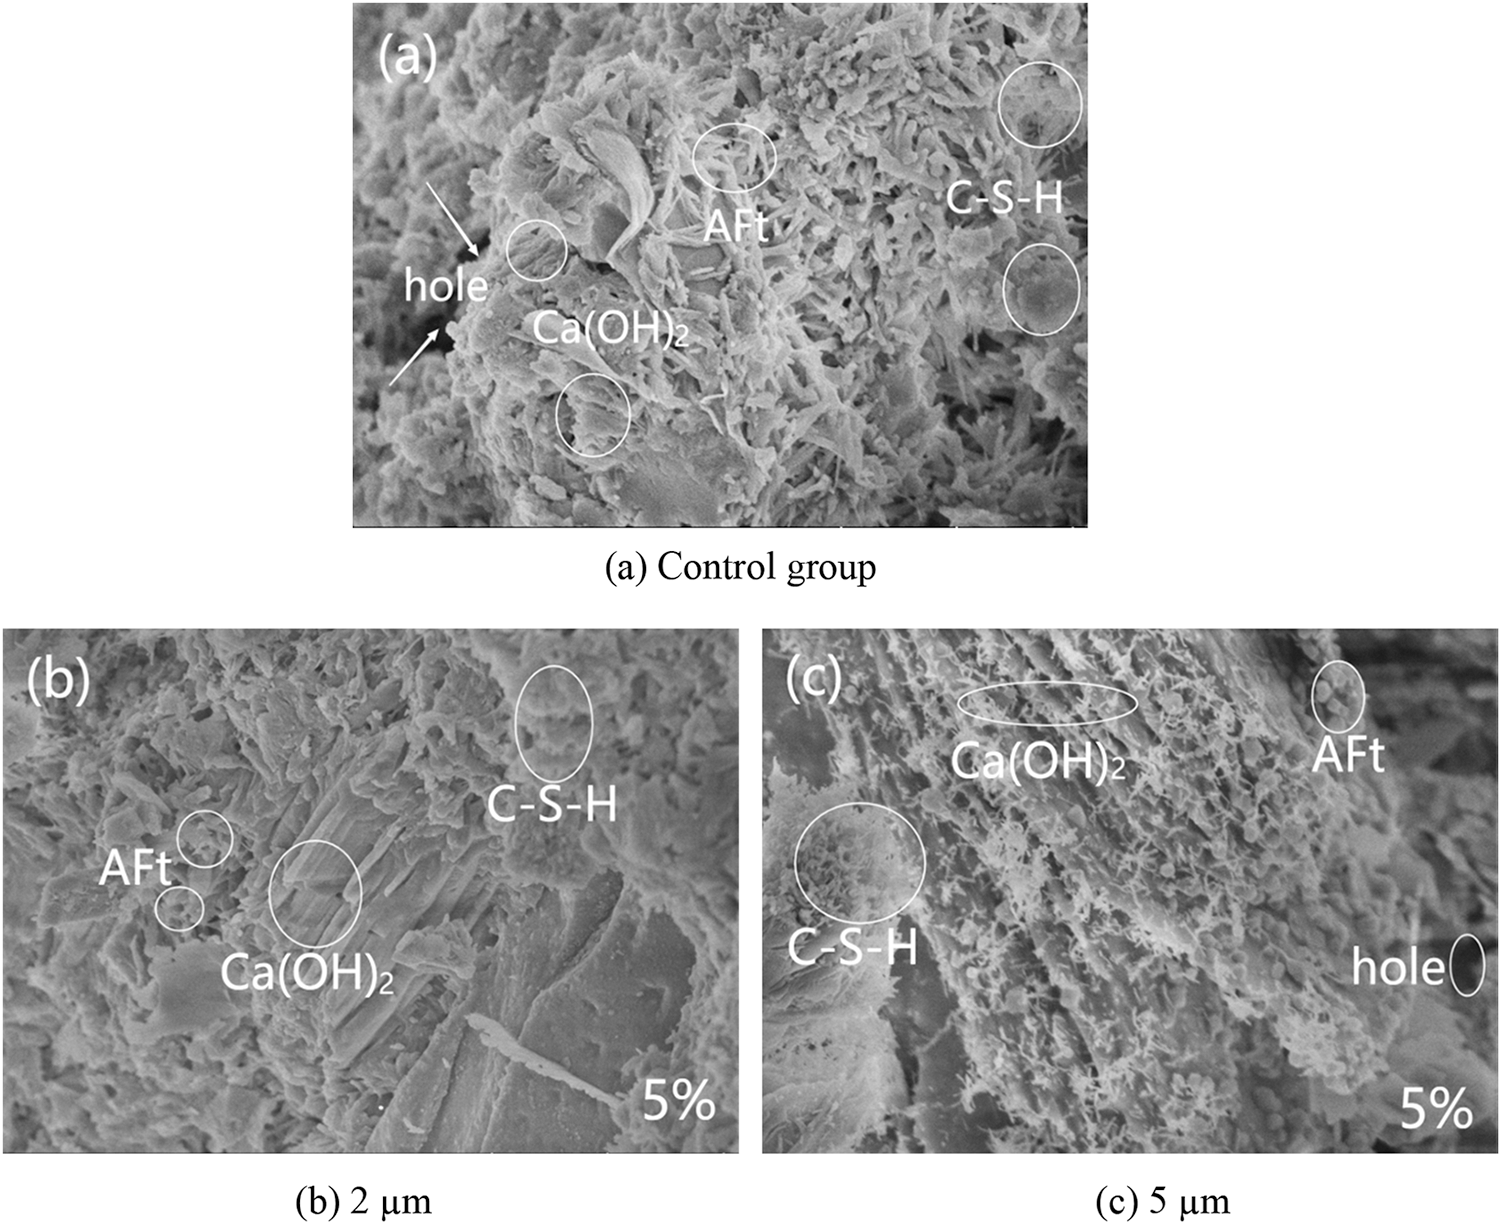
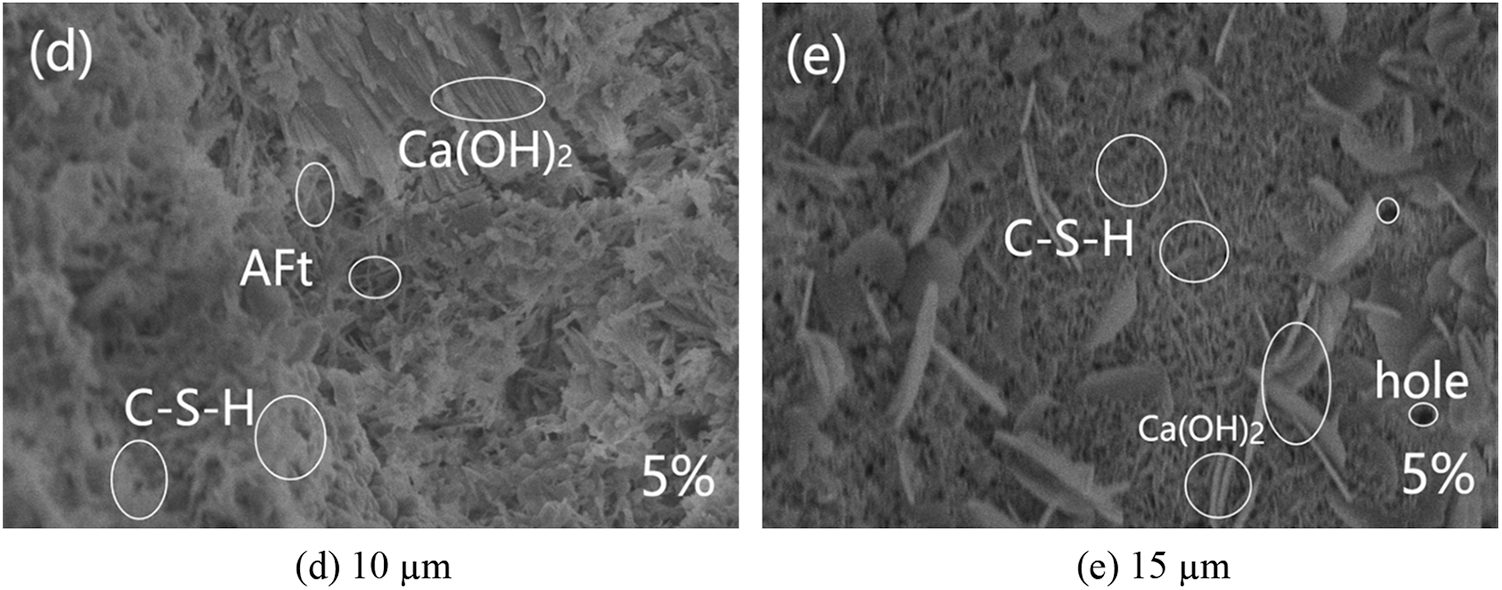
Figure 18: Scanning electron micrograph of glass powder mortar with different particle sizes
Figure 19: Scanning electron micrograph of glass powder mortar with different content
The use of glass powder as a cement replacement in mortar was proposed in this study. An experimental program was conducted to investigate the compressive strength, gas permeability, and microstructure of such mortar. The following conclusions can be obtained:
1. The particle size of glass powder is one of factors with greatest impact in the porosity, gas permeability and compressive strength. The use of glass powder with a size of 10 μm and 5% replacement produced a compact paste with lower porosity and led to a pore structure which allowed higher compressive strength and lower gas permeability.
2. Analysis from SEM and NMR tests showed that the glass powder in mortar exhibited pozzolanic reaction and filling effect, both of which induced pore size decreases. The pozzolanic reactivity of glass powder was dependent on its fineness. The microstructure became denser with particle sizes of 5 and 10 μm. However, high replacement level of cement by glass powder led to a restraining effect on the pozzolanic reaction. Above 10% replacement, the mortar showed higher porosity than the control group. The highest value was obtained with 20% replacement, and this finding was in accordance with the low compressive strength and high gas permeability.
3. From the experimental results, we can conclude that the use of 10% glass powder with particle size of 10 μm as replacement for cement in mortar is the best combination. It can improve the impact of the mortar in terms of performance and to determine the possibility of using glass powder in various forms in cement-based materials.
Funding Statement: This work is supported by the National Natural Science Foundation of China (No. 51709097).
Conflicts of Interest: The authors declare that they have no conflicts of interest to report regarding the present study.
References
1. Kajaste, R., Hurme, M. (2016). Cement industry greenhouse gas emissions—Management options and abatement cost. Journal of Cleaner Production, 112, 4041–4052. https://doi.org/10.1016/j.jclepro.2015.07.055 [Google Scholar] [CrossRef]
2. Xu, J. H., Fleiter, T., Fan, Y., Eichhammer, W. (2014). CO2 emissions reduction potential in China’s cement industry compared to IEA’s cement technology roadmap up to 2050. Applied Energy, 130, 592–602. https://doi.org/10.1016/j.apenergy.2014.03.004 [Google Scholar] [CrossRef]
3. Provis, J. L., Deventer, J. (2014). Alkali activated materials: State-of-the-art report. RILEM TC 224-AAM. Berlin: Springer. [Google Scholar]
4. Hill, R. C., Bowen, P. A. (1997). Sustainable construction: Principles and a framework for attainment. Construction Management & Economics, 15(3), 223–239. https://doi.org/10.1080/014461997372971 [Google Scholar] [CrossRef]
5. He, J. Y., He, J., Wang, Y. T., Fan, Y. B., Shi, H. W. et al. (2022). Pathway of carbon emissions peak for cement industry in China. Research of Environmental Sciences, 35(2), 347–355. [Google Scholar]
6. Luo, L., Guo, Y. Y., Li, Y. M., Zhang, Z. S., Zhu, T. Y. (2022). Research on low-carbon development technology path and forecast of cement industry under carbon neutral situation. Research of Environmental Sciences, 35(6), 1527–1537. [Google Scholar]
7. Ashish, D. K. (2019). Concrete made with waste marble powder and supplementary cementitious material for sustainable development. Journal of Cleaner Production, 211(20), 716–729. https://doi.org/10.1016/j.jclepro.2018.11.245 [Google Scholar] [CrossRef]
8. Luukkonen, T., Abdollahnejad, Z., Yliniemi, J., Kinnunen, P., Illikainen, M. (2018). Comparison of alkali and silica sources in one-part alkali-activated blast furnace slag mortar. Journal of Cleaner Production, 187, 171–179. https://doi.org/10.1016/j.jclepro.2018.03.202 [Google Scholar] [CrossRef]
9. Ashish, D. K., Verma, S. K. (2019). Determination of optimum mixture design method for self-compacting concrete: Validation of method with experimental results. Construction and Building Materials, 217(30), 664–678. https://doi.org/10.1016/j.conbuildmat.2019.05.034 [Google Scholar] [CrossRef]
10. Hwang, C. L., Hung, M. F. (2005). Durability design and performance of self-consolidating lightweight concrete. Construction & Building Materials, 19(8), 619–626. https://doi.org/10.1016/j.conbuildmat.2005.01.003 [Google Scholar] [CrossRef]
11. Alex, J., Dhanalakshmi, J., Ambedkar, B. (2016). Experimental investigation on rice husk ash as cement replacement on concrete production. Construction & Building Materials, 127, 353–362. https://doi.org/10.1016/j.conbuildmat.2016.09.150 [Google Scholar] [CrossRef]
12. Mehta, A., Ashish, D. K. (2020). Silica fume and waste glass in cement concrete production: A review. Journal of Building Engineering, 29, 100888. https://doi.org/10.1016/j.jobe.2019.100888 [Google Scholar] [CrossRef]
13. Wang, Y. B., Li, J. W., He, X. Y., Zheng, Z. Q., Su, Y. et al. (2022). Effects of wet-grinded superfine waste glass on the fresh properties and reaction characteristic of cement pastes. Construction and Building Materials, 247, 118593. https://doi.org/10.1016/j.conbuildmat.2020.118593 [Google Scholar] [CrossRef]
14. Liu, S., Xie, G., Rao, M. (2013). Effect of glass powder on properties and microstructure of ultrahigh performance cement based materials. Materials Research Innovations, 17(sup1), 210–214. https://doi.org/10.1179/1432891713Z.000000000217 [Google Scholar] [CrossRef]
15. Lu, J. X., Poon, C. S. (2018). Improvement of early-age properties for glass-cement mortar by adding nanosilica. Cement and Concrete Composites, 89, 18–30. https://doi.org/10.1016/j.cemconcomp.2018.02.010 [Google Scholar] [CrossRef]
16. Kim, I. S., Choi, S. Y., Yang, E. I. (2018). Evaluation of durability of concrete substituted heavyweight waste glass as fine aggregate. Construction and Building Materials, 184, 269–277. https://doi.org/10.1016/j.conbuildmat.2018.06.221 [Google Scholar] [CrossRef]
17. Zaidi, K. A., Ram, S., Gautam, M. K. (2017). Utilisation of glass powder in high strength copper slag concrete. Advances in Concrete Construction, 5(1), 65–74. https://doi.org/10.12989/acc.2017.5.1.65 [Google Scholar] [CrossRef]
18. Du, H., Tan, K. H. (2016). Properties of high volume glass powder concrete. Cement and Concrete Composites, 75, 22–29. https://doi.org/10.1016/j.cemconcomp.2016.10.010 [Google Scholar] [CrossRef]
19. Dong, W., Li, W., Tao, Z. (2021). A comprehensive review on performance of cementitious and geopolymeric concretes with recycled waste glass as powder, sand or cullet. Resources Conservation and Recycling, 172, 105664. https://doi.org/10.1016/j.resconrec.2021.105664 [Google Scholar] [CrossRef]
20. Wang, H. J., Zhang, Y. S., Zhao, J. F. (2012). Research on using glass powder as pulverized admixture for concrete. Journal of Henan Polytechnic University (Natural Science), 31(5), 608–612. [Google Scholar]
21. Jang, H., Jeon, S., So, H., So, S. (2015). Properties of different particle size of recycled TFT-LCD waste glass powder as a cement concrete binder. International Journal of Precision Engineering and Manufacturing, 16(12), 2591–2597. https://doi.org/10.1007/s12541-015-0331-7 [Google Scholar] [CrossRef]
22. Calmon, J. L., Sauer, A. S., Vieira, G. L., Teixeira, J. E. S. L. (2014). Teixeira, effects of windshield waste glass on the properties of structural repair mortars. Cement and Concrete Composites, 53, 88–96. https://doi.org/10.1016/j.cemconcomp.2014.04.008 [Google Scholar] [CrossRef]
23. Wang, Z., Shi, C. J., Song, J. M. (2009). Effect of glass powder on chloride ion transport and alkali-aggregate reaction expansion of lightweight aggregate concrete. Journal of Wuhan University of Technology-Mater. Sci. Ed., 24(2), 312–317. https://doi.org/10.1007/s11595-009-2312-0 [Google Scholar] [CrossRef]
24. Mirzahosseini, M., Riding, K. A. (2015). Influence of different particle sizes on reactivity of finely ground glass as supplementary cementitious material (SCM). Cement and Concrete Composites, 56, 95–105. https://doi.org/10.1016/j.cemconcomp.2014.10.004 [Google Scholar] [CrossRef]
25. Lu, J., Duan, Z., Poon, C. S. (2017). Combined use of waste glass powder and cullet in architectural mortar. Cement and Concrete Composites, 82, 34–44. https://doi.org/10.1016/j.cemconcomp.2017.05.011 [Google Scholar] [CrossRef]
26. Omran, A., Tagnit-Hamou, A. (2016). Performance of glass-powder concrete in field applications. Construction and Building Materials, 109, 84–95. https://doi.org/10.1016/j.conbuildmat.2016.02.006 [Google Scholar] [CrossRef]
27. Omran, A. F., D.-Morin, E., Harbec, D., Tagnit-Hamou, A. (2017). Long-term performance of glass-powder concrete in large-scale field applications. Construction and Building Materials, 135, 43–58. https://doi.org/10.1016/j.conbuildmat.2016.12.218 [Google Scholar] [CrossRef]
28. Du, H., Tan, K. H. (2017). Properties of high volume glass powder concrete. Cement and Concrete Composites, 75, 22–29. https://doi.org/10.1016/j.cemconcomp.2016.10.010 [Google Scholar] [CrossRef]
29. Nassar, R. U. D., Soroushian, P. (2012). Strength and durability of recycled aggregateconcrete containing milled glass as partial replacement for cement. Construction and Building Materials, 29, 368–377. https://doi.org/10.1016/j.conbuildmat.2011.10.061 [Google Scholar] [CrossRef]
30. Karamberi, A., Moutsatsou, A. (2005). Participation of coloured glass cullet in cementitious materials. Cement and Concrete Composites, 27, 319–327. https://doi.org/10.1016/j.cemconcomp.2004.02.021 [Google Scholar] [CrossRef]
31. Pereira-de-Oliveira, L. A., Castro-Gomes, J. P., Santos, P. M. S. (2012). The potential pozzolanic activity of glass and red-clay ceramic waste as cement mortars components. Construction and Building Materials, 31, 197–203. https://doi.org/10.1016/j.conbuildmat.2011.12.110 [Google Scholar] [CrossRef]
32. Mirzahosseini, M., Riding, K. A. (2014). Effect of curing temperature and glass type on the pozzolanic reactivity of glass powder. Cement and Concrete Research, 58, 103–111. https://doi.org/10.1016/j.cemconres.2014.01.015 [Google Scholar] [CrossRef]
33. Bignozzi, M. C., Saccani, A., Barbieri, L., Lancellotti, I. (2015). Glass waste as supplementary cementing materials: The effects of glass chemical composition. Cement and Concrete Composites, 55, 45–52. https://doi.org/10.1016/j.cemconcomp.2014.07.020 [Google Scholar] [CrossRef]
34. Nahi, S., Leklou, N., Khelidj, A., Oudjit, M. N., Zenati, A. (2020). Properties of cement pastes and mortars containing recycled green glass powder. Construction and Building Materials, 262, 120875. https://doi.org/10.1016/j.conbuildmat.2020.120875 [Google Scholar] [CrossRef]
35. Sun, J., Wang, Y., Liu, S., Dehghani, A., Xiang, X. et al. (2021). Mechanical, chemical and hydrothermal activation for waste glass reinforced cement. Construction and Building Materials, 301, 124361. https://doi.org/10.1016/j.conbuildmat.2021.124361 [Google Scholar] [CrossRef]
36. Sun, J., Wang, Y., Yao, X., Ren, Z., Zhang, G. et al. (2021). Machine-learning-aided prediction of flexural strength and ASR expansion for waste glass cementitious composite. Applied Sciences, 11(15). https://doi.org/10.3390/app11156686 [Google Scholar] [CrossRef]
37. Carsana, M., Frassoni, M., Bertolini, L. (2014). Comparison of ground waste glass with other supplementary cementitious materials. Cement and Concrete Composites, 45, 39–45. https://doi.org/10.1016/j.cemconcomp.2013.09.005 [Google Scholar] [CrossRef]
38. Chen, W., Han, Y., Agostini, F., Skoczylas, F., Corbeel, D. (2021). Permeability of a macro-cracked concrete effect of confining pressure and modelling. Materials, 14(4), 862. https://doi.org/10.3390/ma14040862 [Google Scholar] [PubMed] [CrossRef]
39. Chen, W., Shan, W., Liang, Y., Skoczylas, F. (2023). Effect of Dry-wet cycles on the transport and mechanical properties of cement mortar subjected to sulfate attack. Fluid Dynamics and Materials Processing, 19(3), 679–696. https://doi.org/10.32604/fdmp.2022.021249 [Google Scholar] [CrossRef]
40. Chen, W., Liu, Y., Sheng, M., Zhang, H., Liang, Y., et al. (2022). Heating rate effect on gas permeability and pore structure of mortar under high temperature. Materials, 15(19), 6505. https://doi.org/10.3390/ma15196505 [Google Scholar] [PubMed] [CrossRef]
41. RILEM TC14-CPC (1972). Modulus of elasticity of concrete in compression (cpc8). Materials and Structure, 6(30), 25–27. [Google Scholar]
42. Zhang, J. Z., Lv, M., Fang, Z. F., Zhang, Y. R., Wang, J. D. (2018). Relationship between pore structure and water/gas permeability of fly ash concrete based on nuclear magnetic resonance method. Journal of Nanchang Institute of Technology, 37(6), 63–70. [Google Scholar]
43. Xue, W. P., Liu, X. Y., Yao, Z. S., Cheng, H., Li, H. P. (2020). Effects of different damage sources on pore structure change characteristic of basalt fiber reinforced concrete. Acta Materiae Compositae Sinica, 37(9), 2285–2293. [Google Scholar]
44. Li, Z. Y., Liang, R. W., Qi, S. H. (2021). Study on modification effect and mechanism of rubber waste on impervious concrete. Yellow River, 43(1), 148–151. [Google Scholar]
45. Qin, Q. C., Li, K. G., Li, M. L., Li, W., Liu, B. (2022). Study on the deterioration mechanism of dolomite microscopic damage based on NMR technique. Chinese Journal of Rock Mechanics and Engineering, 41(S1), 2944–2954. [Google Scholar]
Cite This Article
 Copyright © 2023 The Author(s). Published by Tech Science Press.
This work is licensed under a Creative Commons Attribution 4.0 International License , which permits unrestricted use, distribution, and reproduction in any medium, provided the original work is properly cited.
 Downloads
 Citation Tools