
 Submit a Paper
 Propose a Special lssue
 Open Access
ARTICLE

Breast Cancer Diagnosis Using Artificial Intelligence Approaches: A Systematic Literature Review
College of Computer and Information Sciences, King Saud University, Riyadh, 11451, Saudi Arabia
* Corresponding Author: Duaa AlSaeed. Email:
Intelligent Automation & Soft Computing 2023, 37(1), 939-970. https://doi.org/10.32604/iasc.2023.037096
Received 23 October 2022; Accepted 06 February 2023; Issue published 29 April 2023
 View Full Text
 Download PDF
Abstract
One of the most prevalent cancers in women is breast cancer. Early and accurate detection can decrease the mortality rate associated with breast cancer. Governments and health organizations emphasize the significance of early breast cancer screening since it is associated to a greater variety of available treatments and a higher chance of survival. Patients have the best chance of obtaining effective treatment when they are diagnosed early. The detection and diagnosis of breast cancer have involved using various image types and imaging modalities. Breast “infrared thermal” imaging is one of the imaging modalities., a screening instrument used to measure the temperature distribution of breast tissue, and even though it has not been used as extensively as mammography it demonstrated encouraging outcomes when utilized for early detection. It also has several advantages, as it is safe, painless, non-invasive, and inexpensive. The literature showed that the use of thermal images with deep neural networks improved the accuracy of early diagnosis of breast malformations. Therefore, in this paper, we aim to provide a systematic review of research efforts and state-of-the-art studies in the domain of breast cancer detection using AI techniques. The review highlighted different issues, such as using different imaging modalities and deep attention mechanisms with deep learning (DL), which proved to enhance detection accuracy.Keywords
Diseases in humans are gradually increasing because of personal or environmental reasons, despite the diversity of detection and prevention. Cancer, the most common disease worldwide, is a disorder that affects many body regions and causes cells to grow irregularly. These include cancers of the breast, prostate, lung, skin, and pancreas. Cancers also cause many deaths worldwide [1].
Breast cancer is the most prevalent and leading cause of mortality in women if it is not detected early. The advancement of breast cancer diagnostic and treatment procedures has increased the likelihood of survival. Screening patients using different imaging modalities is one of the treatments frequently used in medicine to identify breast cancer. The imaging modalities include various types such as mammography, magnetic resonance imaging (MRI), ultrasound, computed tomography imaging (CT), and thermal imaging. Various techniques and tools are used in these modalities; expected results depend on different factors, and they are advised to use more than one method to verify the results. Mammography is the most common for breast cancer screening. Although it is called the gold standard, it carries many risks for patients; therefore, in recent years thermal imaging has gained attention due to its low risks, unlike mammography [2]. Digital infrared thermal imaging has not yet been used as the main tool to early diagnose, since it based on skin diseases and temperature [3]. However, promising results show that radiologists can combine it with mammography to interpret the breast’s state for an appropriate evaluation and breast cancer diagnosis.
Many researchers have developed algorithms that help diagnose, predict, and treat important recurrent diseases, such as cancer and heart disease, based on patients’ health records kept in large databases of clinics and hospitals.
The ability to identify and diagnose breast cancer using machine learning (ML) and deep learning (DL) approaches has recently improved due to the massive development of these techniques.
The integration of deep attention mechanisms with DL algorithms is getting more attention in this field as a result of the promising and encouraging results it has achieved [4]. This offers special attention to prominent regions of the image rather than considering all batches as equally essential, enhancing the likelihood of improving the effectiveness of the applied approaches.
Despite advances in breast cancer screening, more research is required to investigate various detection modalities and improve detection accuracy using new ML algorithms with deep attention mechanisms.
In this paper, the authors aim to contribute to the field of breast cancer detection by introducing studies in the field of breast cancer using ML techniques and deep attention mechanisms. This will also highlight open issues in the field.
Following is the arrangement of the remaining sections of this paper. Section 2 provides some background on the subject matter, including breast cancer, medical imaging modalities, and overview of ML and DL methods. Section 3 presents the details of related works on breast cancer detection using Artificial Intelligence (AI) based on the literature, which includes studies conducted using ML and DL, studies conducted using thermal imaging of breast cancer, and studies conducted using deep neural networks (NN) with an attention mechanism. Finally, Section 4 provides a discussion the main open issues, future directions and conclusion.
Cancer is a disease characterized by abnormal cells that spread by infiltrating healthy cells, and it affects different parts of the body [5]. There are many types of cancers, the most common of which are skin cancer, lung cancer, colorectal cancer, prostate cancer, stomach cancer, breast cancer, and cervical cancer [6]. Breast cancer is a disease that specifically affects women. It also affects men, albeit to a much smaller extent. In supporting breast cancer awareness and treatment, doctors have made significant achievements in the early detection and treatment of breast cancer, reducing deaths from the disease [7].
This section briefly gives some background information on breast cancer and the imaging modalities used to diagnose it and highlights the main automatic detection techniques, in addition to a brief outline of attention mechanisms.
Breast cancer occurs due to the excessive condensation of breast cells, leading to the emergence of benign or malignant tumors. Benign tumors usually do not cause breast pain or spread to surrounding tissues; they are left without treatment, unlike malignant tumors that require early detection and treatment. Self-examination is recommended for the early detection of strange differences in the breast. At the same time, the radiologist uses various imaging methods to interpret the state of the breast for the accurate assessment and diagnosis of breast lesions. However, conflicts often occur among specialists during interpretation; therefore, to avoid this conflict, a standard dictionary was produced by the American College of Radiology (ACR) requiring the provision of highly trained medical practitioners and experts. Moreover, this involves a long and boring task. Computer-assisted diagnostic (CAD) systems help radiologists and other practitioners distinguish abnormalities and identify suspicious features in medical images. Accurate information can be extracted from these images through CAD systems and helps to avoid many unnecessary biopsies [8].
According to the World Health Organization (WHO) in 2020 [9], breast cancer is the most common cancer worldwide and represents 11.7% of all cancers. It accounts for 1 in 4 cases of cancer in women and is a major cause of mortality for hundreds of thousands of women each year. In the Arab region, WHO statistics conducted in the Arab region in 2020 showed that breast cancer is the most prevalent among women, representing 49.9% of all cancers. In Saudi Arabia, new breast cancer cases in women reached 3,954, which represents 29% of all cancers, and it is the second most common cause of death, of which 1,095 died, representing 8.4% of deaths. Worldwide, similar figures for breast cancer have been reported. For example, in 2021, new breast cancer cases estimated in the United States 281,551, accounting for 14.8% of all new cancer cases. However, the number of deaths has been estimated at 43,600, representing 7.2% of all cancer deaths [10]. Cancer mortality rates worldwide indicate progress against cancer or survival by improving early detection, raising awareness of breast cancer symptoms, and improving various treatment methods. This has shown significantly low mortality rates throughout the previous years in the United States. [7].
A specific risk factor cannot be identified for the majority of breast cancer patients. Still, many factors have been documented, accounting for 5%–10% of all breast cancer cases in women. These include obesity, alcohol consumption, physical inactivity, hormonal therapy use, high breast density, and hereditary susceptibility to breast cancer [11]. Cancer mortality rates worldwide are the best indicator of progress against cancer or survival by improving early detection, raising awareness of breast cancer symptoms, and improving various treatment methods that have shown significantly lower mortality rates over the past few years in the United States. Since its peak in 1989, the female breast cancer mortality rate has declined by 41% in 2018. As a result, 403,000 breast cancer deaths were avoided during this period. Survival rates for breast cancer patients have increased; the number of deaths associated with the disease has decreased regularly, mainly due to several factors, such as early detection, the use of a new treatment method that considers the individual condition, and a better understanding of the nature of the disease [7].
As mentioned earlier, the diagnosis of breast cancer is mainly through imaging tools or modalities. In the following section, we will highlight the main imaging modalities for breast cancer diagnosis.
2.2 Imaging Modalities for Breast Cancer
There are several cancer associations around the world. Many recommend screening for breast cancer detection and diagnosis and accessing assistance in the early stages. The development of different imaging models helped to increase the chances of life, reduce the need for treatment, and increase the chances of early healing [7–12]. Medical images play a crucial role in diagnosing breast cancer and are the most effective methods. Different models are used, such as: (1) mammography, (2) scintigraphy, (3) MRI, (4) ultrasound, (5) CT, (6) positron emission tomography (PET), (7) histological imaging, (8) microwave imaging, (9) optical imaging, (10) electrical impedance tomography (EIT), and (11) thermal imaging. We will discuss each modality by showing sample images, as follows:
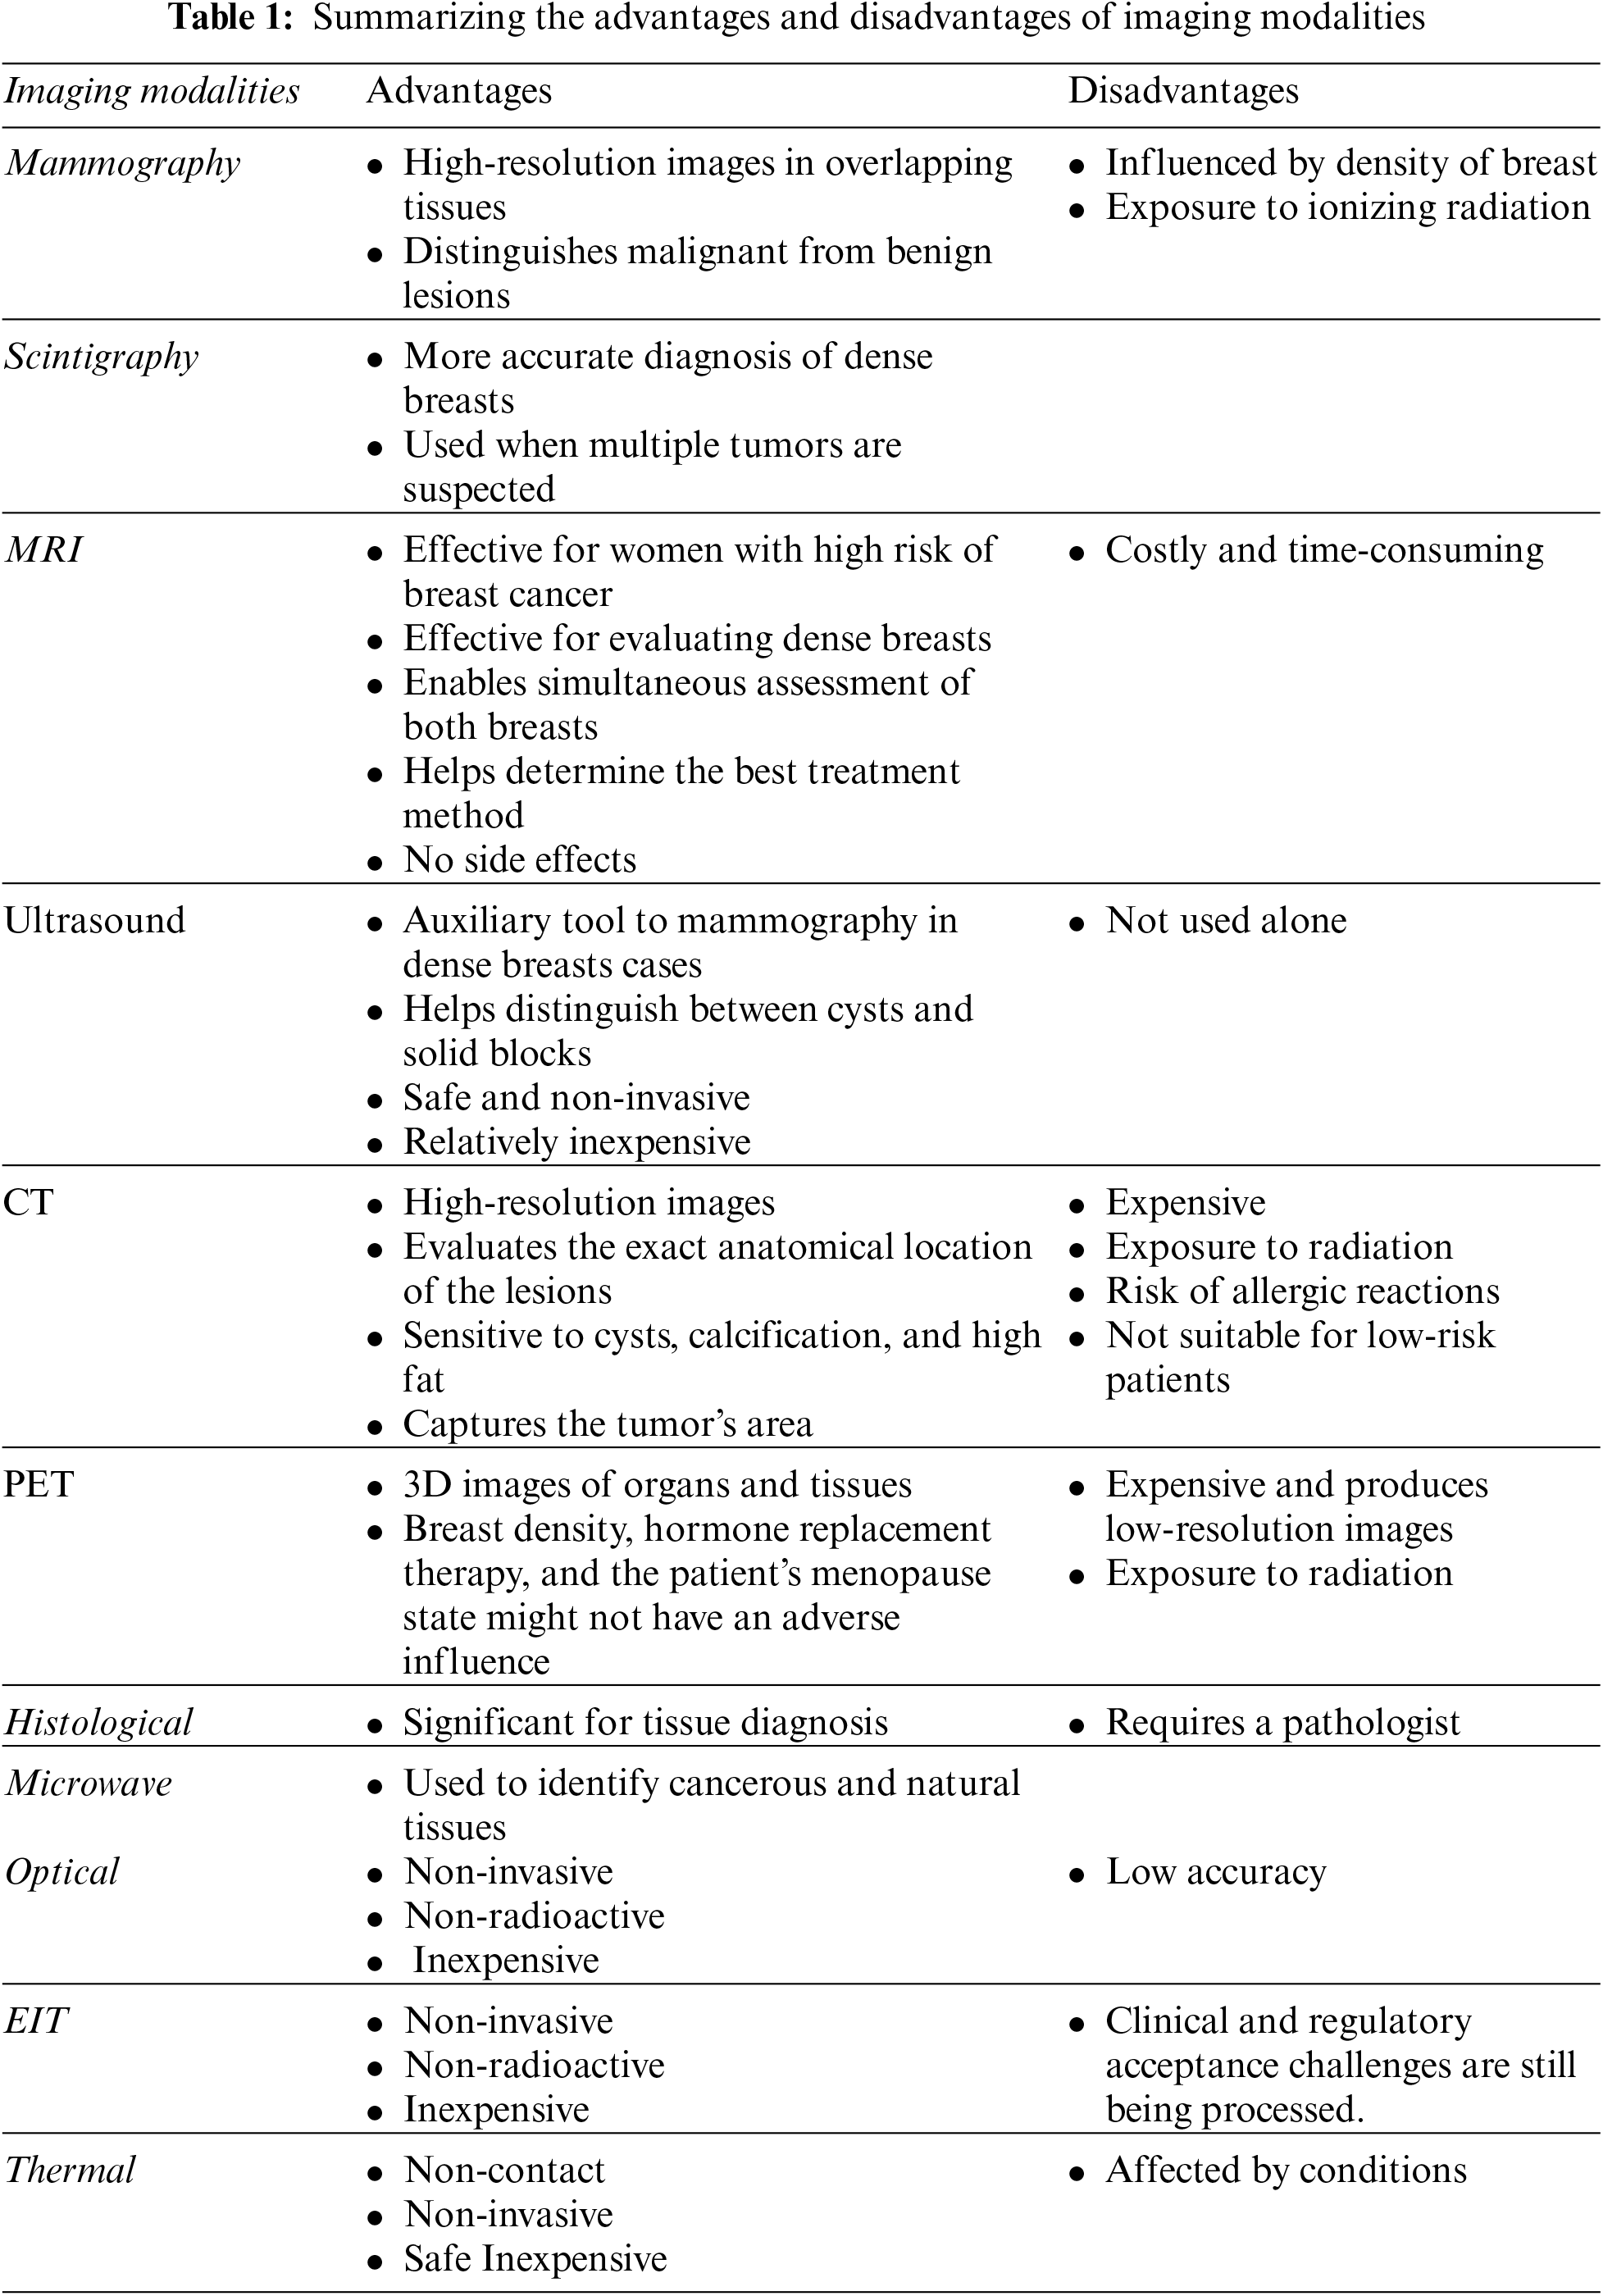
• Mammography is one of the most common ways to detect breast cancer early and is a type of X-ray that generates high-resolution images to diagnose deformities in overlapping tissues [13]. Fig. 1 shows a mammography image. The main task of digital mammography is to distinguish between malignant and benign lesions [14]. The breast is photographed by placing it on a platform in the mammography unit, pressing it to reduce the patient’s movement, and passing X-rays through it to facilitate and take pictures. Mammography is based on varying degrees of absorption of X-rays by the body’s tissues. Fibrous tissues and muscles absorb more radiation than fat, showing glandular tissues, white radial imaging muscles, and fatty gray areas [15]. Ionizing radiation exposure is a major downside of this approach [16]. In addition, mammography is affected by the density of the breast; therefore, the ability to diagnose cancer becomes difficult due to the fibrous fatty tissue in the breast. Studies indicate that breast fat percentage increases with advancing age in women. Adipose tissue in women under 50 years of age has somewhat less effectiveness due to the sensitivity of imaging and its impact on breast density and age [17].
• Scintigraphy imaging is one of the techniques for detecting breast lesions, as shown in Fig. 1. It can depict significant and palpable abnormalities and provide better accuracy for diagnosing women with dense breasts. It is also used when multiple tumors are suspected. A high-resolution breast-specific gamma camera is used to assess ambiguous breast cancer in women at a high risk of breast cancer. Studies show that high-resolution scintimammography could detect small (1 cm) ambiguous and imperceptible lesions that are otherwise undetectable by mammography, or breast and physical examination in women with an increased risk of breast cancer [18].
• MRI is another technique for detecting early breast cancer, as shown in Fig. 1. It uses magnetic fields of hydrogen ions to produce detailed high-resolution 3D images of the breast. The patient is injected with a contrast factor and examined using magnetic resonance in a magnetic field, while a radio frequency wave is applied to create a high-contrast image of the breast [17]. An MRI is helpful for women who have a high risk of developing breast cancer. It has good image accuracy, is effective for evaluating dense breasts, allows for simultaneous evaluation of both breasts, and helps determine whether tumor removal or mastectomy is the best treatment. Furthermore, it has no side effects, because there is no radiation; however it takes a long time, it is expensive and can be used in high-risk cases or to improve tumor diagnosis. Studies indicate that mammography and MRI enhance the likelihood of detecting high-risk early-stage cancers [18].
• Ultrasound imaging can also be used to detect tumors by the ultrasonic bounce from the tissue’s surface (Fig. 1). A transformer interprets reflected waves to determine the boundaries of different types of tissues and displays 2D images. This technique is usually an auxiliary tool to examine suspicious areas of the breast based on mammography or during breast examinations. It helps to distinguish between cysts (non-tumor bags filled with fluids) and solid blocks. Additionally, there is no radiation exposure and breast ultrasound is non-invasive and safe. Ultrasound can be used together with mammography in screening abnormalities, especially in women with dense breasts. A 3D ultrasound can also be used for the breast. This makes ultrasound an attractive supplement to mammography, as it is widely available, relatively inexpensive, and non-invasive. Ultrasound can improve screening sensitivity while reducing specificity and the need for biopsy [17]. Although ultrasound in women who do not show symptoms causes false and unacceptable negative and positive results, ultrasound should always be used with mammography or other imaging techniques because used alone, it will not detect lesions accurately. Advancements in ultrasound technology include 3D ultrasound that formats sound wave data into 3D images, automated ultrasound for a good overall view of the breast, Doppler ultrasound, and sonoelastography [18].
• CT purification of the breast details breast anatomy to produce high-resolution images and evaluate the exact anatomical location of the lesions, and is considered more sensitive to cysts, calcifications, and high fat; therefore, the scope of CT analysis outperforms the image of mammography (Fig. 1). However, CT scans are expensive, have radiation exposure, and may cause an allergic reaction risk compared to other techniques [19]. In addition, it is unsuitable for the early diagnosis of low-risk patients [20]. The tumor’s location is better captured using CT scans, which can be used as hybrids with PET technology that indicates a malignant or active tumor in metabolism based on glucose absorption. A combination of the two techniques is useful for identifying possible cancer stages [18].
• PET is a technique for imaging in nuclear medicine. It is commonly used for detecting breast cancer. In this medical imaging technique, a pair of gamma rays emitted from radionuclides enter the human body to produce 3D images of organs and tissues (Fig. 1). Glucose metabolism in malignant tumors increases compared to normal cells. Thus breast cancer can be diagnosed through PET images that show the variation of cancer cells from normal cells. The PET used in mammography is known as positron emission mammography (PEM). It has been reported that PEM may not be adversely affected by breast density, hormone replacement therapy, or the patient’s menopause status. However, PET is expensive and produces low-resolution images. Moreover, the patient is exposed to radiation. PET has been used frequently to predict treatment responses in many cancers [18].
• Histological imaging is a technique for diagnosing breast cancer in microscopic tissue images of biopsies, (Fig. 1). However, with the progress of techniques in this field, tissue diagnosis is critical. Nevertheless, it takes a long time and requires a pathologist to develop an analyze the tissue images [21].
• Microwave imaging detects breast cancer using microwave imaging technology. Waves of shorter wavelength than radio waves, penetrate the breast tissue and identify cancerous tissues and normal tissues (Fig. 1). In recent decades, biosensors have gained considerable attention; through the microwave sensor and their specifications, the quality of the microwave image is determined [20].
• Optical imaging uses the near-infrared system (NIR) and is a non-surgical technique for distinguishing between normal breast tissues and cancerous tissues. Optical imaging of the breast is shown in Fig. 1. In some cancers optical imaging is based on the ratio of Hegelian and oxygen saturation. Optical imaging technology is considered non-invasive, non-radioactive, harmless to the patient, and inexpensive. However, it has a low accuracy in diagnosing breast cancers and presents spatial accuracy issues [20].
• EIT is one of the emerging ways to diagnose breast cancer. However, it is still undergoing clinical and organizational acceptance processes [22]. Fig. 1 shows an example of an EIT image. The imaging device is a portable adapter and a computer screen to display the image of the breast. small currents are applied to the breast through conductive electrodes connected to the skin. The resulting electrical voltage is measured to distinguish the cancer tissues from natural tissues based on the theory that cancer cells have higher conductive values. EIT is non-invasive and does not emit ionizing radiation; therefore, it is considered safe for pregnant women. In addition, it is not expensive in terms of cost [23].
• Thermal imaging: Breast lesions cause changes in skin temperature that have physiological and thermal properties, such as blood flow rate and metabolic thermogenesis. Analysis of surface temperature distribution can predict breast tumor size and location [12]. Through thermal imaging of the breast, as shown in Fig. 1, it is possible to obtain thermal distribution using liquid crystals, which were common, or infrared radiation, which has recently received much attention and development [24]. Thermal imaging is a non-contact, non-invasive, and safe method for pregnant women and young women with dense breasts [16]. It is inexpensive and has encouraged research to fill the need in countries where it is difficult to provide other financially expensive techniques. Infrared thermal imaging uses the infrared radiation emitted by an object to measure the thermal radiation emitted by surfaces with a temperature higher than this value (i.e., 0 K or –273 1°C) [25]. During the examination, the patient is asked to stay in a temperature- and humidity-controlled room for 15 min to adapt and balance the body’s temperature to reduce external influences that may cause changes that may affect the examination results [26]. The images consist of different colors, depending on the heat distribution, as carcinoid tumors are usually high in metabolic heat compared to normal tissues. To interpret thermal images of the breast, doctors typically use asymmetry analysis. Cancer tissue can be detected based on the analysis of asymmetric temperature patterns for each chestwith the help of elevated temperatures [27]. However, the low variation in normal tissue causes difficulties distinguishing malignant masses from benign masses [14]. Infrared systems have many advantages for checking temperature, other than their cost and the sensitivity and accuracy of the thermal sensors or thermal cameras used [28]. Thermal cameras that have a resolution of 640 × 480 pixels and better sensitivity can detect a minute difference in temperature [29]. Because of advanced infrared cameras (IR) and the development of image processing and ML algorithms in the field of AI to investigate breast heat, the accuracy of thermal imaging has improved significantly and enhanced the role of thermal imaging as an effective and automatic tool in the early detection of breast secretions [2]; therefore the research field of thermal imaging for breast cancer detection has become active.
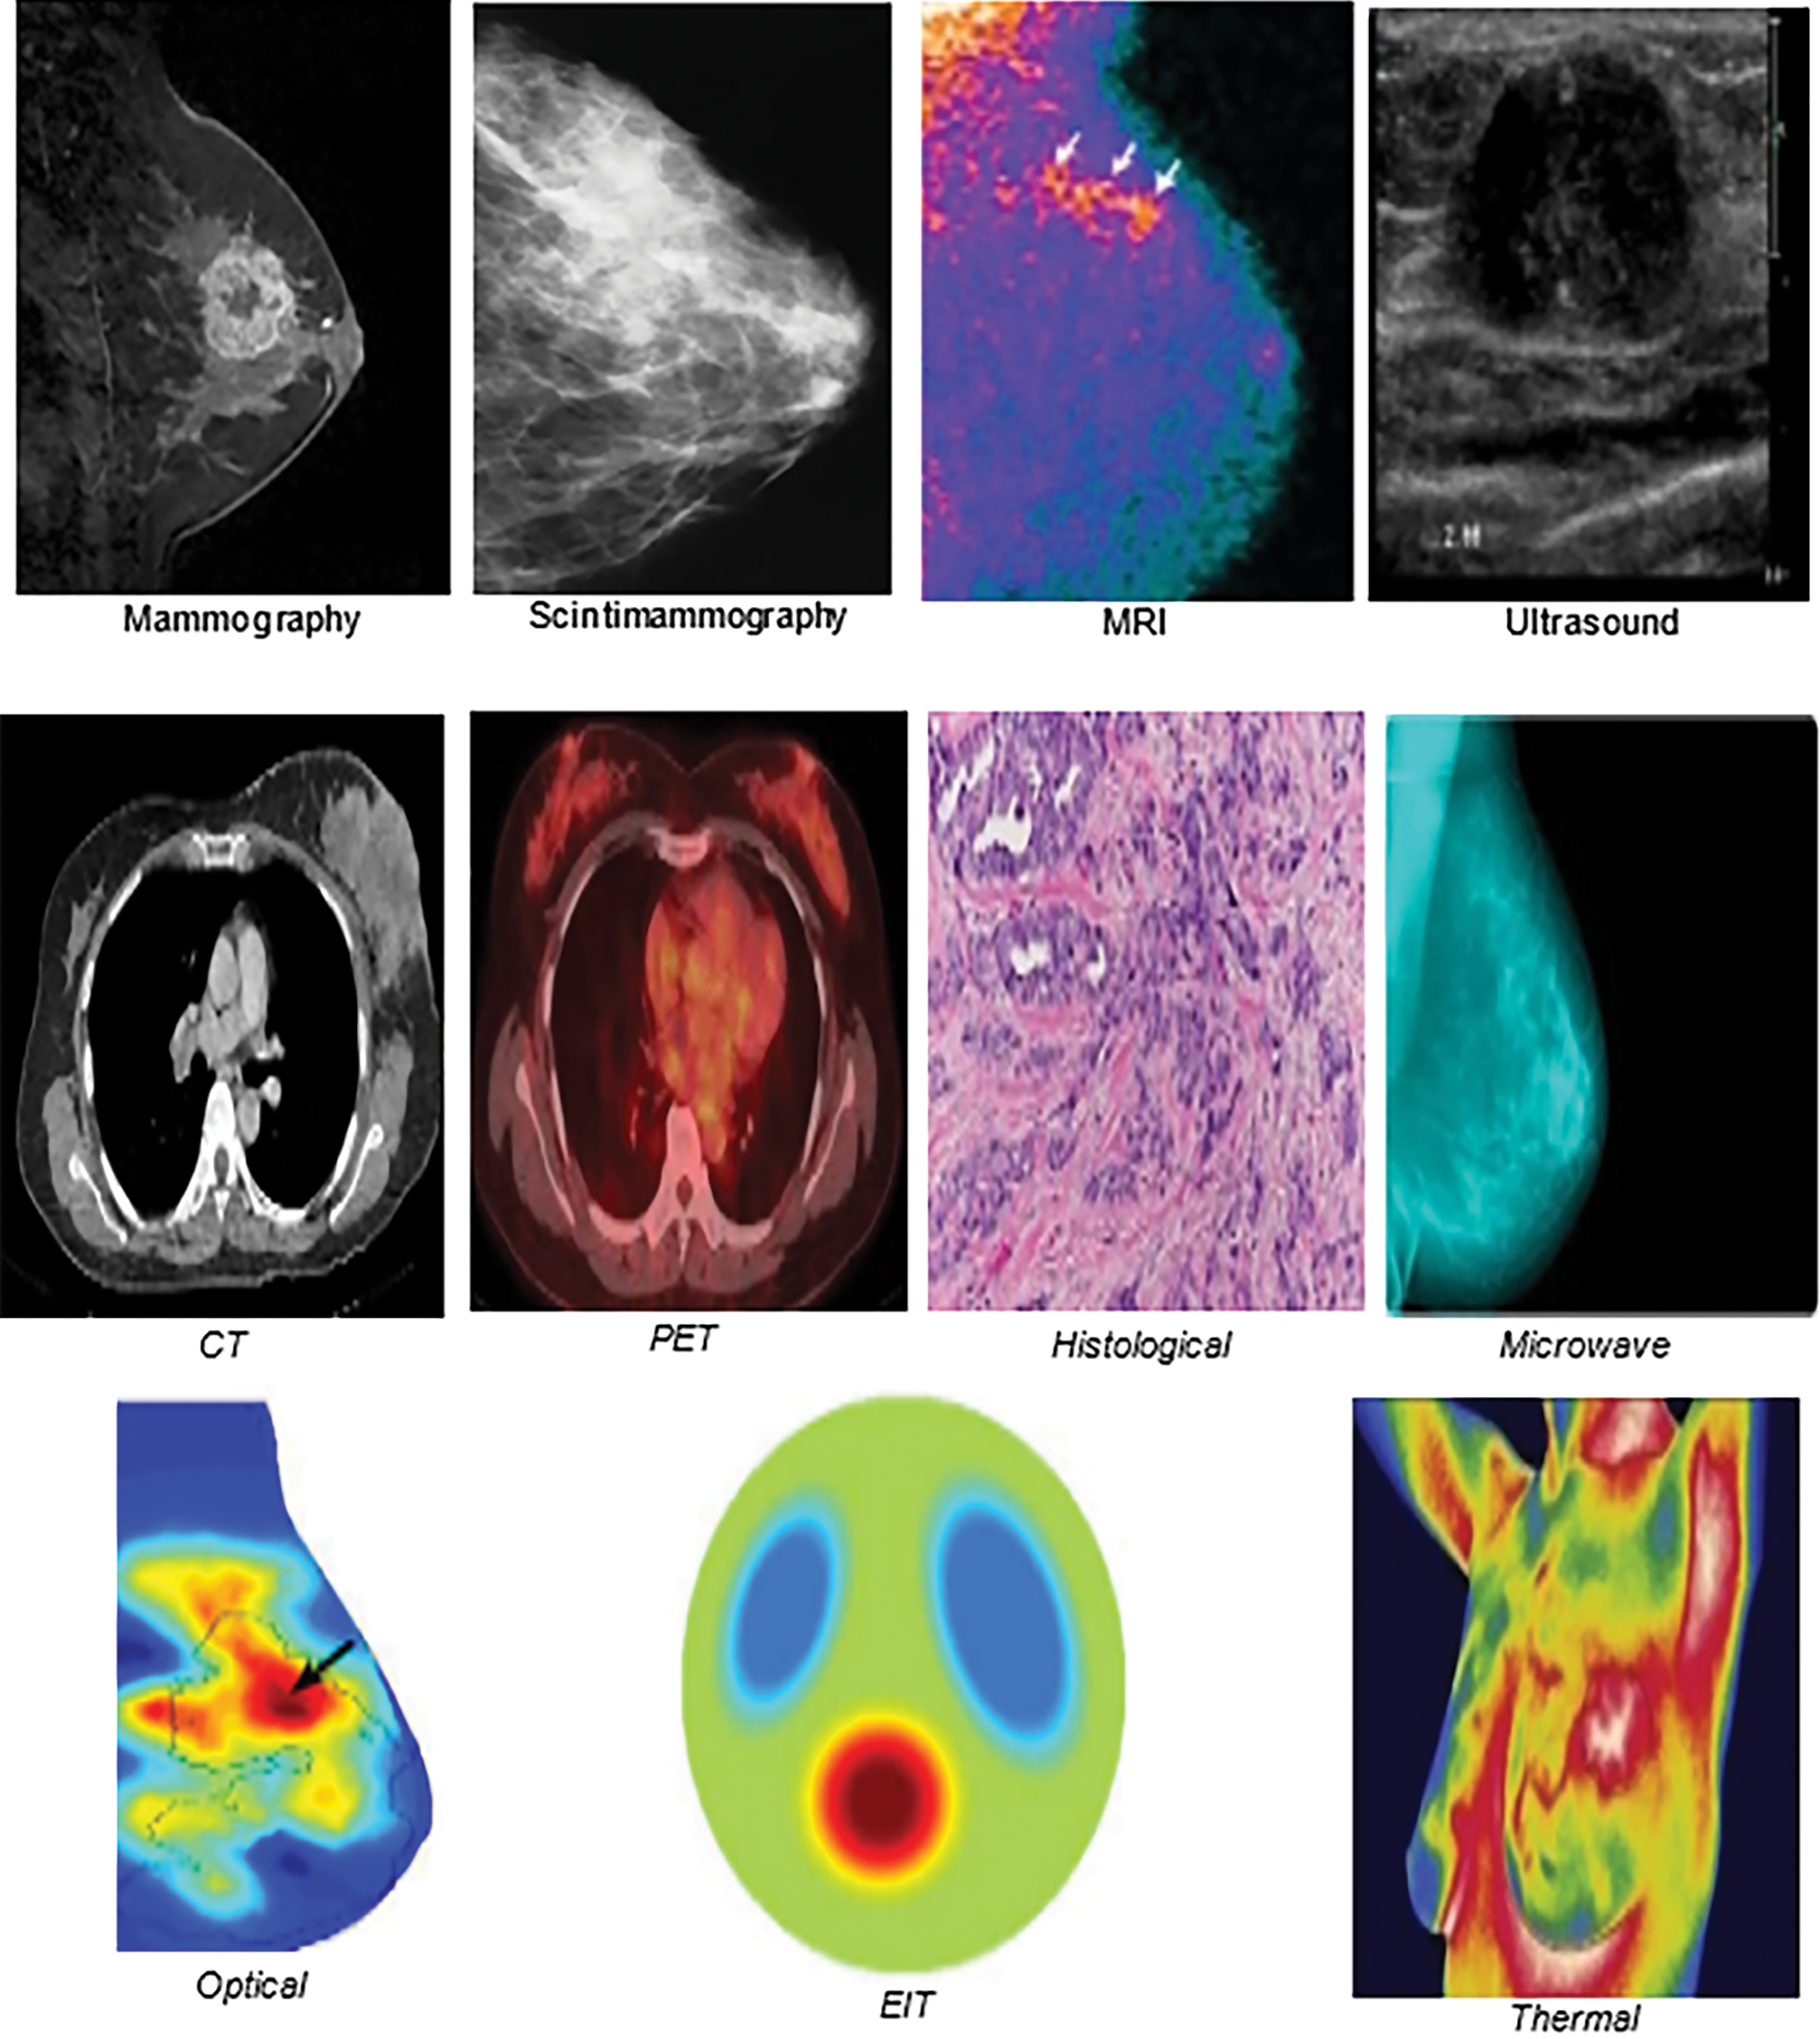
Figure 1: Samples of imaging modalities
In conclusion, many imaging models have been developed to detect breast cancer, each with its main advantages and disadvantages, summarized in Table 1; however, they still contribute effectively to early diagnosis. The most commonly used method is mammogram imaging, but it hurts patients, exposes them to ionizing radiation, which increases the risk of cancers, and is expensive in terms of cost [30]. Due to these issues, other alternative techniques have been developed. One of these alternatives is thermal imaging, which does not produce any radiation, and it is low in cost, making it safe for frequent use. Active research and improvements in infrared detectors have encouraged further research in this area. Radiologists are primarily responsible for reading, analyzing, and diagnosing imaging modalities. As with humans, radiologists may make errors in image interpretation, resulting in a misdiagnosis or missed diagnosis, which can be avoided by incorporating AI solutions. CAD has been implemented to prevent human error. A suitable ML algorithm completes the processing and analysis of an image in CAD systems [31]. In the following section, we will briefly discuss the main ML algorithms and techniques.
ML is a subset of AI that allows systems to learn and enhance automatically from experiments without needing to program them explicitly using a dataset as experiences, instructions, or examples during training to assist in analyzing and extracting meaning from data [32]. The results help in classification, prediction, and detection, especially in the medical field. However, AI innovations can be categorized into two categories: conventional ML and DL.
Conventional ML algorithms are used to build a model based on sample data, known as training data. Some of the well-known algorithms are: support vector machine (SVM), discriminative analysis, naive Bayes classifier and decision tree (DT) [33]. These algorithms have enhanced the development of many applications to run automatically and provide many advantages that have effectively contributed to the performance of these applications. However, the performance of conventional ML algorithms was outperformed by an advanced type of ML algorithm, DL [34].
Understanding the latest advancements in AI and ML can seem overwhelming. However, AI innovations can be categorized into two: conventional ML and DL. In the following subsections, we will highlight these two categories.
Conventional ML algorithms are classified into four main categories, as shown in Fig. 2, which are supervised learning, unsupervised learning, semi-supervised learning, and reinforcement learning. Each type of conventional ML algorithm has its own requirements and applications. Next, we will briefly discuss these types:
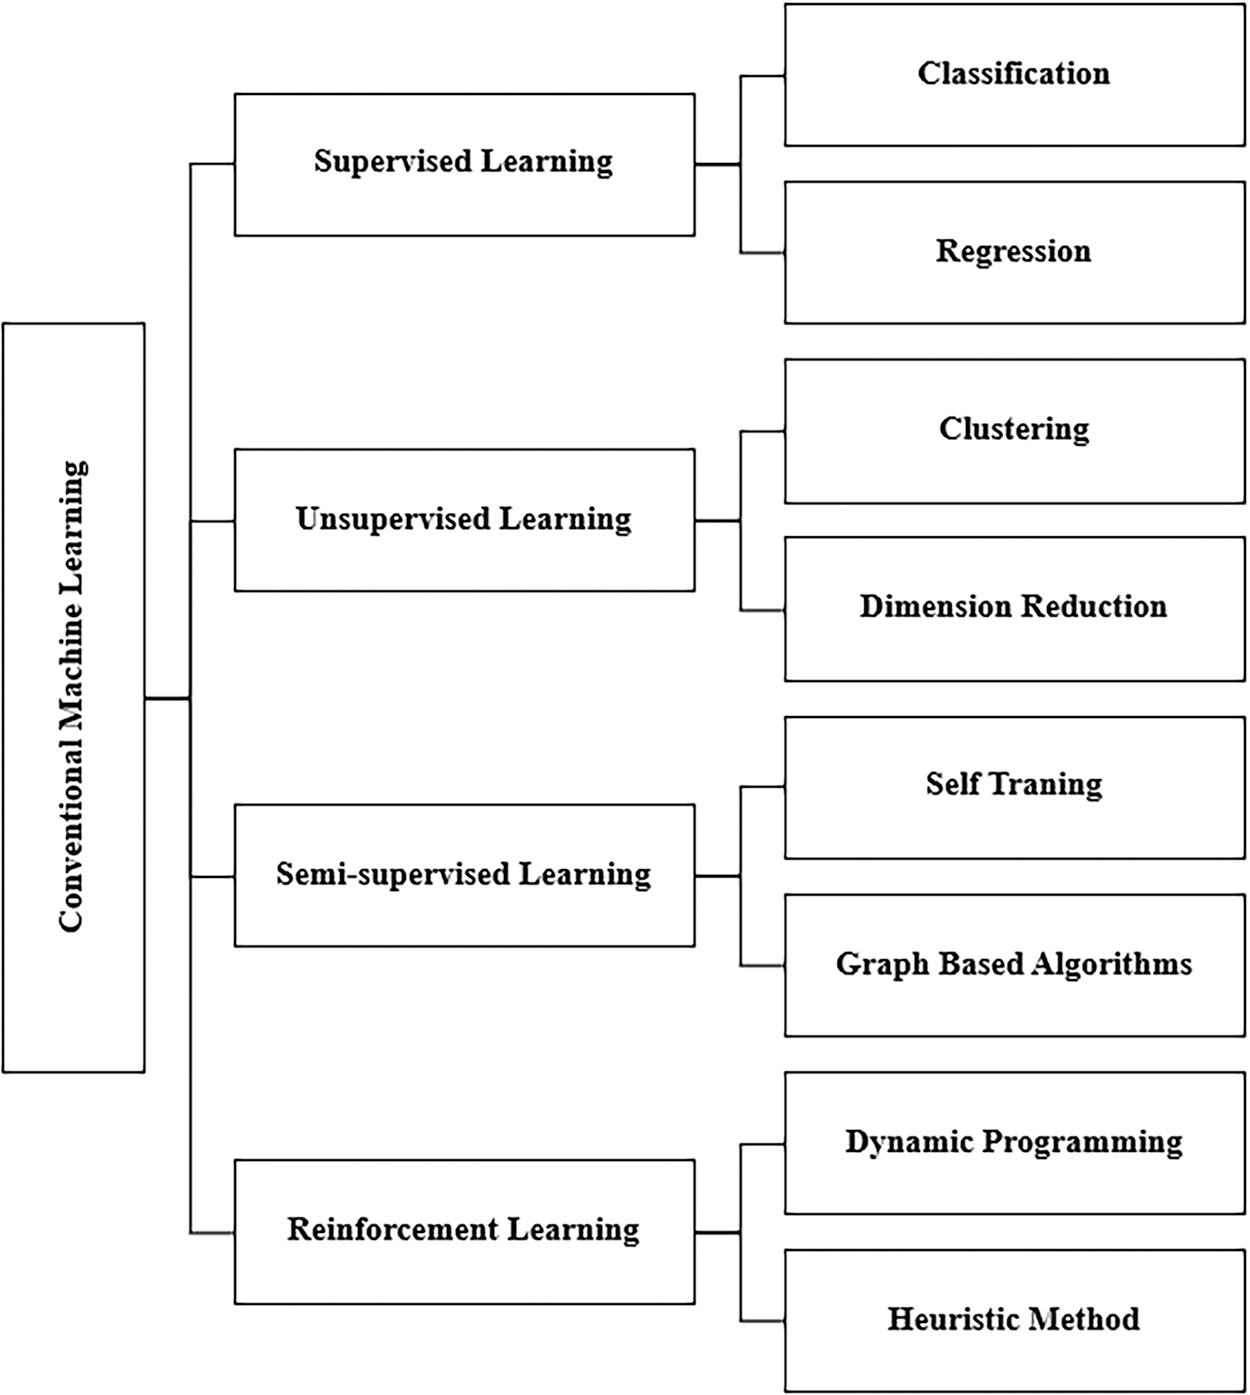
Figure 2: Basic types of conventional ML
• Supervised learning algorithms: In ML, supervised learning algorithms attempt to model relationships and dependencies between the target prediction output and the input features to predict output values for new data based on the relationships learned from previous data sets [35]. They have pairs of inputs and outputs known as labeled data, which help identify traits or variables to train the system to predict desired outcomes based on the stored pattern [36]. The main techniques in this category of ML are classification and linear regression techniques. Classification is used in many fields, most notably the medical field that classifies patients’ pre-diagnosis of a specific disease based on data analysis and pattern recognition. The most common classification techniques are logistic regression (LR), SVMs, random forest (RF), and NN. Linear regression is used to predict and find relationships between numerical data [35].
• Unsupervised learning algorithms: This type of ML algorithm works with predefined unlabeled data with only input and no idea of the expected outcome. The system trains unlabeled data to discover a pattern on its own without external guidance [37]. Clustering is a common unsupervised learning technique that can collect anonymous data using algorithms, one of the most popular of which is K-means. Its application is market research by learning customers’ buying habits [38].
• Semi-supervised learning is an ML technique that gathers many unlabeled data and few labeled data for training, increasing the accuracy of learning from the data. Semi-supervised learning fell between unsupervised learning (with unlabeled training data) and supervised learning (with only labeled training data), which is a particular case of weak supervision. Semi-supervised techniques can be used for both clustering and classification techniques. The data structure is discovered and learned through the input variables using clustering techniques and the prediction of unfair data using classification techniques, then feeding that data back into the supervised learning model as training data [39].
• Reinforcement learning (RL): These algorithms repetitively interact with the environment to continue the learning process over a long period. All possible system states are learned through their interaction with the environment, and ideal procedures are taken in proportion to the current situation to improve performance. Common algorithms used for RL are Q-Learning, time difference (TD), and deep adversarial networks. Typical applications in this technology are games in which the system is an opponent for the user and self-driving cars [34].
The development of several apps that run automatically and offer various benefits has been facilitated by conventional ML algorithms, which have significantly improved the performance of the medical areas [40]. However, conventional ML algorithms have been outperformed by an advanced type of ML algorithm, DL. The following subsection will highlight some DL algorithms.
DL is a branch of ML that cares about artificial NN revolving around learning multiple levels of representation and abstraction that help understand data, such as images, sound, and text [40]. The handling of massive data by DL algorithms is effective, other than small data. In the literature, DL approaches from several categories have been used and are shown in Fig. 3. Four of the main DL algorithms are: convolutional neural networks (CNNs), recurring neural network (RNN), generative adversarial networks (GANs), and deep autoencoders (AUD). We will briefly discuss each type as follows:
• CNN: This is an effective DL technique for image-based classification and recognition tasks for supervised learning. A CNN is made up of many layers that are assembled on top of each other. This contains convolutional layers, pooling layers, and fully connected layers, each of which performs a distinct function. The correct input is given to the CNN during training, and the parameters are determined layer by layer to generate the desired result. The convolution layer determines the existence of particular features or patterns in the input data, and various filters can extract multiple features. In contrast, the pooling layer decreases the feature map and network parameter size. The fully connected layer, which is the final step, links neurons with all of the preceding layers’ neurons to provide crucial outcomes, such as the category scores in a classification task [41].
• RNN: This is a supervised learning approach specializing in discovering patterns in time series data and solving sequential data problems. It has become an appropriate option for processing chronology and natural language. It is used in medical tests in which information can only be understood by analyzing time values, such as biomedical signals. The essential feature of RNN is that it has memories, which means RNN captures previous information from previous inputs and then affects current inputs and outputs. RNN imposes the same processes on each element, so it is repetitive. The inputs and outputs of traditional deep NN are independent of each other, while RNN relies on previous elements within the sequence. Long short-term memory networks (LSTMs) are the most popular RNNs [42]. LSTM overcomes the memory problems of RNN for long-term learning through a memory capable of maintaining a state over long periods of time. LSTM consists of 3 layers, an input layer, a recurrent hidden layer, and an output layer, where the hidden layer is the main innovation. The LSTM network can only record information in a one-time direction, whereas the bidirectional LSTM (BLSTM) has a bidirectional memory channel that can process the input sequence forward and backward to capture the previous and future features [43].
• GANs: This is a semi-supervised learning architecture comprising two NN, a generator and a discriminator. They operate in opposing directions, striving to create phony samples that are “as similar as feasible” to actual samples. The generative network produces synthetic outputs, such as images, which seem realistic and difficult for humans to distinguish. In contrast, the discriminative network compares them with the original inputs, such as authentic images, to determine whether they are real or fake. By following this process, both models improved their performance [44].
• Deep AUD): an unsupervised learning approach with the same input and output as a particular type of feed-forward NN, consisting of two chained blocks [45]. The first block decodes by reducing the input data size to bring out the features that distinguish the single data into a small piece of data called a token. The second block is a decoder that combines symbols to reconstruct the input data. The input patterns are gradually encoded and decoded throughout the process [46].
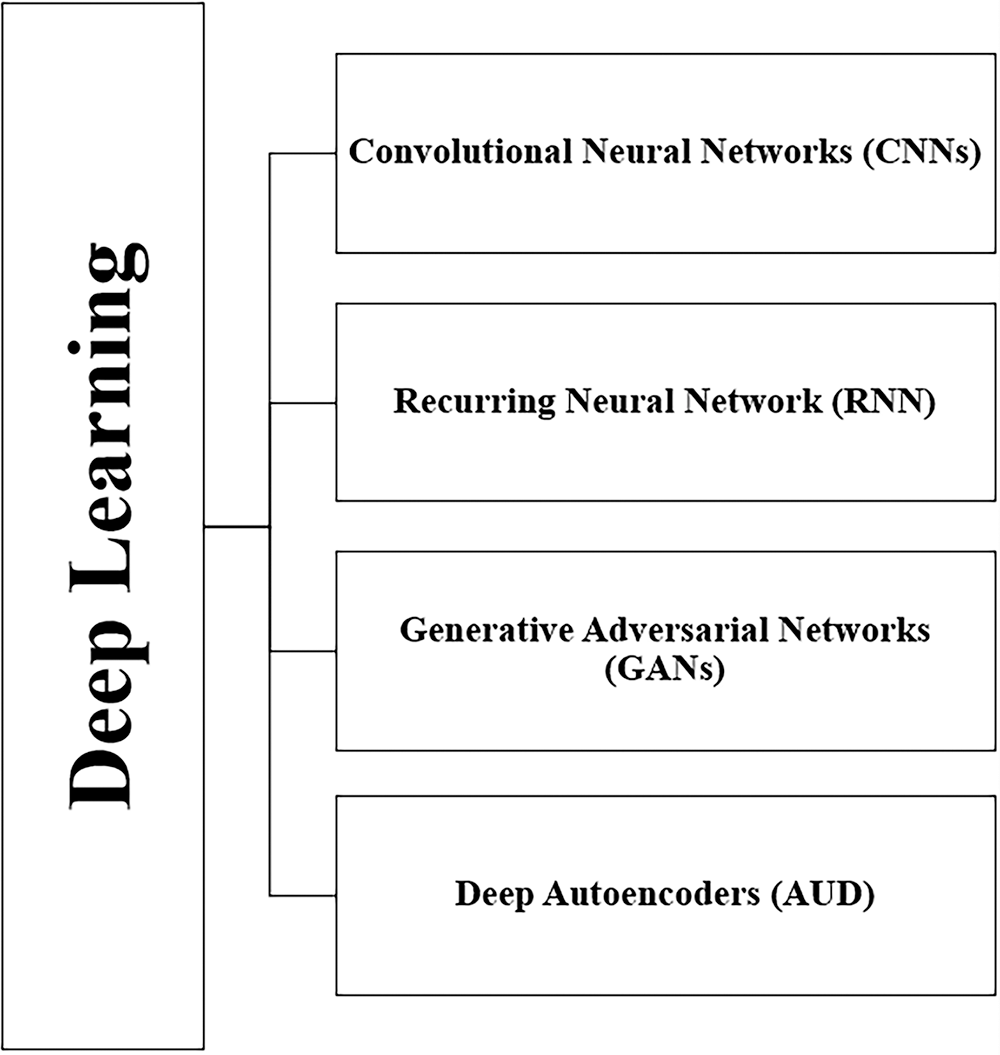
Figure 3: DL techniques
In conclusion, superhuman accuracy techniques developed by DL have transformed computer vision in various applications. Several prominent techniques to image processing and classification that have increased performance, particularly in the medical domain, have been discussed. Even though DL has improved the performance of developed models, this performance can be further enhanced by employing some attention mechanisms. The attention mechanism has been one of the most valuable breakthroughs in DL research in the last decade. As we know, DL techniques mimic the way the human brain works, and attention techniques mimic human cognitive attention. In the following section, we briefly overview deep attention mechanisms.
• Attention Mechanisms: Usually, ML algorithms, when applied on images, will give equal importance “attention” to all patches of an image and will not give special attention to prominent areas. On the other hand, incorporating attention mechanisms with ML will focus on the most prominent areas of the image, increasing the possibility of improving the performance of the applied techniques. The ability to extract the most pertinent information for each part of the outcome and suppress or entirely disregard irrelevant information is improved by the attention mechanism, which can also highlight the most important parts of the input data. As a result this leads to an improvement in the output quality that is generated dynamically. The attention mechanism was provided for the first time for machine translation and then became utilized in NN, which obtained a rapid development in image processing, answering questions and machine translation [47]. There are three main types of attention mechanisms:
• Soft Attention: Categorical distribution is calculated using a set of element. The weights created by the resultant possibilities, which account for the relative relevance of each element, are then utilized to create context-aware encoding, which encodes the weighted sum of all elements [48]. Given the interdependency between the deep neural network’s mechanism and the target, it determines how much focus should be given to each input element by giving each one a weight between 0 and 1. The attentional model as a whole is deterministic and differentiable since the weights in the attention layers are calculated using softmax functions. The flexibility of soft attention allows for both temporal and spatial actions. The spatial context’s primary purpose is to extract the features or weight of the essential features. Since samples taken at different times contribute differently, it modifies the weights of all samples in sliding time windows for the temporal context. Although they are predictable and differentiable, soft mechanisms have a high processing cost [49].
• Hard Attention: A subset of elements are selected from the input sequence. The weight assigned to an input element in hard AMs is either 0 or 1, forcing the model to concentrate only on the critical elements and ignore all rest. Due to the input elements being either observed or not, the goal is non-differentiable. A sequence of decisions must be made on which aspects of the process to focus on. For instance, in the temporal context, the model pays attention to a portion of the input to gather information while deciding where to focus in the next stage, depending on the known information. A neural network could make a decision based on this information. Since there is no ground truth to indicate the ideal selection policy, hard-attention mechanisms are represented by stochastic processes. Models with hard attention must be trained using reinforcement learning techniques since they cannot be differentiated [49].
In actuality, many tasks in natural language processing only need sparse tokens from extensive text input. These tasks benefit from hard attention because they can overcome soft attention in long sequence limitations [48]. Unlike soft mechanisms, the whole input is not stored or processed; thus, inference time and computing costs are decreased [49].
• Self-Attention: The interdependence of the mechanism’s input elements is measured since it enables interaction between the input and the other “self” to determine what it should pay more attention to. One of the essential benefits of the self-attention layer over soft and hard mechanisms is its parallel computing capability for a long input. To verify that all the same input elements are being paid attention to, this mechanism layer performs straightforward and efficiently parallelizable matrix calculations [49].
• Transformer: In the current DL stack, transformers are a dominant influence. Transformers are widely used and have had a significant influence on a variety of domains, including language learning and image processing.
Transformer is a frame structure that contains encoders and decoders. The encoder processes the input repeatedly, and the decoder does the same as the encoder’s output.
Layers are uniformly connected to construct the encoder and decoder. One of the main characteristics that distinguishes transformer models is the self-attention mechanism. A relevance-based pooling operation links all tokens in a sequence in the mechanism, which may be considered a graph-like inductive bias. To achieve the output, the encoder and decoder employ attention mechanisms to weigh each input, determine its relevance, and pull information from them accordingly [50].
According to the literature, the metrics commonly used for evaluating binary ML classifiers and in medical applications are the four entries in the confusion matrix [51]:
When evaluating multi-class classification methods, some metrics have varying interpretations in context. However, multi-class settings still apply the underlying principles.
True positive (TP): This is a result where the model effectively predicts the positive labels.
True negative (TN) is a result in which the model effectively predicts the negative labels.
False positive (FP): is a result in which the model inaccurately predicts the positive labels.
False negative (FN): is a result in which the model inaccurately predicts the negative labels.
Accuracy is the proportion of samples in the assessment dataset that were correctly classified to all samples. This metric is one of the most often utilized in ML applications in medicine, but it is also notorious for being deceptive in the situation of varied class proportions, since it is simple to get high accuracy by just classifying all samples into the most prevalent class.
Sensitivity, also referred to as the recall or true positive rate (TPR), indicates the proportion of positive samples that are correctly classified. It is calculated as the ratio between the proportion of positive samples that are correctly classified and the total number of samples assigned to the positive class. Since it is intended to overlook as few positive instances as possible, which corresponds to a high recall, this metric is considered to be among the most significant for medical investigations.
In contrast to sensitivity, specificity measures the percentage of negative samples that are properly classified.
Precision indicates the proportion of correctly retrieved samples that are relevant, and it is determined as the ratio of samples that were accurately classified to all samples assigned to that class.
The F1-score is regarded to be a more accurate measure of the classifier’s effectiveness than accuracy. It combines the two opposing criteria of sensitivity and precision to calculate a model’s prediction performance.
Area under the receiver operator characteristic (ROC) curve and area under the curve (AUC): proportion of subjects correctly classified, sensitivity, and specificity. Overall accuracy is sometimes expressed as the area under the ROC curve (AUC) and provides a useful parameter for comparing test performance [52].
A review of recent studies on the diagnosis and detection of breast cancer is presented in this section of the paper. In the first part, we will review studies conducted using ML and DL, while the second part covers studies conducted on breast cancer detection using thermal imaging. In the last subsection studies conducted using deep NN with an attention mechanism are discussed.
3.1 Studies on Breast Cancer Detection
In the past few years, a large amount of literature has been conducted applying ML algorithms. One of the uses of ML is to diagnose breast cancer. Numerous studies have argued for ML algorithms to detect and classify breast cancer with different imaging modalities.
The authors proposed in [53] used local quinary pattern (LQP) to feature extraction and SVM to classify 322 and 206 mammograms from the Mammograms Image Analysis Society (MIAS) and InBreast datasets, respectively. To evaluate the performance of the approach, the authors used a ten-fold cross-validation scheme in which the images were randomly divided into 90% for training and 10% for testing and repeated 100 times. The proposed approach produced higher MIAS scores of 86.13% accuracy, 80.67% sensitivity, 92.81% specificity, and 89.92% AUC, which were compared with recent literature and showed competing results. A different study using the same previous classifier [54] have proposed Hough transform to detect the features of 95 images from the MIAS dataset. The data split into equal sizes were trained and tested, which showed effective results with an accuracy of 94% compared to other classifiers such as Linear Discriminant Analysis. The results show that using an SVM classifier with Hough transform to extract features has higher performance than LQP.
Using SVM was also proposed in [55], where authors conducted a study on 153 RIDER Breast MRI database images, split into 64 for training and 89 for testing. It showed a result of 98.03% accuracy, 96.42% sensitivity, and 96.72% specificity, and this proposal achieved higher accuracy than the literature mentioned.
Authors in [56] worked on detecting normal, malignant, and benign conditions in 90 mammography images taken from the mini-MIAS dataset using non-linear multi-class SVM. The data were divided into three categories. Each category contained 30 cases, randomly split into two subgroups; one set of 10 samples representing 33% was selected as training data, while the other set of 20 samples representing 67% was used as test data. The proposal achieved an excellent accuracy of 92.5% when classifying benign from malignant cases, compared to modern classification methods.
In the study [57], authors investigated the classification of 120 mammography images from MIAS into natural and abnormal images at early stages using a KNN proposed algorithm, with a classification of 92% accuracy.
KNN has also been used in [58] for the binary classification of tumors (benign and malignant) for 100 mammographic images extracted from the mini-MIAS dataset. The results at different k values were compared when the k = 5 value with cross-validation when fold = 5 showed a 91.8% accuracy, while k = 15 without cross-validation also showed the same accuracy of 91.8%.
In [59], three of the most well-known ML algorithms (KNN, SVM, and DT) have been trained on mammography from the MIAS dataset. The performance of the three classifiers has been compared based on methods of extracting image features using LBP, Tamura, wavelet, and discrete cosine transform (DCT); KNN has provided 100% specificity and sensitivity in most cases, but it takes longer processing time compared to others.
On the other hand, a voting classifier was developed in [60], consisting of KNN, DT, and gradient boosting, to classify 322 mammograms as normal or abnormal extracted from MIAS. The voting classifier performs very well as it combines the competencies of individual classifiers with performs superior to them, with an accuracy of 85%.
Recently, many DL techniques have been developed to overcome the challenges of ML, such as dealing with a large dataset, achieving high performance on it, and extracting features automatically. Several studies have been conducted proposing DL techniques to improve the accuracy of detecting and diagnosing breast abnormalities.
In the study [61], the author used 400 mammograms from a local image dataset to train the proposed model. They used CNN deep features and unsupervised extreme learning machine (US-ELM) clustering for mass detection. They then built a feature set that fuses deep, morphological, texture, and density features. Finally, they developed an ELM classifier using the combined feature set to classify benign and malignant breast masses. The proposed model achieved high results of 86.50% accuracy, 85.10% sensitivity, and 88.02% specificity compared to SVM based on multiple features.
A hybrid method using CNN and LSTM was proposed in [62] to classify 7,909 histological images extracted from the BreakHis dataset. Features were extracted using a proposed model fed into Sofmax and SVM for the decision stage. The dataset contains four sets of images depending on magnification factors of 40×, 100×, 200×, and 400×. The best precision of 96% was achieved with a 40× dataset, and the best accuracy was 91% with 200×.
In the study [63], the following four CNN models, CNN-2, CNN-2d, CNN-4, and CNN-4d were built to study the effect of depth and hidden layer structure on model performance in classifying abnormalities in mammogram images extracted from mini-MIAS. A total of 547 images were used, including 275 benign and 272 malignant images, for training and 137 images, including 73 benign and 64 malignant, for testing. The CNN-4d model has the greatest performance among the four suggested models, as evidenced by its sensitivity of 90.63%, specificity of 87.67%, and accuracy of 89.05%.
The authors of presented a novel CNN architecture influenced by the U-net topology of the two CBIS-DDSM mass and macrocalcification mammography datasets [64]. The entire dataset of 603 macrocalcification images and 692 mass images were trained, while 152 and 202 were tested, respectively. The model was 94.31% accurate.In another study [65], a CNN-based approach was proposed to classify 285 hematoxylin- and eosin-stained histological breast images from the BIOIMAGING 2015 dataset into four classes: benign lesion, normal tissue, in invasive carcinomas, and situ carcinoma. They also proposed the same model to classify the same images into two classes: carcinoma and non-cancerous carcinoma. From the dataset, 249 images were used for training and 36 images were used for testing. The model achieved an accuracy of 77.8% for four classes of a task, 83.3% for two classes of a task, and the sensitivity of the proposed method for cancer cases was 95.6%.
A CNN with nine layers was proposed in [66] to classify over 9,000 mammograms from a teaching hospital in Taiwan. From that dataset, 70% were used for training, 10% for verification, and 20% for testing. In the dataset test, the model’s accuracy was 82.3%. The sensitivity, specificity, and F1 scores of an image preprocessing approach were 91%, 57%, and 88%, respectively. The sensitivity, specificity, and F1 scores were 79%, 0%, and 88%, respectively, without the image preprocessing approach.
Proposed model based on CNN architecture in [67] to classify breast cancer (benign/malignant) using 7909 histopathological images extracted from the BreaKHis dataset. To evaluate the performance of the model, the data were divided into 70% for training and 20% for testing. The model achieved an accuracy of 91.4%, a sensitivity of 96.8%, and a specificity of 89.4%.
In another study [68], authors proposed a model named BC-DROID that enables a one-step automatic detection and classification using CNN. They trained the model using 10,480 complete mammograms extracted from DDSM data, obtained an AUC of 92.315%, a detection accuracy of 90%, and a classification accuracy of 93.5%. The classification performance of this model was compared with [67,69–72] based on AUC, and the result showed that BC-DROID was the best.
A 3D deep CNN model (DCNNs) was proposed for the diagnosis and localization of lesions in dynamic contrast-enhanced MRI (DCE) [71]. A total of 1,537 images extracted from the MRI breast dataset were used and were split into 1,073 for training, 157 for verification, and 307 for testing. The model showed an accuracy of 83.7%, a sensitivity of 90.8%, a specificity of 69.3%, and an AUC of 85.9%. Compared to a radiologist, the model yielded similar performance results.
In another study [72], a CNN model was proposed based on non-negative matrix factorization and statistical self-similarity to analyze 11218 mammography images extracted from the DDSM database. A 10-fold validation approach was used to evaluate the model performance in two classification tasks, three classes (normal, benign, and malignant) and two classes, recognizing normal from abnormal (benign and malignant joined together) of mammography. In the 3-class task, the model achieved 84.75% accuracy, 73.36% sensitivity, 86.01% specificity, and 90.9% AUC, while in the 2-class task it achieved an accuracy of 85.82%, sensitivity of 82%, and specificity of 86.59%. The model for this study showed an improvement in the sensitivity of 3-class image classification compared to a study conducted in 2015 [73] on the same dataset, which achieved a sensitivity of 60.43%.
In [74], gray-level co-occurrence matrix and gray-level run-length matrix were extracted and fed as two inputs into a hybrid DL of CNN and RNN called CRNN for the detection of mammographic breast cancer. The proposed method achieved a diagnostic accuracy of 90.59% and a sensitivity of 92.42%, which outperformed the traditional models. The specificity was 89.88%, which was lower than in some models.
Similarly, in [75] a novel dual deep neural network between two learning branches with region-level classification and region ranking in weakly and semi-supervised environments (Cls-Det-RS) was proposed to classify and localize abnormalities in 3,000, and 410 mammography images from the FFDM and INBreast datasets, respectively. To evaluate the model, the authors used 5-fold cross-validation; the empirical results showed the potential and advantages of the proposed method compared to previous weakly supervised strategies. It achieved an area under the receiver operating characteristic curve (AUROC) of 84.1%, a partial area under curve ratio (pAUCR) of 36.7%, a specificity of 55%, and a sensitivity of 38%.
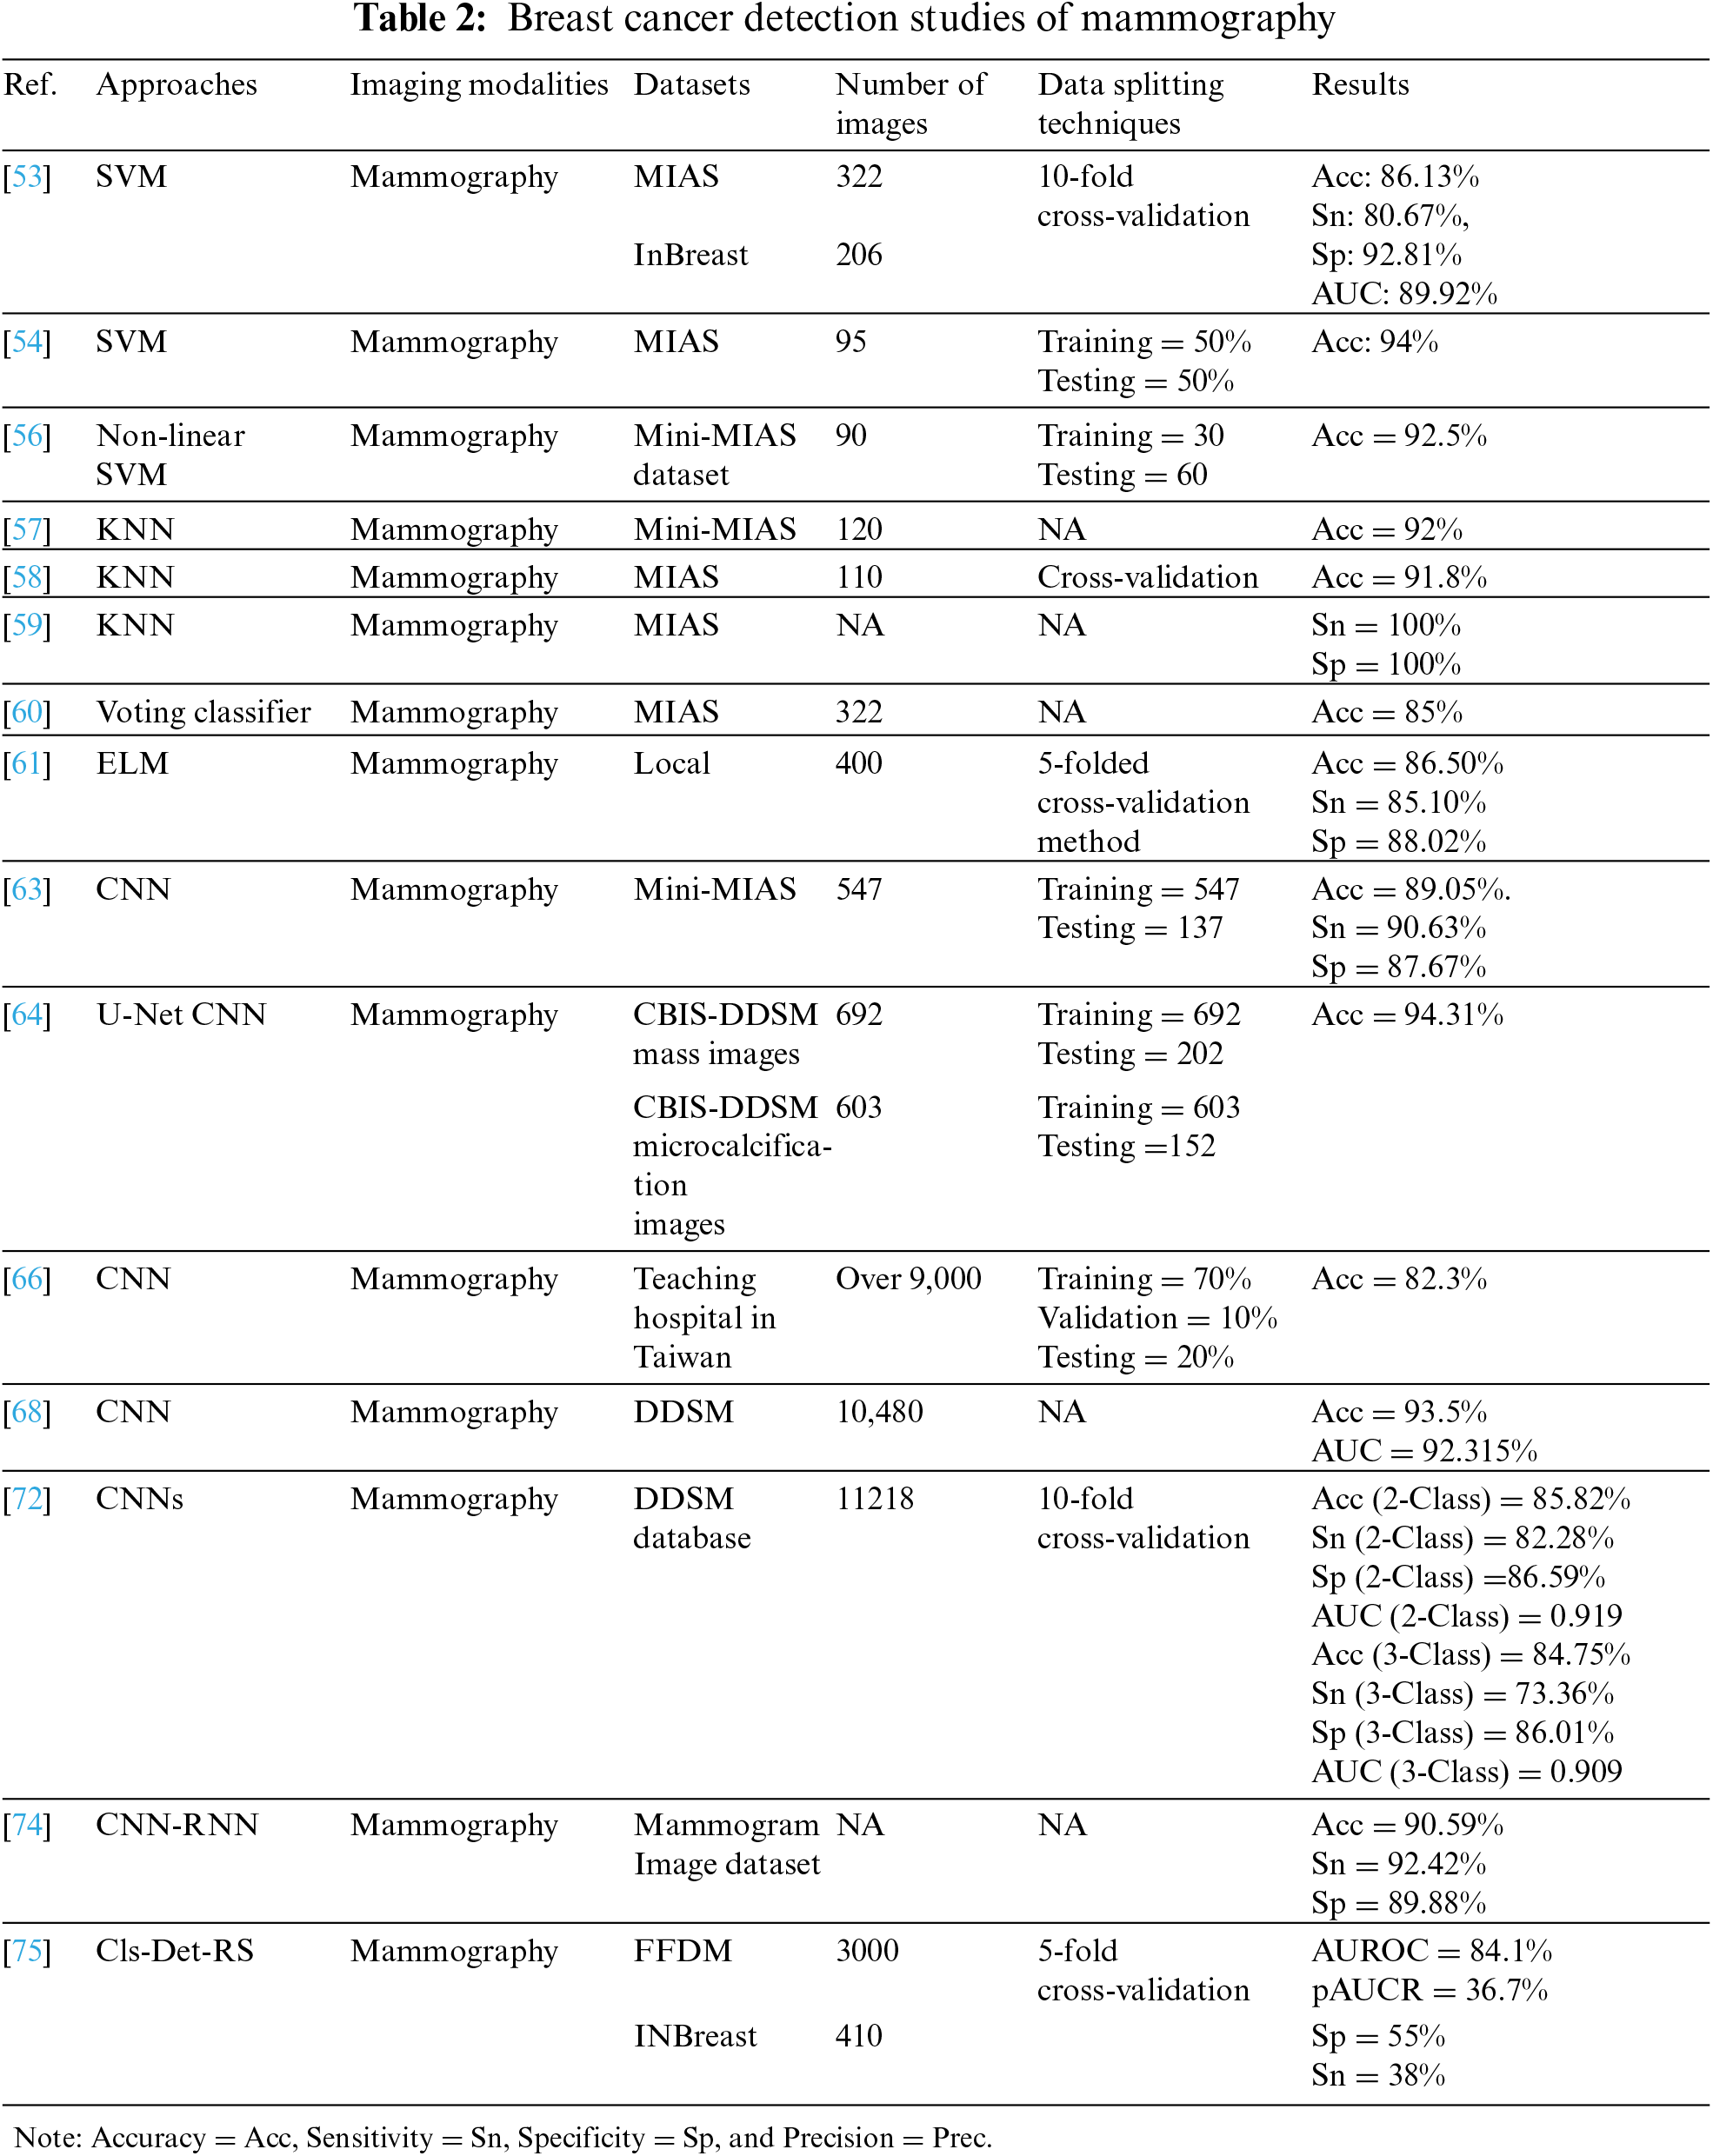
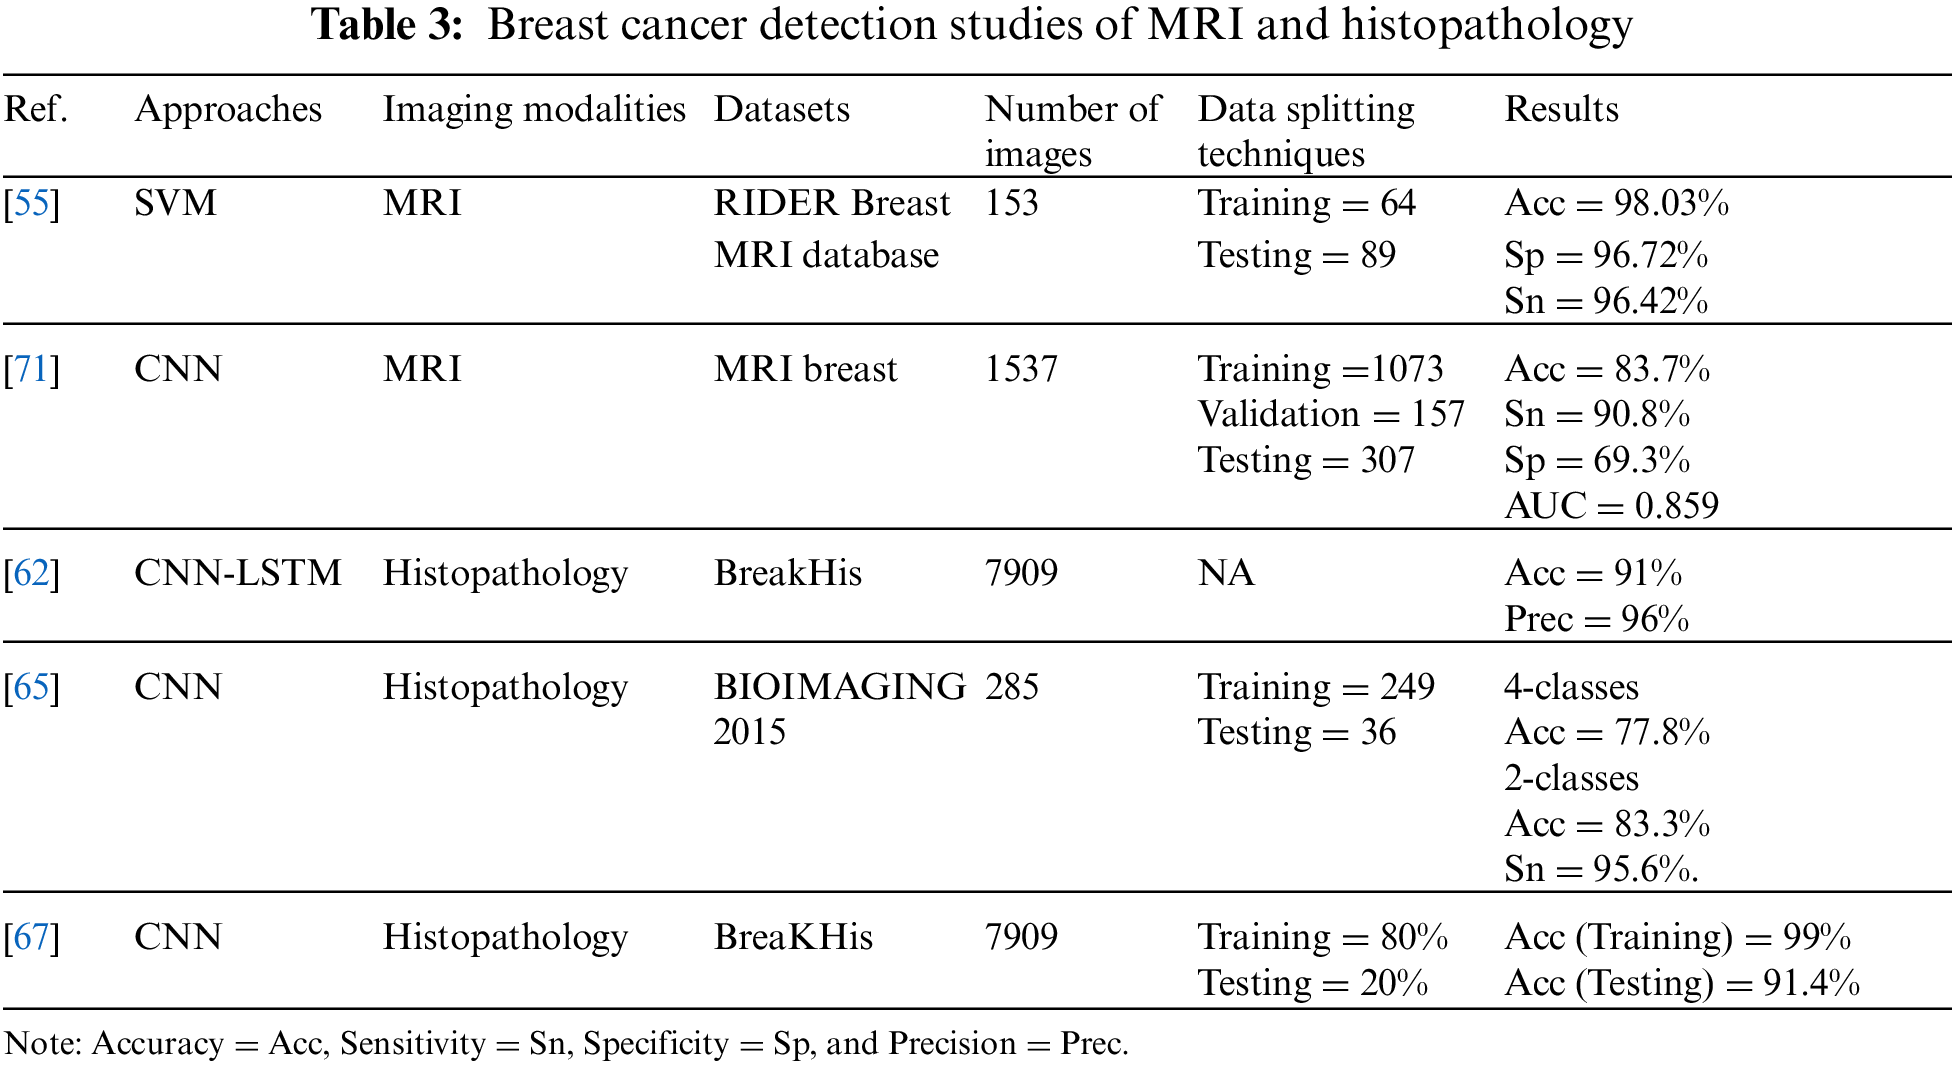
Tables 2 and 3 below summarize the reviewed studies in the field of breast cancer detection. To conclude, it is clear that SVM and KNN are the most-used ML techniques, and have achieved high performance compared to most of the previous methods. In addition, the most-used type of breast cancer imaging is the mammogram. Furthermore, DL has shown its effectiveness when using large datasets and provides automatic extraction of features; DL has proved to outperform ML algorithms. Within DL algorithms, CNNs are the most prominent type of DL technique used in the literature. It has also achieved promising results in detecting breast cancer.
3.2 Studies on Breast Cancer Diagnosis Using Thermal Images
Studies have grown in recent years the detection and diagnosis of breast cancer utilizing thermal imaging as a result of the significant growth in the development of IRs. On thermal imaging, ML and DL algorithms have been used in several investigations. The following paragraphs provide a brief review of those studies.
The University Hospital of Pernambuco Federal University provided 1,052 thermographic images that were used in the breast cancer classification task [76] They used several classifiers: naive Bayes, SVM,RF, knowledge tree J48, ELM, random tree (RT), multi-layer perceptron (MLP), and Bayes network. The dataset was divided into 75% and 25% for training and testing, respectively. The findings indicated that MLP performed well when compared to other classifiers, with an accuracy of 73.38%, a sensitivity of 78%, a specificity of 88% and a kappa index of 0.6007. The accuracy was enhanced to 76.01% by employing a 10-fold cross-validation procedure with a kappa index of 0.6402. The overall effectiveness of the system was 83%. Another study [77], FStat (first-order statistical features), STex (second-order texture feature), and SSigFS (statistically significant first-order and second-order features) were fed to enhance the performance of SVM, ANN, DT and KNN classifiers. To diagnose 70 and 80 thermal images from the DBT-TU-JU and DMR-IR datasets, respectively. The classifier’s performance in both databases was compared; in DBT-TU-JU dataset, SVM-RBF and ANN produced the highest accuracy of 84.29% each, while in the DMR-IR dataset, ANN and SVM-Linear yielded the highest accuracy of 87.50% each.
The discrete wavelet transform and texture features extracted from thermograms were used in [78] to classify normal and abnormal, then they were fed to DT, Sugeno fuzzy, naive Bayes classifier, k nearest neighbor, Gaussian mixture model, and probabilistic neural network classifiers to evaluate the best classifier. Field data were acquired using non-contact thermal imaging from the Department of Diagnostic Radiology at Singapore General Hospital, and infrared thermograms were obtained using the NEC-Avio Thermo TVS2000 MkIIST system. The 5-fold stratified cross-validation method was used to test the performance of six classifiers on 50 images. The DT and fuzzy showed the best results over the other classifiers, with an accuracy of 93.30%, a sensitivity of 86.70%, and a specificity of 100%.
All of the above studies used conventional ML algorithms. On the other hand, DL algorithms, especially CNN, have been applied to thermal images and have shown competitive performance in diagnosing breasts. One of the studies that applied DL on thermal images [5] proposed for the first time the use of CCN classifies thermal images and was optimized by the Bayes optimization algorithm. The model’s accuracy was 98.05% after it underwent training using 1,116 images taken from the DMI dataset. The model outperformed earlier experiments that utilized the same dataset but different features and classifiers by performing better on more images.
In another study [79], authors diagnosed breast cancer from thermal images using a DCNN model. They extracted 680 thermal images from a Visual Lab-IR dataset, converted them to grayscale, and they were pre-processed, segmented, and classified. They achieved a detection accuracy of 95.8% with 680 thermograms.
The suggested model in [80] was a deep neural network (pre-trained Inception V3 model) coupled to SVM only when there was uncertainty in the DNN output. They used 1,062 images from the DMR-IR dataset to train 849 images and tested 213 images, and 480 images for validation. Their report was on only two images without model validation. This model had the probability of a sick class and a healthy class for each image, and then it was classified into the class with the highest probability. Thus, the confidence (sick) was 78%, while the confidence (healthy) was 94%.
In [81], authors investigated the combination of breast segmentation by gradient vector flow method (GVF) and classification by CNNs to detect breast cancer. They used 63 breast thermal images from the DMR-IR dataset labeled normal and abnormal. Using a 2-fold cross-validation methodology, the model’s accuracy, sensitivity, and specificity were all recorded as 100%. It achieved better performance than Tree Random Forest (TRF), MLP, and Bayes networks. However, achieving 100% may raise questions on the evaluation scheme used to measure the performance of this model. The same results cannot be expected with larger datasets. In addition, the authors did not justify their results, especially since they achieved 100% on all measures (accuracy, sensitivity, and specificity).
The authors of [82] used a CNN-based multi-input classifier model for early diagnosis of breast cancer that integrates thermal images from various perspectives with personal and clinical data from 287 patients. The M. 4 without personal and clinical data (M. 4 ncd) model achieved the greatest accuracy of 97%, a specificity of 100%, sensitivity of 83% and AUC ROC of 99%, when the performance of the seven models was compared. Furthermore, the M. 4 ncd model was compared with two studies that used the DMR database for classification purposes [83–86]. It outperformed the two studies in AUC ROC and specificity measures, but with lower sensitivity.
CNNs were taught to classify thermal pictures using static and dynamic protocols [87] The DMR-IR dataset was classified through the static protocol using 300 thermal images, 90% for training, and 10% for testing. For the dynamic protocol, 2,740 images were classified using 88% of them for training and 12% for testing. Competitive results were obtained using both protocols using the suggested approach. In terms of color and grayscale images, the static protocol had accuracy rates of 98% and 95%, respectively. While the dynamic protocol achieved 95% accuracy for color images and 92% accuracy for grayscale images. Using a static or dynamic protocol, the proposed method outperformed other methods in [88,77] applied on the same dataset.
Deep transfer learning models are used for transmission to classify medical images. A new idea is suggested in [89] to train a visual geometry group 16 (VGG 16) model to classify normal or abnormal breast thermal images with the help of a static and dynamic DMR-IR dataset of 1,345 images with multi-view and single view. For the first time, conventional frontal, left, and right-view breast thermal images from the Mastology Research database are sequenced with an infrared image to produce multi-view thermal images. This approach improves the system’s accuracy by providing a more comprehensive and informative thermal temperature. The static and dynamic datasets are augmented, then split into two sets, training 70% and validation 30%. Using multi-view images, VGG 16 achieves an encouraging test accuracy of 99% on the dynamic breast imaging test dataset. To compare the VGG 16 model performance with other deep transfer learning models, VGG19, ResNet50V2, and inceptionV3 were trained and tested to achieve test accuracy of 95%, 94%, and 89%, respectively. This indicates that the VGG 16 model outperformed even though these models are more complex and provide better results in other medical imaging classification tasks.
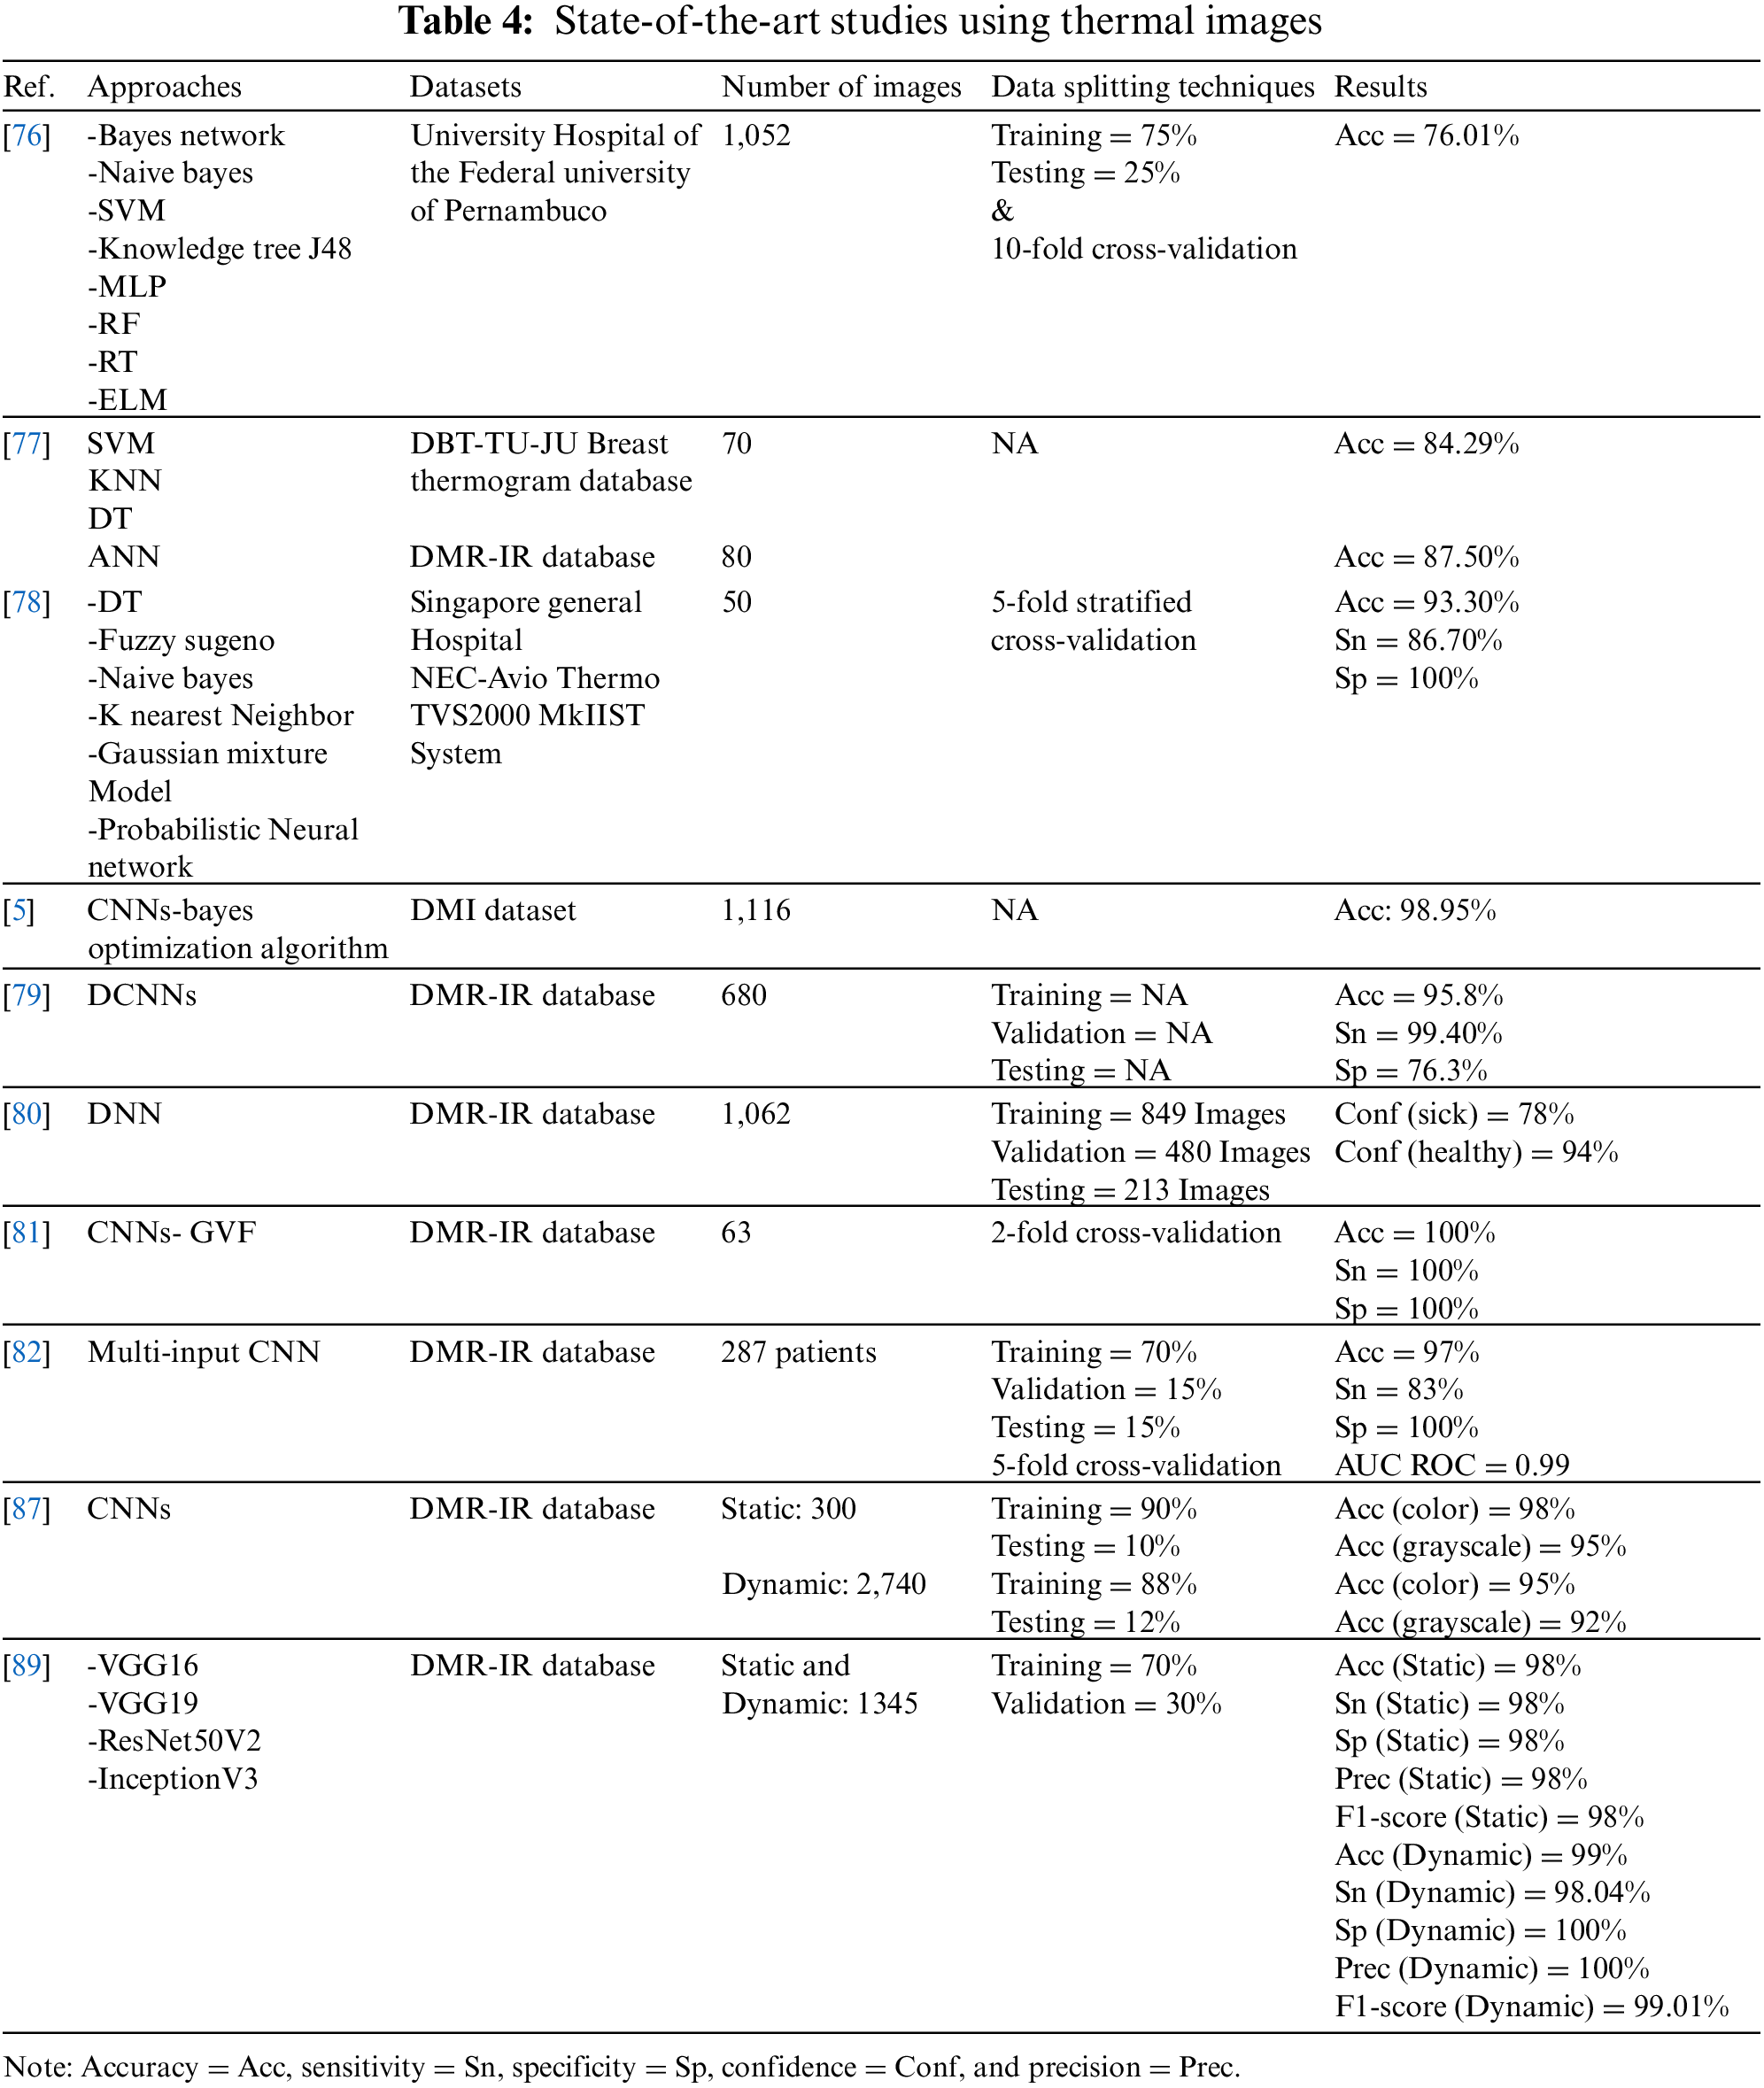
Table 4 below summarizes the reviewed studies using thermal images to detect breast cancer. In summary, the reviewed studies using thermal breast cancer images showed that when compared to other types of image modalities, thermal images gave promising results in the detection of breast cancer and that they were used with both conventional ML and DL methods.
3.3 Studies Using DNNs with Deep-Attention Mechanisms on Medical Images for Detection
In the previous sections, we reviewed conventional ML and DL algorithms for breast cancer detection using different types of images. As indicated, the reviewed studies gave all portions of an image the same amount of “attention” and did not pay particular attention to any important regions. In this section, we review studies conducted using attention mechanisms integrated with DL algorithms on medical images to detect abnormalities and diseases in general.
For the diagnosis and classification of histology images, the authors of [90] proposed a new DL model. They consist of CNN and RNN models and use a parallel structure of two different types of NNs—CNN (DenseNet) and RNN (LSTM)—with the mechanism of interest conducted on three datasets. They applied the models to three datasets: BACH2018, bioimaging2015, and Extended Bioimaging 2015. The accuracy achieved on these three datasets was 92%, 96%, and 97.5%, respectively.
The BreastNet model, developed based on CNNs and attention module [91], to classify 7,909 histology images obtained from the BreakHis dataset. The best results were obtained with 200× images, which had an accuracy of 98.51%, sensitivity of 98.70%, and F1-score of 98.28%.
In order to explore a more efficient features for classifying 7,909 histology images extracted from the BreakHis dataset, investigators have developed a novel CNN-based method that consists of two distinct interest units [4]. The model yielded a 98% accuracy when amplified at 100×, which outperformed the latest methods on the same dataset by a large margin.
The authors in [92] have suggested a fine-grained CNN-based image model to extract features and used a novel attention mechanism for localizing objects. They utilized 400 images from the benchmark dataset for the 2018 Grand Challenge in Breast Cancer Histology Images and 2,000 images from the Peking Union Hospital’s histology collection (BACH). The suggested method’s performance was compared against five recently published approaches for the histological dataset. The results showed that the proposed model achieved an accuracy of 96%, which showed an improvement of 2% compared to the others.
In the study in [93], authors used guided soft attention (GuSA), and regions of interest were localized and used to guide the attention of the classification network on the histopathology imaging simultaneously using GuSA, feature aggregation (FA) network, and baseline (B) network. A total of 500 images from the BACH microscopy dataset were used. The ensemble GuSA with B + FA achieved an accuracy of 93%, while the single model (B + FA) attained an accuracy of 88%. The GuSA and ensemble model improved the accuracy by 5% over the single model.
To identify potential lesion areas from the image and avoid processing the whole image, the authors in [94] proposed a model based on the deep attention network to classify 7,909 histological images extracted from the BreakHis dataset. The model showed 98% accuracy in four different amplification types, and a 50% reduction in training time compared to the POMDP-based approach [95].
Using CNN and BLSTM, an new attention mechanism was created, to classify high-resolution histology images of breast tissue [96]. The model was trained on 400 images extracted from ICIAR 2018, where the data were divided into 70% training, 10% validation, and 20% testing. The experimental findings demonstrated that the model achieved the accuracy metrics of patch-wise and image-wise for classifying four classes at 85.50% and 96.25%, respectively, and for two classes at 96% and 98.75%, respectively. The performance of the model was also compared when used with and without the attention mechanism; results showed that BLSTM without attention achieved 93.75% accuracy and BLSTM with attention (proposed model) achieved 96.25% accuracy. Moreover, this model was compared with some state-of-the-art methods [97–100], and it outperformed them.
Attention was also used in [101]. The authors proposed attention-guided and deep residual CNNs for classifying 1,985 mammogram images from the clinical dataset collected by the researchers and 410 images from the INBreast dataset. The model was evaluated using a 5-fold cross-validation, and showed superior performance compared to existing models on the two datasets. The model on the clinical dataset achieved an accuracy of 88.7%, an F1-score of 87.1%, and an AUC of 97.4%. With the INBreast dataset, the model achieved an accuracy of 70%, an F1-score of 63.5%, and an AUC of 84.7%.
The authors in [102] improved CNNs by integrating an innovative squeeze-and-excitation network (SE-Net)–attention mechanism to classify 18,157 clinically collected mammograms and build a new benchmarking dataset. They used 10-fold cross-validation to evaluate the model’s performance, which outperformed other studies, with an accuracy of 92.17%.
The authors in [103] proposed a RESNET-based classification framework for breast cancer images using a convolutional block attention module (CBAM) to enhance performance on the BreakHis dataset. The proposed model was used to classify 7,909 images. At 200× magnification factor, it showed an impressive performance increase by reaching accuracy of 92.6%, specificity of 88.9%, sensitivity of 94.7%, F1-score of 94.1%, and AUC of 91.8%. In addition, the results of ResNet50 and ResNet50 + CBAM at 200× magnification factor and ResNet-50 + CBAM showed an improvement in accuracy at 92.6%, while ResNet50 was 92.1%.
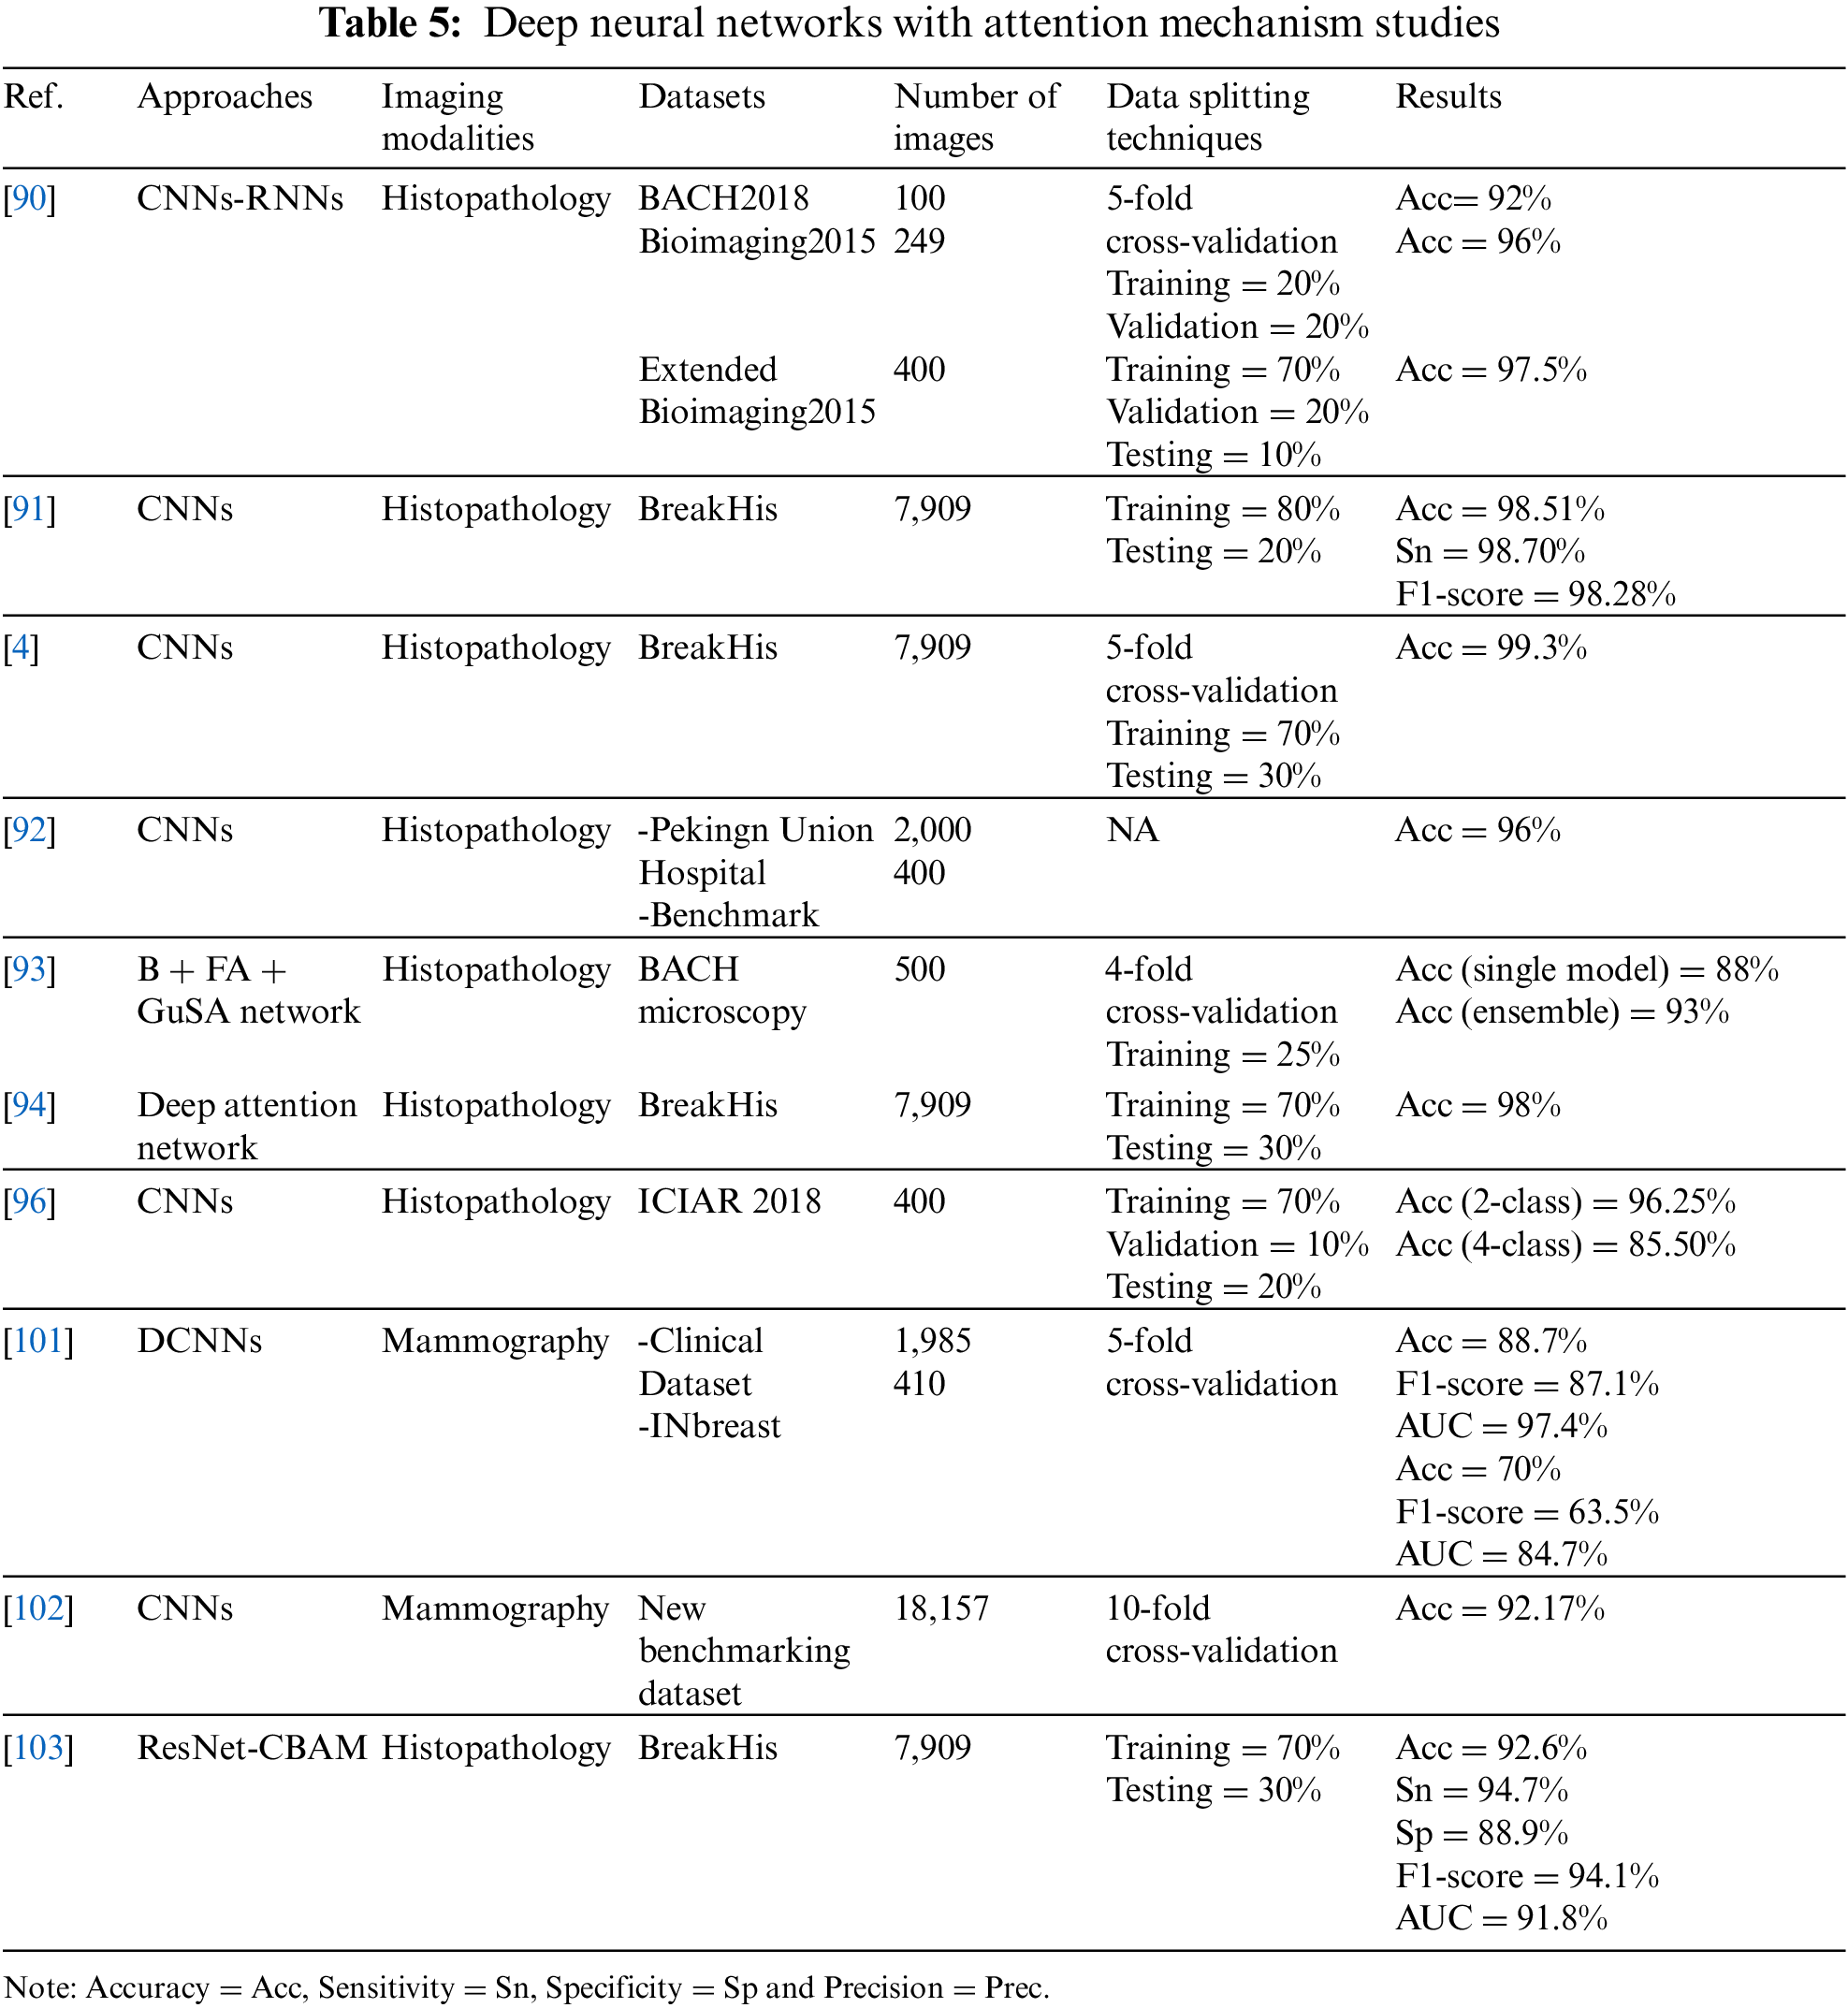
For a summary of the reviewed studies, see Table 5. Through the reviewed studies using DL with attention techniques, it is evident that many research studies have been conducted in recent years integrating deep NN with deep attention mechanisms to improve detection accuracy. Most studies have been conducted on histopathology images of breast cancer. Some mammography studies have also started to show competitive performance in the last two years, encouraging more research on other imaging models. Based on this brief survey of the literature, DL with deep attentional mechanisms has not been applied to thermal images. In addition, the reviewed studies revealed that breast cancer detection in thermal images showed promising accuracy results compared to other modalities. This encourages the investigation of the effects of integrating DL methods with attention mechanisms in detecting breast cancer in thermal images.
Summary
We conclude from our literature review that mammograms show close accuracy when using ML and DL. In addition, studies have used attention mechanisms. The highest accuracy of 94.31% was achieved using U-Net CNN [64].
There have not been many studies using MRI imaging to detect breast cancer; SVM shows superior performance to CNN, with an accuracy improvement of 14.33% [71].
DL models have been the basis of breast cancer detection using histopathology images, and attention mechanisms show improvements in DL results, which achieved the highest accuracy of 99.3% by using CNN [4], making it a motivation for further studies in the field.
Thermal imaging has been an active field in recent years, and many studies have been conducted using ML, DL, and pre-trained models. Studies conducted using DL achieved higher performance than ML. Moreover, the pre-trained VGG16 model yielded the best result, with an accuracy of 99% on a dynamic dataset [89].
The results show that the number of classes that have been classified is an influencing factor, as studies conducted on two classes have outperformed the rest of the classes. Moreover, using different datasets of different sizes may affect the performance of each model, as the size of the data affects the performance [104]. Furthermore, some models reported their performance using different metrics, while others used accuracy only. This is another problem that makes a comparison of models not necessarily reliable.
This paper has provided a systematic review of research works dealing with breast cancer detection using AI models in conjunction with different types of imaging modalities, and one of the most used is the mammogram. The reviewed studies in this paper were categorized based on ML algorithms, types of images used, and the deep attention mechanisms adopted.
The review study highlighted several issues. One important issue is the validity and potential of using thermography for early breast cancer detection. In their studies, researchers mostly use mammograms for breast imaging, but it is harmful to the patient and exposes them to ionizing radiation, which increases the risk of cancer, and it is also expensive. However, effective and promising results were achieved with other less used types, such as infrared thermography.
Deep attention mechanisms have proven to be effective in enhancing the accuracy of DL models by focusing on areas of interest rather than attaching equal importance to all areas of an image.
We can conclude that with rapid advancements in AI methods and techniques, enhancing the accuracy and effectiveness of breast cancer detection models is still necessary, and there is a need to provide AI models that can early detect breast cancer with high accuracy. This is crucial for increasing the number of available treatment options, increasing survival, and improving the quality of life. Therefore, the field of breast cancer detection systems requires more attention and research. With the tremendous advancements made by DL models, it is interesting to note that the research domain is open to enormous development efforts and may even open the door to enormous commercial opportunities.
A limitation of our literature review is the complete reliance on previously published research and its reported results. This made the comparison of methods based on their metrics and reported results and the type of dataset used. All of these factors affected the reliability of the comparison. Since we relied on the reported results, we assumed that all the results were accurate and reliable.
As a result, a future expansion of this work would be to perform another research using the various approaches on the same dataset and reporting findings using various assessment metrics. This will make the comparison and analysis of the performance more reliable.
Acknowledgement: This research project was supported by a grant from the Research Supporting Program Project Number (RSP2023R281), King Saud University, Riyadh, Saudi Arabia.
Funding Statement: This research project was funded by the Research Supporting Program Project Number (RSP2023R281), King Saud University, Riyadh, Saudi Arabia.
Conflicts of Interest: The authors declare that they have no conflicts of interest to report regarding the present study.
References
1. V. Rajinikanth, S. Kadry, D. Taniar, R. Damaševičius and H. T. Rauf, “Breast-cancer detection using thermal images with Marine-Predators-Algorithm selected features,” in 2021 Seventh Int. Conf. on Bio Signals, Images, and Instrumentation (ICBSII), Chennai, India, 2021. [Google Scholar]
2. D. Singh and A. K. Singh, “Role of image thermography in early breast cancer detection—Past, present and future,” Computer Methods and Programs in Biomedicine, vol. 183, pp. 105074, 2020. [Google Scholar] [PubMed]
3. Y. R. Parisky, K. A. Skinner, R. Cothren, R. L. DeWittey, J. S. Birbeck et al., “Computerized thermal breast imaging revisited: An adjunctive tool to mammography,” in Biomedical Engineering Towards the Year 2000 and Beyond (Cat. No.98CH36286), Hong Kong, China, 1998. [Google Scholar]
4. P. Wu, H. Qu, J. Yi, Q. Huang, C. Chen et al., “Deep attentive feature learning for histopathology image classification,” in IEEE 16th Int. Symp. on Biomedical Imaging (ISBI 2019), Hilton Molino Stucky, Venice, Italy, 2019. [Google Scholar]
5. S. Ekici and H. Jawzal, “Breast cancer diagnosis using thermography and convolutional neural networks,” Medical Hypotheses, vol. 137, pp. 109542, 2020. [Google Scholar] [PubMed]
6. H. Sung, J. Ferlay, R. L. Siegel, M. Laversanne, I. Soerjomataram et al., “Global cancer statistics 2020: GLOBOCAN estimates of incidence and mortality worldwide for 36 cancers in 185 countries,” CA: A Cancer Journal for Clinicians, vol. 71, no. 3, pp. 209–249, 2021. [Google Scholar] [PubMed]
7. R. L. Siegel, K. D. Miller, H. E. Fuchs and A. Jemal, “Cancer facts & figures 2021 | American Cancer Society,” Cancer Journal for Clinicians, vol. 71, no. 1, pp. 7–33, 2021. [Google Scholar]
8. M. Tariq, S. Iqbal, H. Ayesha, I. Abbas, K. T. Ahmad et al., “Medical image based breast cancer diagnosis: State of the art and future directions,” Expert Systems with Applications, vol. 167, pp. 114095, 2021. [Google Scholar]
9. J. Ferlay, M. Ervik, F. Lam, M. Colombet, L. Mery et al., “Global cancer observatory: Cancer today,” in Int. Agency for Research on Cancer (IARC), Lyon, France, 2020. [Google Scholar]
10. F. Islami, E. M. Ward, H. Sung, K. A. Cronin, F. Tangka et al., “Annual report to the nation on the status of cancer, part 1,” National Cancer Statistics published in JNCI: Journal of the National Cancer Institute, vol. 113, no. 12, pp. 1149–1169, 2021. [Google Scholar]
11. M. Aranda and M. Redondo, “Immunotherapy: A challenge of breast cancer treatment,” Cancers (Basel), vol. 11, no. 12, pp. E1822, 2019. [Google Scholar]
12. A. L. Siu, “Screening for breast cancer: U.S. preventive services task force recommendation statement,” Annals of Internal Medicine, vol. 164, no. 4, pp. 279–296, 2016. [Google Scholar] [PubMed]
13. Z. Rezaei, “A review on image-based approaches for breast cancer detection, segmentation, and classification,” Expert Systems with Applications, vol. 182, no. 24, pp. 115204, 2021. [Google Scholar]
14. W. Xie, Y. Li and Y. Ma, “Breast mass classification in digital mammography based on extreme learning machine,” Neurocomputing, vol. 173, no. 1, pp. 930–941, 2016. [Google Scholar]
15. Y. Li, “Microwave breast cancer detection and sequential inference with particle flow,” Ph.D. Dissertation, McGill University, Montreal, Quebec, Canada, 2017. [Google Scholar]
16. O. Mukhmetov, D. Igali, A. Mashekova, Y. Zhao, E. Y. K. Ng et al., “Thermal modeling for breast tumor detection using thermography,” International Journal of Thermal Sciences, vol. 161, no. 1, pp. 106712, 2021. [Google Scholar]
17. S. G. Kandlikar, I. P. Raya, P. A. Raghupathi, J. Hernandez, D. Dabydeen et al., “Infrared imaging technology for breast cancer detection—Current status, protocols and new directions,” International Journal of Heat and Mass Transfer, vol. 108, no. 6, pp. 2303–2320, 2017. [Google Scholar]
18. S. V. Sree, E. Y. -K. Ng, R. U. Acharya and O. Faust, “Breast imaging: A survey,” World Journal of Clinical Oncology, vol. 2, no. 4, pp. 171–178, 2011. [Google Scholar] [PubMed]
19. N. Xu and C. Li, “Image feature extraction in detection technology of breast tumor,” Journal of King Saud University—Science, vol. 32, no. 3, pp. 2170–2175, 2020. [Google Scholar]
20. S. Iranmakani, T. Mortezazadeh, F. Sajadian, M. Ghaziani, A. Ghafari et al., “A review of various modalities in breast imaging: Technical aspects and clinical outcomes,” Egyptian Journal of Radiology and Nuclear Medicine, vol. 51, no. 1, pp. 6, 2020. [Google Scholar]
21. E. H. Houssein, M. M. Emam, A. A. Ali and P. N. Suganthan, “Deep and machine learning techniques for medical imaging-based breast cancer: A comprehensive review,” Expert Systems with Applications, vol. 167, no. 24, pp. 114161, 2021. [Google Scholar]
22. R. R. Devi and G. S. Anandhamala, “Recent trends in medical imaging modalities and challenges for diagnosing breast cancer,” Biomedical and Pharmacology Journal, vol. 11, no. 3, pp. 1649–1658, 2018. [Google Scholar]
23. M. A. Zavare and L. A. Latiff, “Electrical impedance tomography as a primary screening technique for breast cancer detection,” Asian Pacific Journal of Cancer Prevention, vol. 16, no. 14, pp. 5595–5597, 2015. [Google Scholar]
24. T. W. Davison, K. L. Ewing, J. Fergason, M. Chapman, A. Can et al., “Detection of breast cancer by liquid crystal thermography. A preliminary report,” Cancer, vol. 29, no. 5, pp. 1123–1132, 1972. [Google Scholar] [PubMed]
25. Y. K. Ng, “A review of thermography as promising non-invasive detection modality for breast tumor,” International Journal of Thermal Sciences, vol. 48, no. 5, pp. 849–859, 2009. [Google Scholar]
26. D. Euhus, P. A. Di Carlo and N. F. Khouri, “Breast cancer screening,” Surgical Clinics of North America, vol. 95, no. 5, pp. 991–1011, 2015. [Google Scholar] [PubMed]
27. D. Sánchez-Ruiz, I. Olmos-Pineda and J. A. Olvera-López, “Automatic region of interest segmentation for breast thermogram image classification,” Pattern Recognition Letters, vol. 135, no. 10, pp. 72–81, 2020. [Google Scholar]
28. E. Ng, “Is thermal scanner losing its bite in mass screening of fever due to SARS?,” Medical Physics, vol. 32, no. 1, pp. 93–97, 2004. [Google Scholar]
29. U. Gogoi, M. Bhowmik, D. Bhattacharjee, A. Ghosh and G. Majumdar, “A study and analysis of hybrid intelligent techniques for breast cancer detection using breast thermograms,” Hybrid Soft Computing Approaches, vol. 611, pp. 329–359, 2015. [Google Scholar]
30. S. Iranmakani, T. Mortezazadeh, F. Sajadian, M. F. Ghaziani, A. Ghafari et al., “A review of various modalities in breast imaging: Technical aspects and clinical outcomes,” Egyptian Journal of Radiology and Nuclear Medicine, vol. 51, no. 1, pp. 57, 2020. [Google Scholar]
31. Y. Lei, M. Yin, M. Yu, J. Yu, S. Zeng et al., “Artificial intelligence in medical imaging of the breast,” Frontiers in Oncology, vol. 11, pp. 2892, 2021. [Google Scholar]
32. A. Saber, M. Sakr, O. M. Abo-Seida and A. Keshk, “Automated breast cancer detection and classification techniques—A survey,” in 2021 Int. Mobile, Intelligent, and Ubiquitous Computing Conf. (MIUCC), Cairo, Egypt, 2021. [Google Scholar]
33. N. K. Chauhan and K. Singh, “A review on conventional machine learning vs deep learning,” in 2018 Int. Conf. on Computing, Power and Communication Technologies (GUCON), Greater Noida, India, 2018. [Google Scholar]
34. S. Palminteri and M. Pessiglione, “Chapter five—Reinforcement learning and tourette syndrome,” International Review of Neurobiology, vol. 112, no. 2, pp. 131–153, 2013. [Google Scholar] [PubMed]
35. M. R. M. Talabis, R. McPherson, I. Miyamoto, J. L. Martin and D. Kaye, “Chapter 1—Analytics defined,” in Information Security Analytics, Boston, Syngress, pp. 1–12, 2015. [Google Scholar]
36. B. M. Gayathri and C. P. Sumathi, “Comparative study of relevance vector machine with various machine learning techniques used for detecting breast cancer,” in 2016 IEEE Int. Conf. on Computational Intelligence and Computing Research (ICCIC), Chennai, India, 2016. [Google Scholar]
37. S. Sharma, A. Aggarwal and T. Choudhury, “Breast cancer detection using machine learning algorithms,” in 2018 Int. Conf. on Computational Techniques, Electronics and Mechanical Systems (CTEMS), Belgaum, India, 2018. [Google Scholar]
38. P. Wittek, “5—Unsupervised learning,” in Quantum Machine Learning, Boston: Academic Press, pp. 57–62, 2014. [Google Scholar]
39. J. E. van Engelen and H. H. Hoos, “A survey on semi-supervised learning,” Machine Learning, vol. 109, no. 2, pp. 373–440, 2020. [Google Scholar]
40. C. Fri and R. Elouahbi, “Machine learning and deep learning applications in e-learning systems: A literature survey using topic modeling approach,” in 2020 6th IEEE Congress on Information Science and Technology (CiSt), Agadir—Essaouira, Morocco, 2020. [Google Scholar]
41. R. Yamashita, M. Nishio, R. K. G. Do and K. Togashi, “Convolutional neural networks: An overview and application in radiology,” Insights Imaging, vol. 9, no. 4, pp. 611–629, 2018. [Google Scholar] [PubMed]
42. J. Kumar, R. Goomer and A. K. Singh, “Long short term memory recurrent neural network (LSTM-RNN) based workload forecasting model for cloud datacenters,” Procedia Computer Science, vol. 125, no. 3, pp. 676–682, 2018. [Google Scholar]
43. A. Graves and J. Schmidhuber, “Framewise phoneme classification with bidirectional LSTM and other neural network architectures,” Neural Networks, vol. 18, no. 5–6, pp. 602–610, 2015. [Google Scholar]
44. I. Goodfellow, J. Abadie, M. Mirza, B. Xu, D. Farley et al., “Generative adversarial nets,” Advances in Neural Information Processing Systems, vol. 27, pp. 2672–2680, 2014. [Google Scholar]
45. D. H. Ballard, “Modular learning in neural networks,” in Proc. of the Sixth National Conf. on Artificial Intelligence, Seattle, Washington, 1987. [Google Scholar]
46. L. Gondara, “Medical image denoising using convolutional denoising autoencoders,” in 2016 IEEE 16th Int. Conf. on Data Mining Workshops (ICDMW), Barcelona, Spain, 2016. [Google Scholar]
47. H. Tian, P. Wang, K. Tansey, D. Han, J. Zhang et al., “A deep learning framework under attention mechanism for wheat yield estimation using remotely sensed indices in the Guanzhong Plain, PR China,” International Journal of Applied Earth Observation and Geoinformation, vol. 102, no. 6, pp. 102375, 2021. [Google Scholar]
48. T. Shen, T. Zhou, G. Long, J. Jiang, S. Wang et al., “Reinforced self-attention network: A hybrid of hard and soft attention for sequence modeling,” in Proc. of the Twenty-Seventh Int. Joint Conf. on Artificial Intelligence, Stockholm, Sweden, 2018. [Google Scholar]
49. A. de S. Correia and E. L. Colombini, “Attention, please! A survey of neural attention models in deep learning,” Artificial Intelligence Review, vol. 55, no. 8, pp. 6037–6124, 2022. [Google Scholar]
50. W. Gad, A. Alokla, W. Nazih, M. Aref and A. Salem, “DLBT: Deep learning-based transformer to generate pseudo-code from source code,” Computers, Materials & Continua, vol. 70, no. 2, pp. 3117–3132, 2022. [Google Scholar]
51. S. A. Hicks, I. Strümke, V. Thambawita, M. Hammou, M. A. Riegler et al., “On evaluation metrics for medical applications of artificial intelligence,” Scientific Reports, vol. 12, no. 1, pp. 5979, 2022. [Google Scholar] [PubMed]
52. D. Shillan, J. A. C. Sterne, A. Champneys and B. Gibbison, “Use of machine learning to analyse routinely collected intensive care unit data: A systematic review,” Critical Care, vol. 23, no. 1, pp. 284, 2019. [Google Scholar] [PubMed]
53. A. Rampun, B. W. Scotney, P. J. Morrow, H. Wang and J. Winder, “Breast density classification using local quinary patterns with various neighbourhood topologies,” Journal of Imaging, vol. 4, no. 1, pp. 14, 2018. [Google Scholar]
54. R. Vijayarajeswari, P. Parthasarathy, S. Vivekanandan and A. A. Basha, “Classification of mammogram for early detection of breast cancer using SVM classifier and Hough transform,” Measurement, vol. 146, no. 1, pp. 800–805, 2019. [Google Scholar]
55. A. M. Ibraheem, K. H. Rahouma and H. F. A. Hamed, “Automatic MRI breast tumor detection using discrete wavelet transform and support vector machines,” in 2019 Novel Intelligent and Leading Emerging Sciences Conf. (NILES), Giza, Egypt, 2019. [Google Scholar]
56. N. El-Sokary, A. A. Arafa, A. H. Asad and H. A. Hefny, “Computer-aided detection system for breast cancer based on GMM and SVM,” Arab Journal of Nuclear Sciences and Applications (Online), vol. 52, no. 2, pp. 142–150, 2019. [Google Scholar]
57. T. T. Htay and S. S. Maung, “Early stage breast cancer detection system using GLCM feature extraction and K-Nearest Neighbor (k-NN) on Mammography image,” in 2018 18th Int. Symp. on Communications and Information Technologies (ISCIT), Bangkok, Thailand, 2018. [Google Scholar]
58. R. A. Nurtanto Diaz, N. Nyoman Tria Swandewi and K. D. Pradnyani Novianti, “Malignancy determination breast cancer based on mammogram image with K-Nearest neighbor,” in 2019 1st Int. Conf. on Cybernetics and Intelligent System (ICORIS), Denpasar, Indonesia, 2019. [Google Scholar]
59. I. Khoulqi and N. Idrissi, “Breast cancer image segmentation and classification,” in Proc. of the 4th Int. Conf. on Smart City Applications, New York, NY, USA, 2019. [Google Scholar]
60. S. Agrawal, R. Rangnekar, D. Gala, S. Paul and D. Kalbande, “Detection of breast cancer from mammograms using a hybrid approach of deep learning and linear classification,” in 2018 Int. Conf. on Smart City and Emerging Technology (ICSCET), Mumbai, India, 2018. [Google Scholar]
61. Z. Wang, M. Li, H. Wang, H. Jiang, Y. Yao et al., “Breast cancer detection using extreme learning machine based on feature fusion with CNN deep features,” IEEE Access, vol. 7, pp. 105146–105158, 2019. [Google Scholar]
62. A. A. Nahid, M. A. Mehrabi and Y. Kong, “Histopathological breast cancer image classification by deep neural network techniques guided by local clustering,” Biomed Research International, vol. 2018, pp. 1–20, 2018. [Google Scholar]
63. B. Li, Y. Ge, Y. Zhao, E. Guan and W. Yan, “Benign and malignant mammographic image classification based on convolutional neural networks,” in Proc. of the 2018 10th Int. Conf. on Machine Learning and Computing, Macau, China, 2018. [Google Scholar]
64. E. Rashed and M. S. El Seoud, “Deep learning approach for breast cancer diagnosis,” in Proc. of the 2019 8th Int. Conf. on Software and Information Engineering, Cairo, Egypt, 2019. [Google Scholar]
65. T. Araújo, G. Aresta, E. Castro, J. Rouco, P. Aguiar et al., “Classification of breast cancer histology images using convolutional neural networks,” PLoS One, vol. 12, no. 6, pp. e0177544, 2017. [Google Scholar]
66. H. C. Lu, E. -W. Loh and S. C. Huang, “The classification of mammogram using convolutional neural network with specific image preprocessing for breast cancer detection,” in 2019 2nd Int. Conf. on Artificial Intelligence and Big Data (ICAIBD), Chengdu, China, 2019. [Google Scholar]
67. A. K. Arslan, Ş. Yaşar and C. Çolak, “Breast cancer classification using a constructed convolutional neural network on the basis of the histopathological images by an interactive web-based interface,” in 2019 3rd Int. Symp. on Multidisciplinary Studies and Innovative Technologies (ISMSIT), Ankara, Turkey, 2019. [Google Scholar]
68. R. Platania, S. Shams, S. Yang, J. Zhang, K. Lee et al., “Automated breast cancer diagnosis using deep learning and region of interest detection (BC-DROID),” in Proc. of the 8th ACM Int. Conf. on Bioinformatics, Computational Biology, and Health Informatics, Boston, Massachusetts, USA, 2017. [Google Scholar]
69. M. Kallenberg, K. Petersen, M. Nielsen, A. Y. Ng, P. Diao et al., “Unsupervised deep learning applied to breast density segmentation and mammographic risk scoring,” IEEE Trans. Med. Imaging, vol. 35, no. 5, pp. 1322–1331, 2016. [Google Scholar] [PubMed]
70. K. J. Geras, S. Wolfson, Y. Shen, N. Wu, S. Gene Kim et al., “High-resolution breast cancer screening with multi-view deep convolutional neural networks,” arXiv.org, 28 June, 2018. [Online]. Available: https://arxiv.org/abs/1703.07047 [Google Scholar]
71. J. Zhou, I. Luo, Q. Dou, H. Chen, C. Chen et al., “Weakly supervised 3D deep learning for breast cancer classification and localization of the lesions in MR images,” Journal of Magnetic Resonance Imaging, vol. 50, no. 4, pp. 1144–1151, 2019. [Google Scholar] [PubMed]
72. B. Swiderski, J. Kurek, S. Osowski, M. Kruk and W. Barhoumi, “Deep learning and non-negative matrix factorization in recognition of mammograms,” in Eighth Int. Conf. on Graphic and Image Processing (ICGIP 2016), Tokyo, Japan, 2017. [Google Scholar]
73. S. Dhahbi, W. Barhoumi and E. Zagrouba, “Breast cancer diagnosis in digitized mammograms using curvelet moments,” Computers in Biology and Medicine, vol. 64, no. 6, pp. 79–90, 2015. [Google Scholar] [PubMed]
74. R. S. Patil and N. Biradar, “Automated mammogram breast cancer detection using the optimized combination of convolutional and recurrent neural network,” Evol. Intel., vol. 14, no. 4, pp. 1459–1474, 2021. [Google Scholar]
75. R. Bakalo, J. Goldberger and R. Ben-Ari, “A dual branch deep neural network for classification and detection in mammograms,” arXiv.org, 29 April, 2019. [Online]. Available: https://arxiv.org/abs/1904.12589v1 [Google Scholar]
76. M. Santana, J. Pereira, F. Silva, N. Lima, F. Sousa et al., “Breast cancer diagnosis based on mammary thermography and extreme learning machines,” Research on Biomedical Engineering, vol. 34, no. 1, pp. 45–53, 2018. [Google Scholar]
77. U. R. Gogoi, M. K. Bhowmik, A. K. Ghosh, D. Bhattacharjee and G. Majumdar, “Discriminative feature selection for breast abnormality detection and accurate classification of thermograms,” in 2017 Int. Conf. on Innovations in Electronics, Signal Processing and Communication (IESC), Shillong, India, 2017. [Google Scholar]
78. M. R. K. Mookiah, U. R. Acharya and E. Y. K. Ng, “Data mining technique for breast cancer detection in thermograms using hybrid feature extraction strategy,” Quantitative InfraRed Thermography Journal, vol. 9, no. 2, pp. 151–165, 2012. [Google Scholar]
79. S. Mishra, A. Prakash, S. K. Roy, P. Sharan and N. Mathur, “Breast cancer detection using thermal images and deep learning,” in 2020 7th Int. Conf. on Computing for Sustainable Global Development (INDIACom), New Delhi, India, 2020. [Google Scholar]
80. S. J. Mambou, P. Maresova, O. Krejcar, A. Selamat and K. Kuca, “Breast cancer detection using infrared thermal imaging and a deep learning model,” Sensors (Basel), vol. 18, no. 9, pp. 2799, 2018. [Google Scholar] [PubMed]
81. S. Tello-Mijares, F. Woo and F. Flores, “Breast cancer identification via thermography image segmentation with a gradient vector flow and a convolutional neural network,” Journal of Healthcare Engineering, vol. 2019, pp. 1–13, 2019. [Google Scholar]
82. R. Sánchez-Cauce, J. Pérez-Martín and M. Luque, “Multi-input convolutional neural network for breast cancer detection using thermal images and clinical data,” Computer Methods and Programs in Biomedicine, vol. 204, no. 1_suppl, pp. 106045, 2021. [Google Scholar]
83. S. Pramanik, D. Bhattacharjee and M. Nasipuri, “Multi-resolution analysis to differentiate the healthy and unhealthy breast using breast thermogram,” in 2016 Int. Conf. on Systems in Medicine and Biology (ICSMB), Kharagpur, India, 2016. [Google Scholar]
84. V. Madhavi and C. B. Thomas, “Multi-view breast thermogram analysis by fusing texture features,” Quantitative InfraRed Thermography Journal, vol. 16, no. 1, pp. 111–128, 2019. [Google Scholar]
85. A. Golatkar, D. Anand and A. Sethi, “Classification of breast cancer histology using deep learning,” in 2019 19th Int. Symp. on Communications and Information Technologies (ISCIT), Portugal, 2019. [Google Scholar]
86. K. Nazeri, A. Aminpour and M. Ebrahimi, “Two-stage convolutional neural network for breast cancer histology image classification,” in Int. Conf. Image Analysis and Recognition, Póvoa de Varzim, Portugal, 2018. [Google Scholar]
87. M. O. Baffa and L. G. Lattari, “Convolutional neural networks for static and dynamic breast infrared imaging classification,” in 2018 31st SIBGRAPI Conf. on Graphics, Patterns and Images (SIBGRAPI), Parana, Brazil, 2018. [Google Scholar]
88. V. Lessa and M. Marengoni, Applying Artificial Neural Network for the Classification of Breast Cancer using Infrared Thermographic Images. Cham, Germany: Springer International Publishing, 2016. [Google Scholar]
89. D. Tiwari, M. Dixit and K. Gupta, “Deep multi-view breast cancer detection: A multi-view concatenated infrared thermal images based breast cancer detection system using deep transfer learning,” Traitement du Signal, vol. 38, no. 6, pp. 1699–1711, 2021. [Google Scholar]
90. H. Yao, X. Zhang, X. Zhou and S. Liu, “Parallel structure deep neural network using CNN and RNN with an attention mechanism for breast cancer histology image classification,” Cancers (Basel), vol. 11, no. 12, pp. 1901, 2019. [Google Scholar] [PubMed]
91. M. Toğaçar, K. B. Özkurt, B. Ergen and Z. Cömert, “BreastNet: A novel convolutional neural network model through histopathological images for the diagnosis of breast cancer,” Physica A: Statistical Mechanics and its Applications, vol. 545, pp. 123592, 2020. [Google Scholar]
92. M. Fan, T. Chakraborti, E. I. C. Chang, Y. Xu and J. Rittscher, “Fine-grained multi-instance classification in microscopy through deep attention,” in 2020 IEEE 17th Int. Symp. on Biomedical Imaging (ISBI), Iowa City, IA, USA, 2020. [Google Scholar]
93. H. Yang, J. Y. Kim, H. Kim and S. P. Adhikari, “Guided soft attention network for classification of breast cancer histopathology images,” IEEE Transactions on Medical Imaging, vol. 39, no. 5, pp. 1306–1315, 2020. [Google Scholar] [PubMed]
94. B. Xu, J. Liu, X. Hou, B. Liu, J. Garibaldi et al., “Attention by selection: A deep selective attention approach to breast cancer classification,” IEEE Transactions on Medical Imaging, vol. 39, no. 6, pp. 1930–1941, 2020. [Google Scholar] [PubMed]
95. B. Xu, J. Liu, X. Hou, B. Liu, J. Garibaldi et al., “Investigate, and classify: A deep hybrid attention method for breast cancer classification,” in 2019 IEEE 16th Int. Symp. on Biomedical Imaging (ISBI 2019), Hilton Molino Stucky, Venice, Italy, 2019. [Google Scholar]
96. R. Sanyal, M. Jethanandani and R. Sarkar, “DAN: Breast cancer classification from high-resolution histology images using deep attention network,” in Innovations in Computational Intelligence and Computer Vision, Springer, Singapore, 2021. [Google Scholar]
97. A. Rakhlin, A. Shvets, V. Iglovikov and A. A. Kalinin, “Deep convolutional neural networks for breast cancer histology image analysis,” in Int. Conf. Image Analysis and Recognition, Póvoa de Varzim, Portugal, 2018. [Google Scholar]
98. K. Roy, D. Banik, D. Bhattacharjee and M. Nasipuri, “Patch-based system for classification of breast histology images using deep learning,” Computerized Medical Imaging and Graphics, vol. 71, no. 3–4, pp. 90–103, 2019. [Google Scholar] [PubMed]
99. Y. S. Vang, Z. Chen and X. Xie, “Deep learning framework for multi-class breast cancer histology image classification,” in Int. Conf. Image Analysis and Recognition, Póvoa de Varzim, Portugal, 2018. [Google Scholar]
100. R. Yan, F. Ren, Z. Wang, L. Wang, T. Zhang et al., “Breast cancer histopathological image classification using a hybrid deep neural network,” Methods, vol. 173, pp. 52–60, 2020. [Google Scholar] [PubMed]
101. C. Li, J. Xu, Q. Liu, Y. Zhou, L. Mou et al., “Multi-view mammographic density classification by dilated and attention-guided residual learning,” IEEE/ACM Transactions on Computational Biology and Bioinformatics, vol. 18, no. 3, pp. 1003–1013, 2021. [Google Scholar] [PubMed]
102. J. Deng, Y. Ma, D. Li, J. Zhao, Y. Liu et al., “Classification of breast density categories based on SE-Attention neural networks,” Computer Methods and Programs in Biomedicine, vol. 193, no. 1, pp. 105489, 2020. [Google Scholar] [PubMed]
103. X. Zhang, Y. Zhang, B. Qian, X. Liu, X. Li et al., “Classifying breast cancer histopathological images using a robust artificial neural network architecture,” in Bioinformatics and Biomedical Engineering, Cham, Switzerland: Springer, 2019. [Google Scholar]
104. A. Althnian, D. AlSaeed, H. Al-Baity, A. Samha, A. Dris et al., “Impact of dataset size on classification performance: An empirical evaluation in the medical domain,” Applied Sciences, vol. 11, no. 2, pp. 796, 2021. [Google Scholar]
Cite This Article
 Copyright © 2023 The Author(s). Published by Tech Science Press.
This work is licensed under a Creative Commons Attribution 4.0 International License , which permits unrestricted use, distribution, and reproduction in any medium, provided the original work is properly cited.
 Downloads
 Citation Tools