
 Submit a Paper
 Propose a Special lssue
 Open Access
ARTICLE

A Novel Ego Lanes Detection Method for Autonomous Vehicles
Information Systems Department, College of Computers and Information Systems, Umm Al-Qura University, Mecca, 24382, Saudi Arabia
* Corresponding Author: Bilal Bataineh. Email:
Intelligent Automation & Soft Computing 2023, 37(2), 1941-1961. https://doi.org/10.32604/iasc.2023.039868
Received 21 February 2023; Accepted 12 April 2023; Issue published 21 June 2023
 View Full Text
 Download PDF
Abstract
Autonomous vehicles are currently regarded as an interesting topic in the AI field. For such vehicles, the lane where they are traveling should be detected. Most lane detection methods identify the whole road area with all the lanes built on it. In addition to having a low accuracy rate and slow processing time, these methods require costly hardware and training datasets, and they fail under critical conditions. In this study, a novel detection algorithm for a lane where a car is currently traveling is proposed by combining simple traditional image processing with lightweight machine learning (ML) methods. First, a preparation phase removes all unwanted information to preserve the topographical representations of virtual edges within a one-pixel width around expected lanes. Then, a simple feature extraction phase obtains only the intersection point position and angle degree of each candidate edge. Subsequently, a proposed scheme that comprises consecutive lightweight ML models is applied to detect the correct lane by using the extracted features. This scheme is based on the density-based spatial clustering of applications with noise, random forest trees, a neural network, and rule-based methods. To increase accuracy and reduce processing time, each model supports the next one during detection. When a model detects a lane, the subsequent models are skipped. The models are trained on the Karlsruhe Institute of Technology and Toyota Technological Institute datasets. Results show that the proposed method is faster and achieves higher accuracy than state-of-the-art methods. This method is simple, can handle degradation conditions, and requires low-cost hardware and training datasets.Keywords
In this era, the increasing dependence on smart devices in vehicles and the development of vehicle–road collaboration systems have drawn considerable attention toward autonomous driving [1–4]. Autonomous vehicles are currently equipped with a variety of sensors, such as video cameras, ultrasonic sensors, and radars, for collecting peripheral data [5–7]. Visibility is one of the most essential elements in autonomous driving, and cameras are the primary optical sensors in vehicles that capture sights similar to those seen by the human eye. Lane detection provides a piece of essential visual information that is required in autonomous vehicles for a variety of driver assistance applications, such as traffic understanding, vehicle steering, vehicle navigation, collision avoidance, and lane departure warning [5,8,9].
A lane is a section of a road that is designated for a single row of vehicles to direct and manage drivers and reduce traffic problems. In accordance with statistics, lane drift or lane change is one of the leading causes of vehicular accidents [5,10,11]. Several lanes are typically found in each direction, and lane line markers are placed on most roadways. Different conditions create complex difficulties in lane detection, such as dissimilar lane lines, the disappearance of lanes due to the absence or deterioration in the quality of lane markers, and confusion due to off-road marker-like lines. In addition, some environmental conditions, such as fog, shadow, darkness, and uneven illumination, contribute to difficulties [12,13].
Lane detection research has been categorized into traditional lane detection methods and deep learning methods [4,14,15]. Traditional lane detection methods are based on extracting features of lane lines by using image processing methods, and thus, developing and improving processing time detection is easy. In terms of accuracy, however, these methods fail in some critical challenges; hence, they must be improved spatially with the deterioration or absence of lane lines [14,15]. Deep learning methods are mostly based on artificial neural network (NN) models that extract the most important features from a large amount of data through a training process. Although deep learning methods achieve high accuracy, linear regions, such as ego lanes, are still difficult to extract; moreover, these methods require expensive hardware and highly prepared datasets for training, and their processing time performance is poor [4,5,9].
Although many lane detection methods have exhibited good performance in terms of accuracy, most of them have failed to extract ego lanes, but instead, extract all lanes embedded into a road surface. In addition, developing a robust lane detection method under unlimited conditions, such as weather effects, lighting contrast, partial occlusion, and deterioration in the quality of a road surface, remains difficult and may have implications for the results. Furthermore, most methods consider a single task or challenge, require costly hardware and dataset training, and have poor processing time [4,16–18].
To achieve satisfactory levels of lane detection efficiency, a simple lane detection method is proposed in the current study. This is accomplished by combining the advantages of traditional and machine learning (ML) methods to detect ego lanes. First, image processing methods are applied to the region of interest (ROI) to remove unwanted information and preserve only the vertical edges within the one-pixel width of candidate lanes. Second, a lightweight feature extraction process is implemented to extract only two values of each candidate lane line. Then, the features extracted in successive steps are used for lightweight ML models, with each one supporting the next model to improve performance and overcome challenges. Once a lane is detected by a model, the subsequent models are skipped. The proposed method is easy to develop as a traditional lane detection method, and it requires less expensive hardware and training datasets. Moreover, it achieves good performance accuracy due to the use of ML methods. In addition, the proposed method is fast because of the principle of using the involved processing steps.
The contributions of this work can be summarized as follows: 1) proposing a lane detection algorithm to identify the ego lane in which a vehicle is traveling at any given moment, based on a combination of simple traditional image processing and lightweight machine learning methods; 2) introducing a preprocessing stage to address visual challenges such as uneven lighting, shadows, missing lane lines, and uneven road surfaces; and 3) proposing a recognition phase that utilizes small and lightweight sequential machine learning methods to overcome the need for expensive hardware and large datasets for training.
The remainder of this paper is organized as follows. Section 2 presents state-of-the-art methods. The proposed method is described in detail in Section 3. The results are provided in Section 4 and the discussion is provided in Section 5. Finally, conclusions are drawn in Section 6.
In accordance with literature reviews provided over the years, several methods for improving images’ contrast and illumination have been proposed. Previous survey studies, such as [19–25], reported that HE and GT are the most involved techniques in proposed contrast and illumination enhancement methods given their simplicity, fast processing time, and high performance. A review of the literature indicates that many lane detection methods have been developed. Traditional lane detection approaches were adopted in the past. Recently, however, the focus has shifted to ML approaches [4,16,26].
In general, traditional methods consist of a series of human vision stages, namely, the image preprocessing, feature extraction, recognition, and post-processing stages [4,14]. The preprocessing stage aims to improve image quality and prepare images to make them suitable for feature extraction [17,27–31]. The feature extraction stage is the key point of traditional methods when localizing lanes. In general, edge-based [32,33], color-based [17,34], and texture-based [10] approaches are used to extract geometrically discrete features for heretical recognition. Traditional methods typically use the Hough transform (HT) to extract lines or carves of lanes [15,35]. Meanwhile, the final post-processing stage creates the final detailed overview of lanes [4,5].
Many traditional lane detection methods have been proposed. In [12], the method combines color and texture information using a hybrid approach of Canny edge detection, morphological operations, and adaptive thresholding. The proposed method is tested on real-world datasets with varying road conditions and compared to existing lane detection methods, demonstrating superior performance in challenging environments. In [36], a method for lane detection is based on novel feature extraction and lane categorization. The proposed method extracts features using a combination of edge detection, Hough transform, and gradient-based methods. These features are then categorized into different lane types based on their characteristics, such as width and curvature. The method developed in [18] adopted dynamic threshold, Sobel edge, and HT to deal with illumination challenges.
The authors of [37] overcame various illumination and shadow challenges by using fuzzy systems and line segment detector algorithms. In [38], the Canny method was used for the detected lane edges, while HT was used for lane detection. The authors of [34] applied random sample consensus to find the best model for lanes in hue, saturation, and value (HSV) representation images. Meanwhile, the binary Sobel edge and peak values of histograms were used to detect lanes in [39]. In [27], the authors divided images into three (low, medium, and high) levels for feature extraction. Then, HT and shape-preservative interpolation were implemented for lane detection. In [40], lane lines on a smooth road surface are identified using gradient and HLS thresholding to detect the lane lines in binary images. A sliding window search technique is used to estimate the color lane and visualize the lanes.
The authors of [15] aimed to detect curve lanes. After dividing images into straight and curved areas that were extracted via HT, a polynomial curve model was generated, and its parameters were solved using the curve fitting method for detecting lanes. In [11], the objective was to overcome shadows and illumination challenges by using template matching techniques of lane characteristics for feature extraction and then the RANSAC approach for detection. The authors of [29] extracted all candidate lane lines from an image by using color segmentation, canny edge, HT, and regression methods. Then, lanes were detected through perspective transformation and histogram analysis. In [5], inverse perspective mapping, binary thresholding, and edge detection were used on the ROI to prepare images for the next heuristic detection.
All previous traditional methods are highly specialized in the problems for which they were developed. However, they do not exhibit robustness with road scene variables, which cannot be easily modeled by a heuristics model [32]. Traditional methods are typically based on edge extraction methods that produce an extremely wide detection range, confusing representation of scene objects and have slow computation time [14]. In addition, heuristics requirements are difficult to meet because they are sensitive to noise, and peripheral conditions; they also fail under deteriorating conditions or lack of lane line markings [26].
With the improvement in the power of hardware and graphics processing units (GPUs), deep learning techniques have recently replaced traditional techniques with deep networks, such as a spatial convolutional NN (CNN), for lane prediction. Deep learning methods are mostly adopting segmentation-based [4,16] and classification approaches [41–43].
Semantic segmentation-based methods use the CNN architecture to detect the area of lanes with a prediction made based on pixels; each pixel is labeled as a lane or background. In [1], the MobileNetV3 detects vehicles and lanes in different situations by combining the Hough transform and CNNs. While it has shown promising results in detecting lane markings through edge detection, it may not be as effective in cases where lane markings are not visible. In [44], a lane detection method using a CNN was trained on a comprehensive dataset collected from highway data. The authors of [45] proposed a spatial CNN for semantic segmentation to encode the context information of lanes and obtain strong results for many challenges. A self-attention distillation (SAD), which learns and achieves significant improvement without any supervision or labels, was introduced. SAD was integrated into CNN and validated on lane detection datasets. The authors of [46] proposed a network architecture that combines deep deconvolutional neural networks with CNNs for scene parsing. The approach achieves state-of-the-art performance on four datasets and has an end-to-end automated training system that doesn’t require post-processing.
In [47], a line-CNN proposal unit based CNN was introduced to define precise lane curves. Reference [48] employs deep learning methods deployed on an embedded device for lane detection. In [49], a lane detection method, called the vision-based lane-zone detection scheme, was proposed based on a hybrid model that used U-Net and ResNet. U-Net was used for segmentation, while ResNet-50 was used for sampling down an image and selecting features. In addition, some studies [43,50] have indicated that segmentation-based methods are ineffective for describing the lane line itself because the segmentation process is forced to obtain an accurate classification of each pixel rather than to determine the shape of the lane.
The authors of [4,26] claimed that the classification approach aims to distinguish between objects in images. However, the classification process itself cannot obtain the location of lanes. Therefore, some frameworks are required to use the classification approach in lane detection. In [51], a trainable multitasking network based on a CNN is proposed to handle the detection of lane and road markings that were routed through a vanishing point under adverse weather conditions. In [52], a hybrid deep framework was developed by combining CNN with a recurrent NN (RNN) for multiple frames of a continuous driving scene. The information of each frame was abstracted by the CNN model, while the features of the multiple continuous frames were fed into the RNN model for lane prediction. The authors of [41] applied a modified Faster R-CNN for lane detection.
The authors of [42] proposed the CondLaneNet framework for lane detection. This method uses conditional convolution, row-wise formulation, and the recursive instance unit to overcome the problem of lane line detection with complex structures. In [53], a pedestrian detection approach is proposed by utilizing the Laplace image enhancement algorithm and Faster R-CNN. The Laplace operator algorithm is used for image enhancement, and the Faster R-CNN algorithm is used for pedestrian detection. In [54], the Unified Viewpoint Transformation (UVT) is used to address lane detection across different datasets. UVT aims to normalize the viewing angle and distance of images across datasets by using a novel image transformation technique. The transformed images are then fed into a deep neural network for lane detection.
Despite the recent increase in trust in the use of deep learning techniques in lane detection, these methods still suffer from many problems. The authors [4,16,32,50] claimed that deep learning methods suffer from many problems. Most deep learning methods consist of a classification step and a post-processing optimization step to fit the results. In lane detection, post-processing includes many processes, such as point sampling, agglomeration, and lane regression, which are costly operations. In addition, the excellent performance of CNN is associated with millions of parameters, posing a challenge to real-time performance on mobile devices. Therefore, using CNN on mobile devices is difficult. Developing a deep learning model requires a large amount of labeled data, and labeling those data is a long, cumbersome, and expensive task. Moreover, a pre-trained model cannot modify a situation that is not included in the training data. Deep learning methods lack the ability to generalize and making accurate predictions in a changing environment remains a critical challenge.
According to the literature review, traditional lane detection methods involve several stages, including image preprocessing, feature extraction, recognition, and post-processing. However, these methods lack robustness in detecting lanes under various road scene variables and deteriorating conditions. Deep learning techniques, specifically spatial CNN, have emerged as a promising alternative to traditional methods. CNN-based semantic segmentation methods can detect lanes by predicting lane pixels. Nevertheless, deep learning methods still face challenges such as post-processing optimization, high computational cost, difficulty in running on mobile devices, and inability to generalize in changing environments. Moreover, developing a deep learning model requires a significant amount of labeled data, which is expensive and time-consuming. Pre-trained models cannot handle situations that are not included in the training data. To overcome these issues, the proposed method aims to leverage the strengths of each approach while avoiding their respective drawbacks, which will be explained in detail in the following sections.
Fig. 1 presents the flowchart of the proposed method, which consists of three major phases. The preparation phase improves the quality of the ROI and the characteristics of the vertical edges in the image frames. Then, the feature extraction phase extracts numerical features from the candidate lanes. These features are used in sequential ML models during the lane detection phase. Once a model detects the ego lane, subsequent models are skipped, and the final detected ego lane region is matched with its frame image.
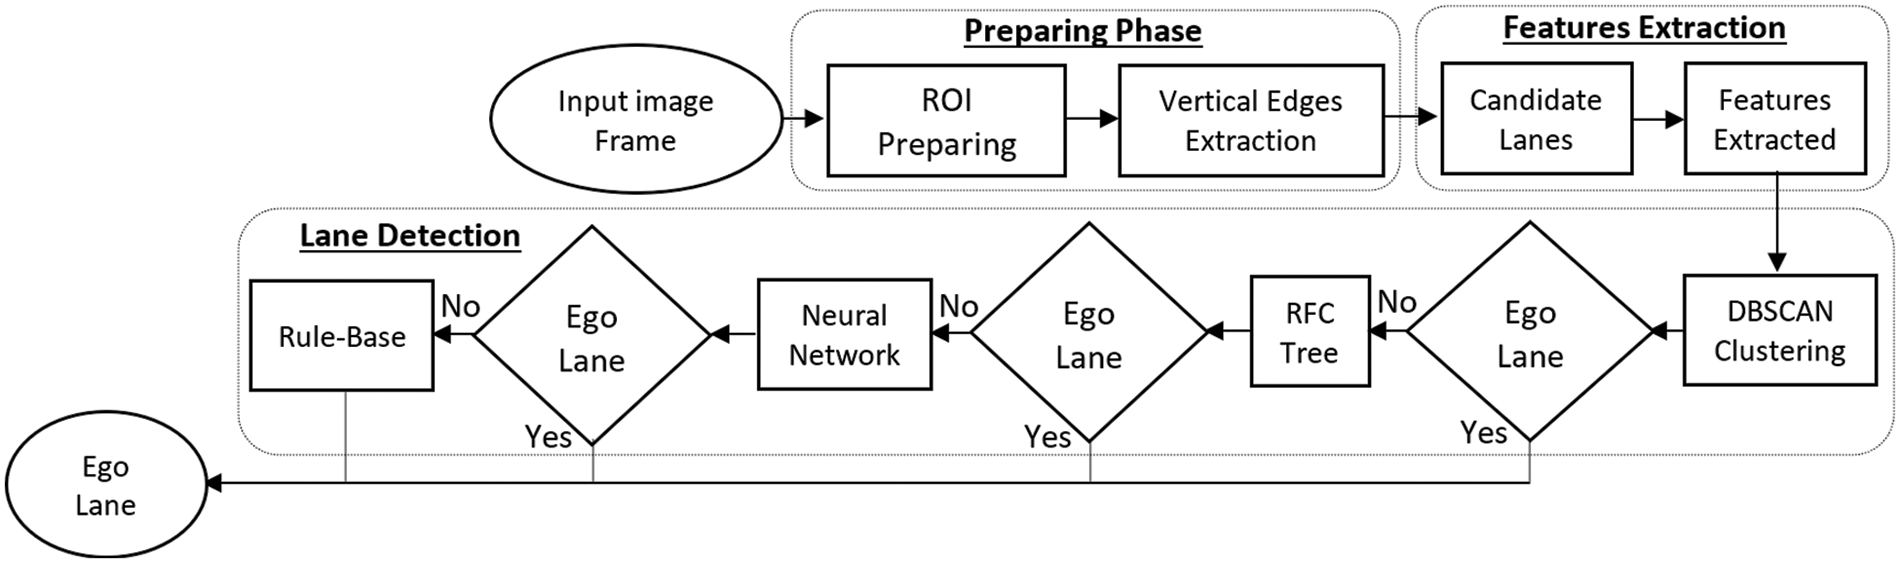
Figure 1: Framework of the proposed method
To improve lane detection processing time, the lane detection method is implemented on an ROI in this work. The visual characteristics of image quality are improved, and complex scenes are filtered to retain only the vertical edges with a single pixel width, which is the information required for the feature extraction stage. The preparation stage is explained in detail as follows.
To improve the lane detection method, its operations are applied only to the lane region, and all non-lane regions in the image are disregarded. Therefore, the ROI principle is used to improve detection effectiveness and processing time.
• ROI cropping
Several different ROIs have been suggested in the literature review based on defined fixed regions that are typically the bottom half of the images. The smallest possible ROI is adopted in the current work. Depending on the literature review, a certified ROI is used in many studies, such as [12,27]. The adopted ROI is a part of image frames. Its wide base meets the base of the image, while its top matches the points (0.45 × width, 0.5 × height), (0.55 × width, 0.5 × height) of the image, as shown in Fig. 2b. The ROI is consistent in size, quickly defined, and covers desired features in straight and sinuous lane lines.
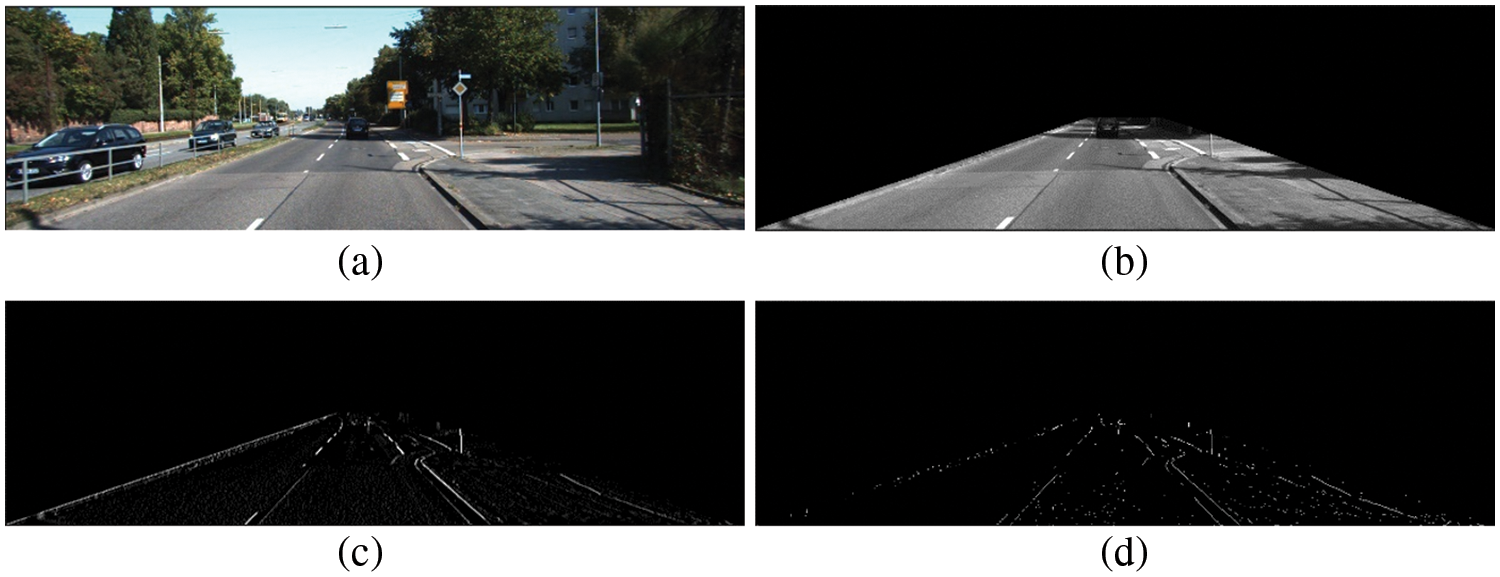
Figure 2: (a) Original image, (b) ROI, (c) vertical extracted edges, and (d) result of the preparation stage
• Visual quality enhancement
Images are represented using the red, green, and blue (RGB) color format, but the required vertical edges of the lanes are extracted in the grayscale format. Therefore, RGB images are converted into grayscale images to reduce the required storage and processing time. To calculate the gray value of each pixel in a fast process, the mean value of the RGB channel values is calculated as presented in Eq. (1), where x and y are the positions of the considered pixel.
In this work, edges are the required information for extracting the candidate boundaries between lane and non-lane regions. Edge detection methods eliminate useless information and highlight the important topological structure of an image. In general, edge detection is severely affected by shadows, uneven illumination, and rough textures. To address some of these issues, a bilateral filter is used to be highly effective in removing noise and improves edge sharpness in image textures and refines non-edge areas. This filter is applied to a grayscale form (IGray), and the equation of the bilateral filter is expressed as
where k and l are the kernel sizes, and w is the weight computed by multiplying the domain kernel (d) by the range kernel (r), parameters σd and σr are used to control the filter. In this work, the hyperparameters selected kernel size is 15, and σd and σr are set to 10 and 15, respectively.
After improving edges and removing noise by using the bilateral filter, some preserved noises in the edge-improving process are eliminated via the common Gaussian blur method. The Gaussian filter is applied to smooth the rough textures improved by the bilateral filter. A small (3 × 3) kernel is used to preserve edges on the basis of Eq. (6), where σ is the standard deviation.
3.1.2 Preparation of Vertical Edges
In this step, vertical edges between different areas of the ROI are extracted by filtering out unwanted information and preserving single-pixel width vertical edges for the feature extraction phase. The applied steps are presented in detail as follows.
• Extraction of vertical edges
In general, traditional single-edge detection algorithms, such as the Canny, Prewitt, LOG, and Robert operators, have many problems, including an excessively wide detection range, poor anti-noise interference, and long calculation time [14]. The Sobel detector provides edges wherein the intensity of pixels changes rapidly. It is faster and less affected by uneven illuminations and noise than other methods [55]. In this work, the Sobel_X kernel is only applied to produce separate computations of the gradient component in the vertical direction to achieve improvement in real-time (Fig. 3). After extracting the convolution image of the vertical kernel, it is encoded in binary. A local binary process is applied to convert a grayscale convolution image into a binary format image to retain only the desired topographical structure. For each sub-image of eight segments in the width, a modified Niblack fast threshold method [30] is applied (Fig. 2c). The modified equation is
where T is the thresholding value, and each pixel in the image becomes black if it is smaller than T and white if its value is larger than
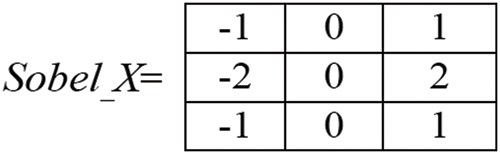
Figure 3: Vertical sobel kernel
• Preparation of morphological edges
In general, some noisy edges and salt noise are produced from rough textures and non-lane objects. These edges have different morphological characteristics from lane edges. To reduce such noise, the morphological opening operation is applied [56]. The morphological opening is a process of erosion followed by dilation. Erosion removes floating pixels and thin lines. By contrast, the dilation output pixel becomes white if any pixel of the kernel is white the morphological opening operation is applied two times. The first is by using the (2, 1) kernel, and the second is by using the (1, 2) kernel. Small kernels are used to reduce processing time. This implementation removes noise and smooths edges.
Finally, a thinning algorithm is applied to obtain the skeletons of the lanes to use the simplest representation of edges and preserve the necessary topological features of the lanes. The skeleton is the centerline of the lanes with a width of one pixel in binary images. The Lee thinning method [57] is used in the current work because it is simple and fast. The thinning process is useful in minimizing unwanted information and maintaining only the topological representations of lanes that are required for the feature extraction phase. Moreover, the one-pixel boundary of the ROI is removed. This process essentially reduces the extracted features by a single lane line response with each edge, improves lane localization, and shortens processing time. As shown in Fig. 2d, the result of preprinting phase is a binary image with a black background and white one-pixel width edges of the candidate lanes.
This phase requires a simple process to extract only two numerical features of all candidate ego-lane edges. The extracted features in this work are the position and angle degree of the intersection point with the base of the image frame of each edge. To calculate this feature, an estimated representation line for each edge is drawn on the base of the image. To produce lines of edges, probabilistic HT (pHT) is used. It represents a line by two parameters, namely, slope and the intercept of the intersection points of curves in parameter space, which is presented by an accumulator image (Figs. 4a and 4b). pHT is faster than the traditional HT, improving lane detection processing time.
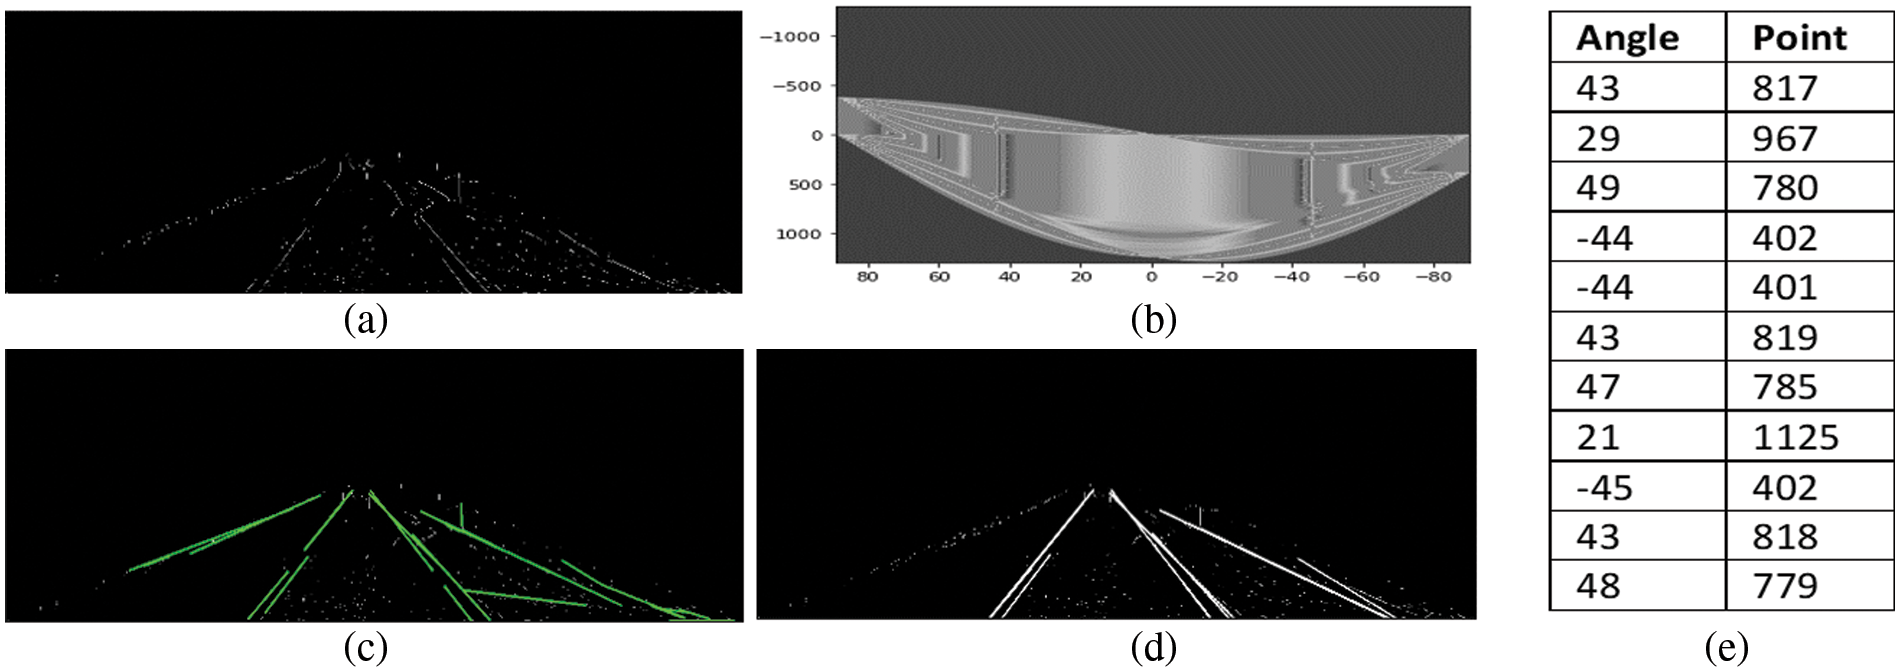
Figure 4: (a) Binary image of edges, (b) its accumulator image via HT, (c) extracted lines, (d) considered lines for feature extraction, and (e) extracted features of considered lines
After line extraction (Fig. 4c), the relative position and the angle of the intersection point with the base of the image are computed. Notably, the angles are in positive or negative values, denoting the left or right of lane lines, respectively, and supporting the recognition phase. All possible lines of edges are extracted and extended to intersect the image base. However, only lines that can belong to a lane are selected for feature extraction to improve performance and time. Based on a previous analysis of lane image datasets, the considered lane should intersect the image base with an angle of 20° to 70° for the right lines and −25° to −90° for the left lines. Any lines that do not comply with these rules are avoided. Figs. 4d and 4e present the considered lines and extracted features of each line. The output of this phase is the features of several lanes, which are passed on to the next lane detection phase for recognition.
Here, a framework of ML models, which are density-based clustering, random forest tree (RFT), NN, and rule-based methods, is applied sequentially to detect the ego lane. Once a model finds the ego lane, the remaining models are skipped. This proposed framework helps determine the ego lane regardless of the problems or challenges it faces because each ML model supports the following one to overcome complex problems. Therefore, the fine cases of image frames can be detected directly by the first ML algorithm and the remaining models are skipped. In complex cases, more ML models must cooperate to find the ego lane.
To develop the proposed method, the benchmark Karlsruhe Institute of Technology and Toyota Technological Institute (KITTI) dataset is adopted to train the used ML models, conduct experiments, and evaluate performance [6]. The KITTI dataset was collected using a mobile platform while driving in Germany. KITTI is a specialist dataset for autonomous vehicles that consists of real-world traffic, ranging from highways to rural roads, captured by a variety of sensors, such as 3D laser scanners, the Global Positioning System/inertial measurement unit of inertial navigation systems, and cameras. The primary advantage of KITTI is that it provides labeled ground truth images for each lane in the image frame. These images are used to train ML models and evaluate performance. Fig. 5 shows some images and their labeled ground truth samples from the KITTI dataset.
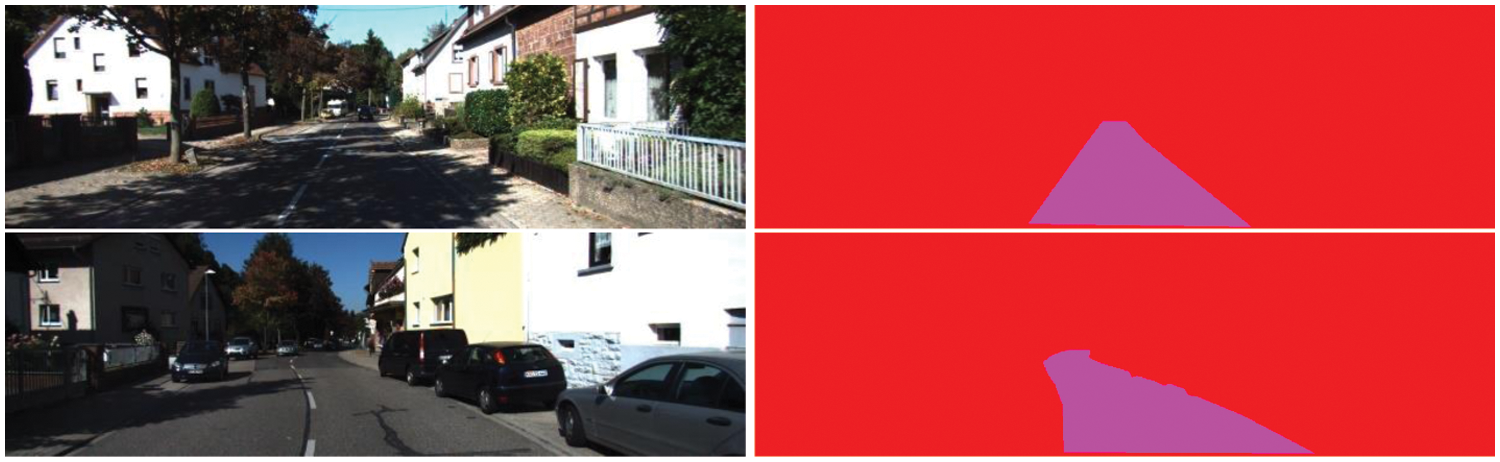
Figure 5: Examples of KITTI dataset images (left), and its lane’s ground-truth (right)
3.3.2 Density-Based Clustering
The first ML algorithm used for each input image frame is the density-based spatial clustering of applications with noise (DBSCAN). DBSCAN is a fast and highly accurate unsupervised ML method that divides data points into specific groups on the basis of their similar characteristics [58,59].
In this work, several extracted data point features of each input image have similar, if not the same, values of the angles of intersection points. That is, overlapping or similar lines occur on the same lane. Therefore, detecting one line for a lane reduces the number of associated features, supporting the next ML models. DBSCAN is based on the principle that the density of adjacent points within a group is higher than the density outside the group. In the current work, this principle is used to detect only the best single line for each lane. To apply DBSCAN, the minimum number of points (minPts) and the distance measured (Eps) must be specified. In the current work, minPts = 1 and eps = 50. The processing density area is a circle in the Eps radius, which may confuse the clustering process because the area produced is not proportional to this process. To solve this problem, feature data ranges are modified by scaling the angle values to be equal to the data range of the intersection points. This process is achieved by Eq. (8),
The clustering process determines all the points that belong to one line (Fig. 6c). The features of the line with a higher probability of being the best line are preserved, while the features of the remaining lines are removed (Fig. 6d). The best line meets more edge pixels (white pixels). As shown in Fig. 6, from the 11 lines inputted into the clustering process, only 4 lines (1 is a left line and 3 are right lines) remain. The space is returned to the original range size, and features are passed on from this process to be used by the next ML algorithm.
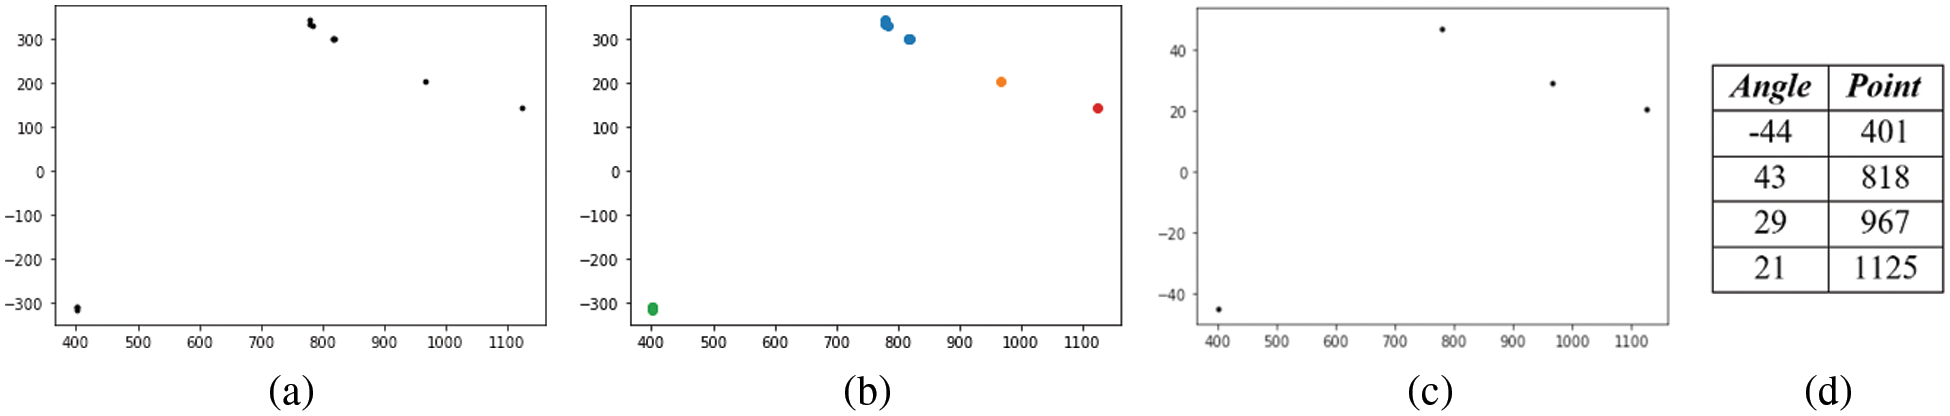
Figure 6: (a) Original space points of intersection values, (b) clustering results, (c) final line points, and (d) final line feature values
If the DBSCAN clustering method fails to obtain one line for each left and right line lanes (one with a positive angle value and one with a negative angle value), then its outcome is passed on to the next step of ego lane detection. Here, the random forest classifier is used to determine which presented pair of lines are actual lane lines.
For training, a dataset that consists of five attributes is prepared from KITTI. By using the preparation and feature extraction phases, the positions and angles of each left and right lines are extracted in addition to the target attribute. The target attribute has two values: lane and non-lane. A target has a lane if the left and right lines match the lane lines in the associated ground truth image from KITTI; otherwise, it is non-lane. To improve model training, the feature dataset is extended through a soft scaling process to include potential lanes that are not included in the KITTI samples, in addition to normalization to make data suitable for training. In total, about 14,700 records are used for training and testing.
RFT is a supervised ML algorithm. It builds many decision trees on different samples to find the output. In this work, in RFT hyperparameter tuning, the “number of trees” was 99. The square root of the total number of features was used as the parameter “max_features” to determine the number of features in each node. The “max_depth” parameter does not specify the depth to which the tree can grow, and “max_depth” is off at the end of the tree’s growth. A split point at any depth will only be considered if at least “min_samples_leaf” samples are left on the left and right branches. In this work, “min_samples_leaf” is the minimum number. Finally, the criteria used is the Mean Squared Error. For training, about 66% of the dataset records are used.
To apply RFT, all possible pairs of available left and right lines are used to produce all candidate lanes, and their features are fed into the pre-trained RFT model.
Each line with a negative angle is associated with all lines that have a positive angle value to represent all possible candidate lanes. Several candidate lanes are produced that are equal to the number of left lines multiplied by the number of right lines. Each candidate lane presents four feature values that are tested by the RFT model to determine whether a lane is an actual lane. The small number of lanes and used features caused by the previous steps improve recognition accuracy and time performance.
Fig. 7 shows the three lanes’ candidate contracts used by the RFT model. If the RFT model predicts only one true lane, then the result indicates the actual lane. The result will be presented, and the next steps will be skipped. In case more than one true lane is predicted, they will be passed on to the next step to assess which one is the actual true lane. If no lanes are found, then the features are passed on to the next step wherein different prediction processes are applied.
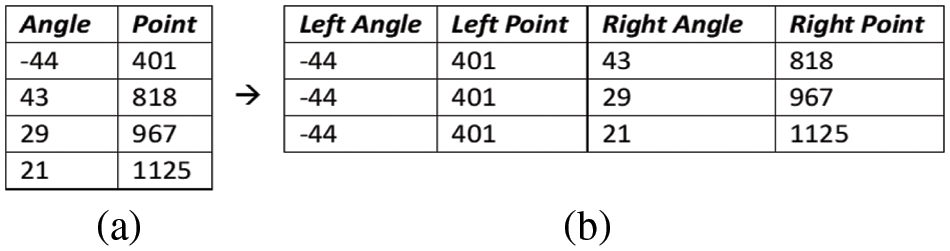
Figure 7: (a) Line features and (b) their produced candidate lanes.3.3.4. NN step
The decision tree principle is based on binary decision rules, and thus, these rules may satisfy more than one lane or fail with new feature values due to improper training. To solve such cases, the failed features of the RFT model are passed on to the next model, which is based on NNs.
NNs are a set of nodes inspired by biological NNs in the human brain. One type of ANN is the multilayer perceptron (MLP), which is a feed-forward neural network that maps sets of inputs onto sets of appropriate outputs. It consists of multiple layers of nodes in a directed graph, where each layer is fully connected to the next one. MLP algorithms consist of at least three layers: one input layer, one output layer, and one hidden layer, all of which must consist of nonlinearly activating nodes. By adding more hidden layers to an MLP, it can be considered a deep learning architecture.
In general, NNs are slower in training and classification processes than decision trees and less interpretable. However, the NN model can be more accurate than a decision tree if it is fed with good training data. In addition, a small number of features used (e.g., only four) makes the model even simpler than the decision tree model, making it faster. Moreover, NN has an important feature, i.e., it evaluates the error rate of its output. Therefore, if more than one lane is detected in a single image frame, then the lane with the lowest error rate is the actual lane.
In this work, the proposed MLP architecture for lane detection is presented in Fig. 8. It consists of four layers: the input layer consists of four nodes for each input feature, and one node in the output layer to present the lane or non-lane class of the according to the input features, and four hidden layers all of which consist of nonlinearly activating nodes. To train an MLP, the backpropagation algorithm is used, which is a generalization of the least mean squares algorithm in linear perceptions. Backpropagation is used by the gradient descent optimization algorithm to adjust the weight of neurons by calculating the gradient of the loss function. The model is trained by the same training dataset used for the RFT model. For training, 66% of the dataset records are used. For each node, the sum of all connected weights W multiplied by their accosted previous node values V is computed using Eq. (9).
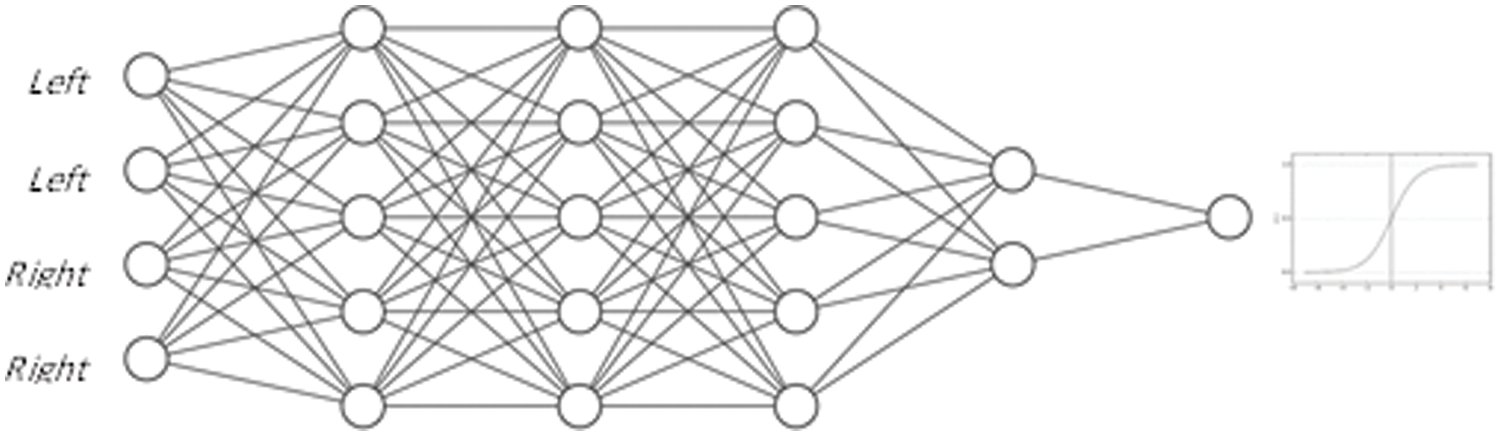
Figure 8: The architecture of NN model
The node of the output layer presents a value between 1 for lane and 0 for non-lane features. Therefore, the sigmoid activation function (Eq. (10)) is used for activation, because it guarantees that the output of each neuron is between 0 and 1. The features of each lane in each image frame are inputted into the NN model. The best output with higher accuracy and less error rate is selected as the actual lane, and the remaining ones are ignored.
The features of each lane in each image frame are entered into the NN model. The best output with higher accuracy and the lower error rate is selected as the actual lane, while the rest are discarded. In the NN model, one lane is nearly certainly chosen, but to disregard any chance of producing more than one lane at the same or higher precision rate, a simple rule of thumb model is adopted in this case.
If more than one lane is defined as the actual lane by the NN model, then the proposed rule-based model computes the sum of all white edge pixels that correspond to the left and right lines of the output lanes. The lane with the highest number of white pixels is finally determined as the actual lane. This step solves any rare possibility of failure in the previous NN model.
To evaluate the performance of the proposed method, a set of experiments was conducted, and the results were used to validate the proposed method. The measurements and experiments conducted have been widely used in previous studies to provide meaningful results on lane detection performance.
The accuracy rate measures the similarity between the detected path and the path identified in the ground reality image. It is determined by matching the pixels of the named path between the fact and outcome images. To calculate this rate, three parameters are extracted: true positive (TP), true negative (TN), and false positive (FP). These parameters are used to measure the accuracy rate that represents the matched lane pixels between the resulting lane and the labeled lanes from the KITTI ground truth data (Eq. (12)). The false detection rate measures pixels that do not belong to the lane but are detected as lanes by the proposed method (Eq. (13)). In addition to the missing detection rate that measures the undetected lanes pixels (Eq. (14)).
As indicated in Table 1, which was obtained from [12,41,53,60], the results showed that the performance of the proposed method scores a higher accuracy rate compared with the respective methods, with 92.1%, and the following methods are the simplest semantic segmentation (CNN) and the hybrid adaptive method [12,60], with nearly 88%. The proposed method also scores the minimum value of missed detection ratio by 1.74%. The [12] method comes next, i.e., by 2.54%. In the case of the false detection ratio, the proposed method achieves a low value, i.e., by 6.25%. Overall, the proposed method is the best for this measurement.

Processing in real-time and accuracy rate are the most important factors for evaluating lane detection methods. In this section, the average processing time of the proposed method is calculated in repeated experiments on a KITTI image, and the time required for each stage of the method is evaluated. Experiments are conducted with an Intel® Core i5 CPU @ 3.70 GHz and 32 GB memory without GPU interference.
Table 2 presents an analytical representation of the processing time of the proposed method in milliseconds (ms). The Average time (each phase) column displays the processing time for each stage for a single image frame. The results show that the preprocessing phase requires more time in operation by 70.8 ms, followed by the recognition of the NN by 69.2 ms. By contrast, the clustering steps in the recognition and feature extraction phases require the least time by 0.2 and 9 ms, respectively. If any frame image has challenges that require it to pass all the operations in the proposed method, then the worst-case processing time is 202.8 ms, on average. The proposed method does not rely on expensive and complicated deep learning techniques such as CNN, RNN, or Deep NN. Instead, it utilizes straightforward image preprocessing methods and light ML algorithms that use a minimal number of features. Additionally, the algorithm does not necessarily require all steps to detect lanes. Depending on the situation, certain steps may be ignored to improve efficiency.

The principle of the proposed method is to use only the required process to improve real-time. The Finished process and Applicable data columns show that only 7.5% of the image frames in the dataset pass all the processes in the proposed method. Meanwhile, 33.6% of the image frames are detected by the RFT process, and the subsequent processes are skipped. This feature improves the required real-time. Meanwhile, the Average (real-time) column shows that the actual average required for each image frame in the dataset is 156.35 ms, which is calculated based on the actual application data for each process in the proposed method. The column real-time percentage shows that the feature extraction phase requires only 3.4% of the total time due to the simple principle and costly preparations of the preparation phase, which requires 45.28% of the total time. Meanwhile, the lane detection phase requires 29.2% of the time, divided by each step of 0.13%, 18.24%, 29.39%, and 1.2% for clustering, RFT, NN, and post-processing, respectively.
In accordance with state-of-the-art methods, the processing time is the major problem in deep learning-based methods. This experiment is conducted in accordance with the urban marked road scenes in KITTI dataset images. Table 3 provides the real-time processing of the proposed method compared with a set of lane detection methods by using the KITTI dataset. The processing times of the compared methods are obtained from [12,41,53,60]. Although the processing hardware used is higher than that used in this work, the processing time of the proposed method is considerably better than those of the other methods. The proposed method requires 156.35 ms, followed by the method [12], which requires 282.48 ms.

It is evident that the machine learning methods, including DDN [46], Fast R-CNN [41], sliding window + CNN [44], Traditional image processing [40], and Image processing + K-NN and Gaussian process [12], all require a GPU to run and cannot perform this task on a CPU. This gives the proposed method an advantage in terms of processing time. The Hybrid technique, however, operates more slowly on the same hardware as the proposed method.
4.3 Performance in Various Challenges
Good streets with fine lines are not the typical conditions for vehicles. Streets have many cases of deterioration that affect the effectiveness of the lane detection process. Selected image frames with a set of deterioration challenges from the KITTI image dataset are used to demonstrate the visual performance of the proposed method in selected challenges. Fig. 9 presents the most critical issues in lane detection, which are as follows: a collection of lane lines that are off the street area (Fig. 9a), presence of vehicles in front and at the sides (Fig. 9c), uneven shadows and illuminations (Fig. 9c), absence of lane lines (Figs. 9b to 9e), vehicles parked on the driveway side (Figs. 9c and 9e), and poor-quality street surfaces (Figs. 9a to 9e). Evidently, some of the selected images suffer from more than one of the aforementioned problems.
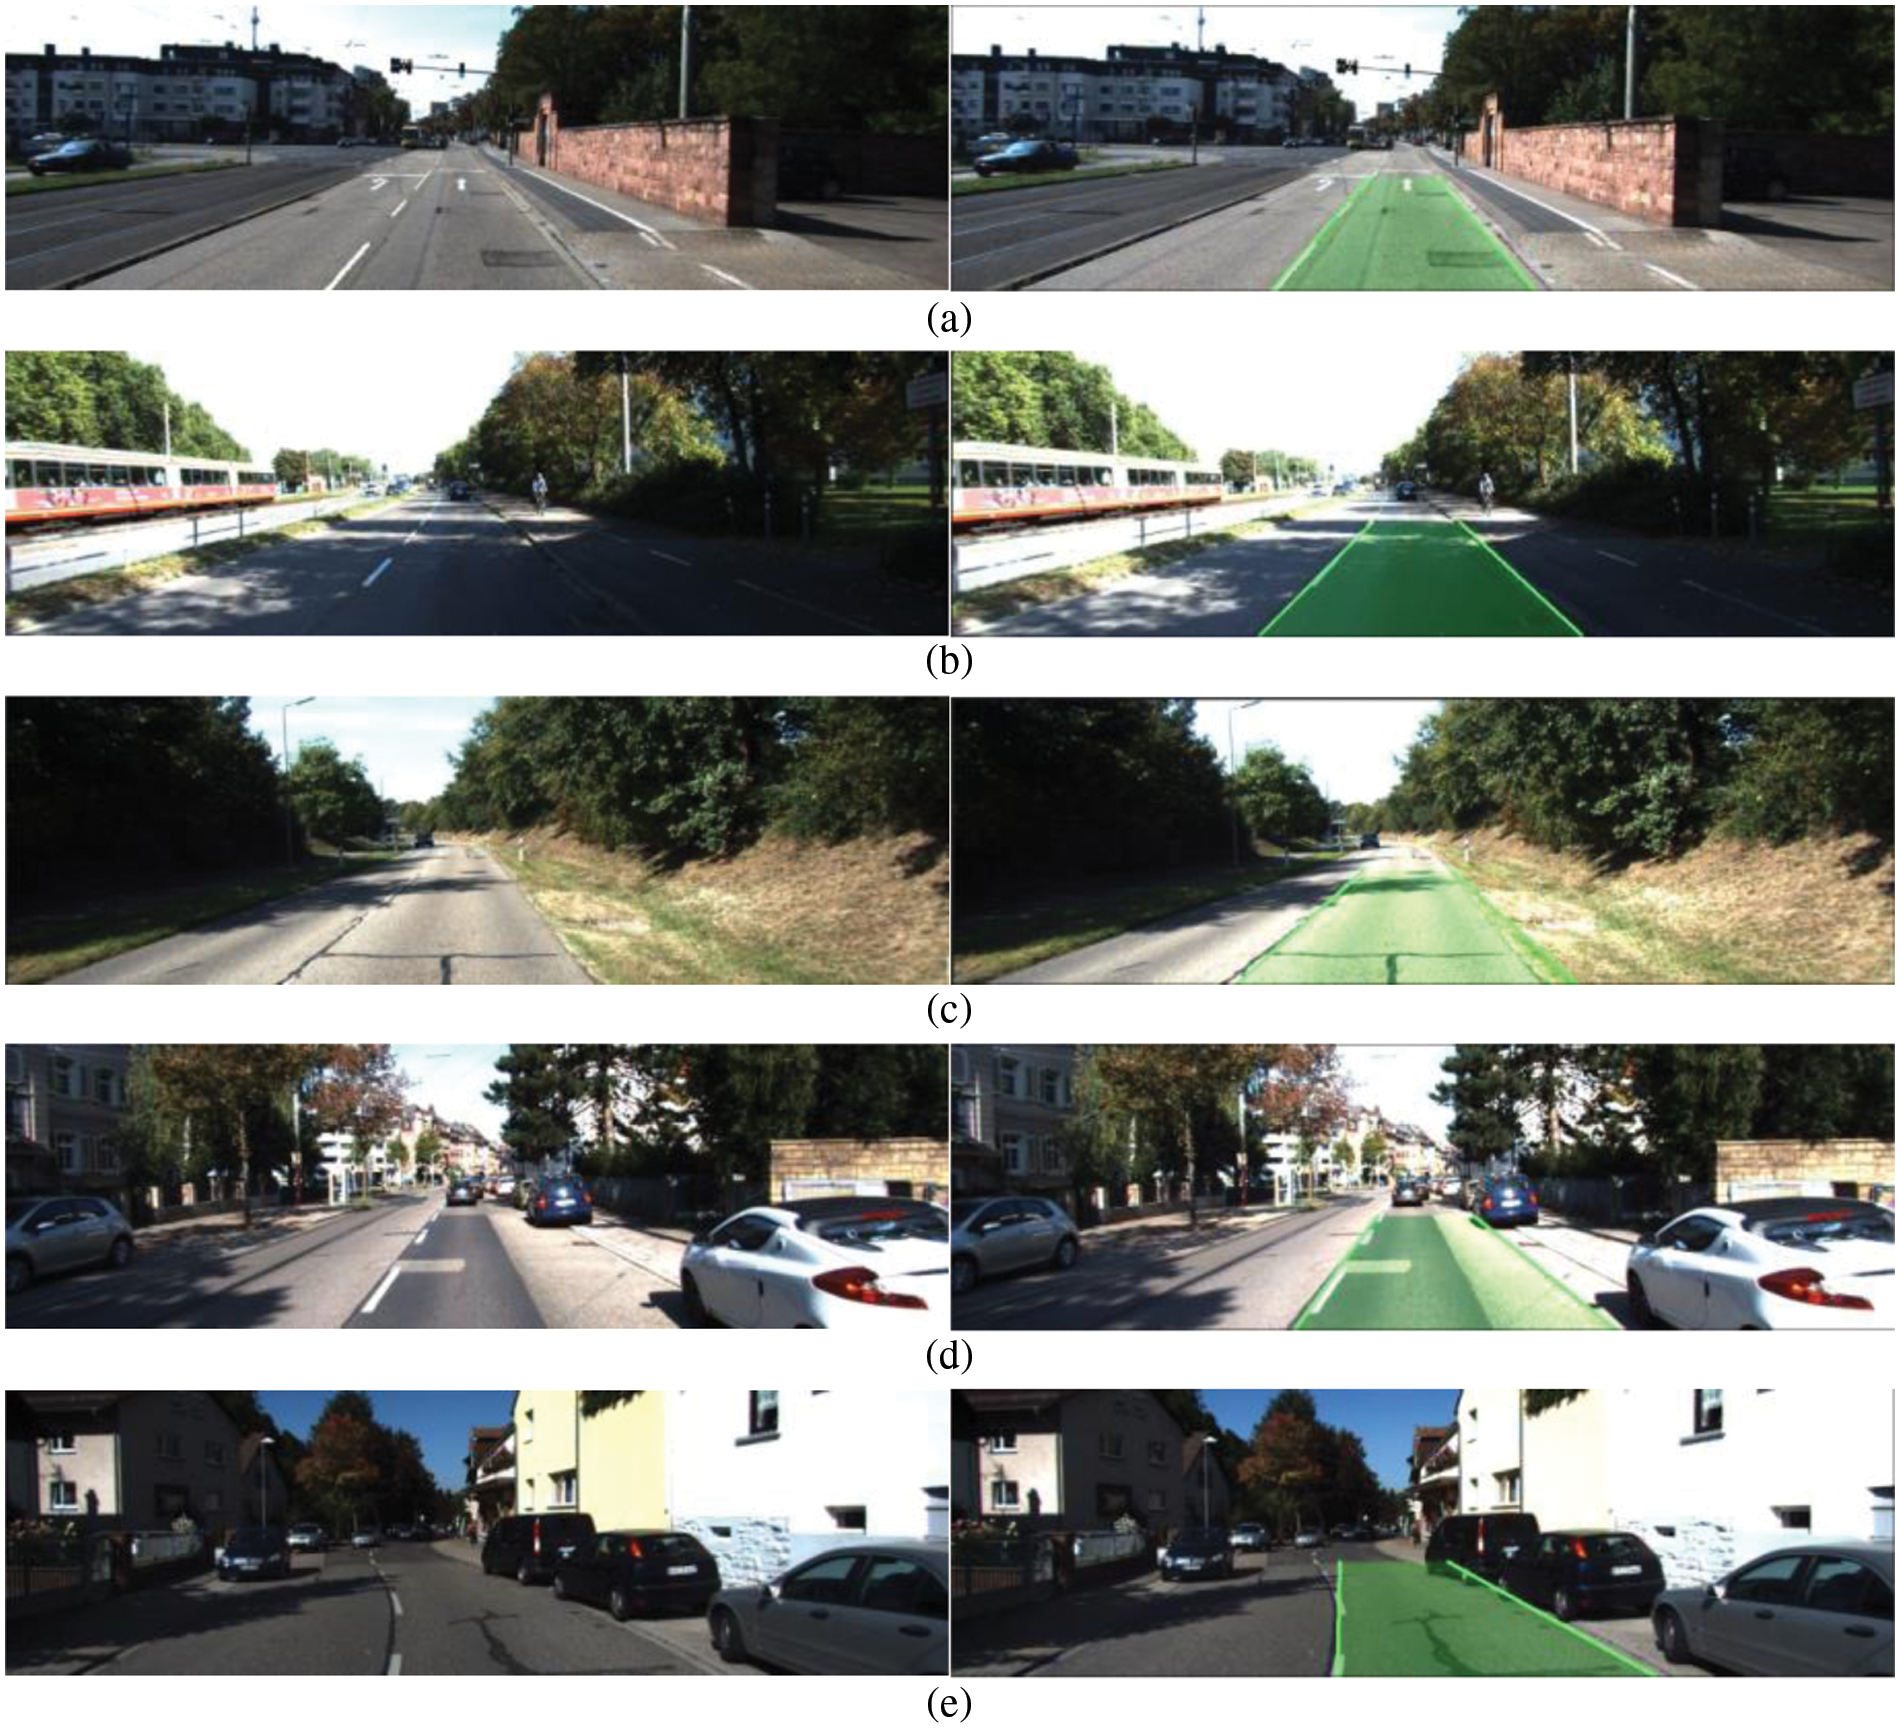
Figure 9: Original image frames of different challenges (left) and results of the proposed lane detection method (right)
The results showed that the proposed method is effective with the challenges posed by degradation conditions. It uses lane line features as the basis for detecting lanes, and it overcomes issues such as shadows and uneven illumination by using preprocessing techniques that enhance image quality and minimize negative impacts. If the lane markings are damaged or absent, the method employs surface texture to identify potential lanes. By using sensitive feature extraction and a machine learning algorithm, the method predicts the most probable lane based on the identified features of the road surface.
In general, the experiments show that the proposed method exhibits better performance than traditional lane detection and deep learning methods. In general, traditional methods fail to address critical challenges, such as the absence of lane lines, uneven illuminations, shadow, and low-quality road surfaces. Meanwhile, the proposed method overcomes these challenges by adopting ML methods for recognition. The preparation phase enables the extraction of edges that represent any texture of the road surface even if lane lines are degraded or absent. In addition, the proposed method uses the ability of the machine perspective to support the human view in the recognition process. Meanwhile, deep learning methods are expensive in terms of hardware and processing time. In addition, they require large, hand-labeled datasets for training and considerable effort to be applicable to new lane cases. The experiments show that the proposed method requires light hardware, and the adopted RFT and NN methods require simple datasets for training. Moreover, adopting a small number of attributes leads to the use of small models compared with deep learning models, which may implement thousands or even millions of attributes. Consequently, the proposed method improves processing time and reduces cost compared with deep learning methods.
The demands for inexpensive hardware and diverse training samples have a significant impact on the development of autonomous systems, including autonomous vehicles. Inexpensive hardware makes autonomous technology more accessible, which drives innovation, leading to a safer and more efficient transportation system. Moreover, the availability of diverse training samples is essential for creating autonomous systems that are reliable and accurate. Using inexpensive hardware improve the collection of data from various sources, which can be used to train machine-learning models. The proposed method scores the best performance compared with a set of recent methods as presented in Table 1. Most of the compared methods are based on recent deep-learning techniques. This finding demonstrates the effectiveness of combining traditional preprocessing with simple ML methods. In terms of processing time, Table 3 indicates that the proposed method is faster than deep learning methods. Its time is adequate by 156.35 ms per frame, and it processes about six frames per second.
By analyzing the processing time of the proposed method, image frame preparation and the recognition process take about 45% and 49% of the total time, respectively. Thus, the use of fast image processing methods and ML models can improve the real-time of the framework. The feature extraction phase is fast, accounting for about 5.8% of the total time. Reducing noise and improving the ability to preserve edge pixels in the preparation phase will considerably improve the feature extraction ability, and consequently, accuracy. In addition, using more features from the frames can improve the accuracy rate. However, this method disregards the curved line in this work, which should be a concern in future research. Moreover, the impact of the hardware should be evaluated in future work. Performance with wide ranges of hardware capabilities and the differences between GPUs and CPUs should be evaluated significantly.
In this study, a lane detection method is proposed by combining the advantages of image processing and simple ML techniques. The preparation phase improves image quality and removes all unwanted information to keep the vertical edge one-pixel wide. The feature extraction phase is quick and simple because it only extracts the position of the intersection point and the degree of angle of edges. The features extracted by a set of sequential ML methods are used in lane detection. Each ML method supports the next method in the lane detection phase. Once an ML method discovers the lane, the following methods are skipped. Experiments and training use the KITTI dataset for lane discovery. The proposed method achieves an accuracy of 92.1%. The average time for a single image frame is about 156.35 ms. The results demonstrate that the proposed method is better than traditional and deep learning methods. Moreover, it is easy to develop, requires inexpensive hardware and data, saves time, and improves accuracy.
Acknowledgement: The author would like to thank anonymous reviewers for their constructive feedback.
Funding Statement: This research was funded by DEANSHIP OF SCIENTIFIC RESEARCH AT UMM AL-QURA UNIVERSITY, Grant Number 22UQU4361009DSR04.
Conflicts of Interest: The author declares that he has no conflicts of interest to report regarding the present study.
References
1. T. Deng and Y. Wu, “Simultaneous vehicle and lane detection via MobileNetV3 in car following scene,” PLoS One, vol. 17, no. 3, pp. e0264551, 2022. [Google Scholar] [PubMed]
2. J. Dinnes, P. Sharma, S. Berhane, S. S. van Wyk, N. Nyaaba et al., “Rapid, point-of-care antigen tests for diagnosis of SARS-CoV-2 infection,” Cochrane Database ofSystematic Reviews, no. 7, 2022. [Google Scholar]
3. C. Li, B. Zhang, J. Shi and G. Cheng, “Multi-level domain adaptation for lane detection,” in IEEE/CVF Conf. on Computer Vision and Pattern Recognition, New Orleans, pp. 4379–4388, 2022. [Google Scholar]
4. J. Tang, S. Li and P. Liu, “A review of lane detection methods based on deep learning,” Pattern Recognit., vol. 111, pp. 107623, 2021. [Google Scholar]
5. D. K. Dewangan and S. P. Sahu, “Driving behavior analysis of intelligent vehicle system for lane detection using vision-sensor,” IEEE Sens. J., vol. 21, no. 5, pp. 6367–6375, 2021. [Google Scholar]
6. A. Geiger, P. Lenz, C. Stiller and R. Urtasun, “Vision meets robotics: The KITTI dataset,” The International Journal of Robotics Research, vol. 32, no. 11, pp. 1–6, 2013. [Google Scholar]
7. S. J. Huang and C. C. Tsai, “Vehicle lane detection and following based on vision system and laser scanner,” in Proc. 2017 IEEE Int. Conf. Appl. Syst. Innov. Mod. Technol. ICASI 2017, Japan, pp. 1446–1449, 2017. [Google Scholar]
8. M. Lee, J. Lee, D. Lee, W. Kim, S. Hwang et al., “Robust lane detection via expanded self attention,” in Proc.—2022 IEEE/CVF Winter Conf. Appl. Comput. Vision, WACV 2022, USA, pp. 1949–1958, 2022. [Google Scholar]
9. D. Liang, Y. C. Guo, S. K. Zhang, T. J. Mu and X. Huang, “Lane detection: A survey with new results,” J. Comput. Sci. Technol., vol. 35, no. 3, pp. 493–505, 2020. [Google Scholar]
10. P. Zhao, B. Fang and W. Bin Yang, “A robust lane detection algorithm based on differential excitation,” in Proc.—Int. Conf. Mach. Learn. Cybern., Korea, vol. 2, pp. 1015–1020, 2016. [Google Scholar]
11. A. Küçükmanisa, G. Tarım and O. Urhan, “Real-time illumination and shadow invariant lane detection on mobile platform,” J. Real-Time Image Process., vol. 16, no. 5, pp. 1781–1794, 2019. [Google Scholar]
12. K. H. Almotairi, “Hybrid adaptive method for lane detection of degraded road surface condition,” J. King Saud Univ. Inf. Sci., vol. 34, no. 8, pp. 5261–5272, 2022. [Google Scholar]
13. D. Tsiktsiris, N. Dimitriou, A. Lalas, M. Dasygenis, K. Votis et al., “Real-time abnormal event detection for enhanced security in autonomous shuttles mobility infrastructures,” Sensors, vol. 20, no. 17, pp. 4943, 2020. [Google Scholar] [PubMed]
14. J. Cao, C. Song, S. Song, F. Xiao and S. Peng, “Lane detection algorithm for intelligent vehicles in complex road conditions and dynamic environments,” Sensors (Switzerland), vol. 19, no. 14, pp. 1–21, 2019. [Google Scholar]
15. H. Wang, Y. Wang, X. Zhao, G. Wang, H. Huang et al., “Lane detection of curving road for structural highway with straight-curve model on vision,” IEEE Trans. Veh. Technol., vol. 68, no. 6, pp. 5321–5330, 2019. [Google Scholar]
16. L. Tabelini, R. Berriel, T. M. Paixão, C. Badue, A. F. de Souza et al., “Keep your eyes on the lane: Real-time attention-guided lane detection,” in Proc. IEEE Comput. Soc. Conf. Comput. Vis. Pattern Recognit., Tokyo, pp. 294–302, 2021. [Google Scholar]
17. C. Lee and J. H. Moon, “Robust lane detection and tracking for real-time applications,” IEEE Trans. Intell. Transp. Syst., vol. 19, no. 12, pp. 4043–4048, 2018. [Google Scholar]
18. I. El Hajjouji, A. El Mourabit, Z. Asrih, B. Bernoussi and S. Mars, “Real-time lane detection in different illumination conditions,” in Proc. Int. Conf. Microelectron. ICM, Casablanca, vol. 2016-March, pp. 63–66, 2016. [Google Scholar]
19. J. Dabass and R. Vig, “Biomedical image enhancement using different techniques—A comparative study,” Commun. Comput. Inf. Sci., vol. 799, pp. 260–286, 2018. [Google Scholar]
20. N. Dey, “Uneven illumination correction of digital images: A survey of the state-of-the-art,” Optik, vol. 183, no. February, pp. 483–495, 2019. [Google Scholar]
21. K. G. Dhal, A. Das, S. Ray, J. Gálvez and S. Das, “Histogram equalization variants as optimization problems: A review,” Arch. Comput. Methods Eng., vol. 28, no. 3, pp. 1471–1496, 2021. [Google Scholar]
22. J. P. Greco, J. E. Greene, M. A. Strauss, L. A. Macarthur, X. Flowers et al., “Illuminating low surface brightness galaxies with the hyper suprime-cam survey,” Astrophys. J., vol. 857, no. 2, pp. 104, 2018. [Google Scholar]
23. R. R. Hussein, Y. I. Hamodi and R. A. Sabri, “Retinex theory for color image enhancement: A systematic review,” Int. J. Electr. Comput. Eng., vol. 9, no. 6, pp. 5560–5569, 2019. [Google Scholar]
24. M. Wang, Z. Tian, W. Gui, X. Zhang and W. Wang, “Low-light image enhancement based on nonsubsampled shearlet transform,” IEEE Access, vol. 8, pp. 63162–63174, 2020. [Google Scholar]
25. B. Bataineh and K. H. Almotairi, “Enhancement method for color retinal fundus images based on structural details and illumination improvements,” Arab. J. Sci. Eng., vol. 46, no. 9, pp. 8121–8135, 2021. [Google Scholar]
26. S. P. Narote, P. N. Bhujbal, A. S. Narote and D. M. Dhane, “A review of recent advances in lane detection and departure warning system,” Pattern Recognit., vol. 73, pp. 216–234, 2018. [Google Scholar]
27. D. C. Andrade, F. Bueno, F. R. Franco, R. A. Silva, J. H. Z. Neme et al., “A novel strategy for road lane detection and tracking based on a vehicle’s forward monocular camera,” IEEE Trans. Intell. Transp. Syst., vol. 20, no. 4, pp. 1497–1507, 2019. [Google Scholar]
28. H. Du, “Lane line detection and vehicle identification using monocular camera based on MATLAB,” Academic Journal of Computing & Information Science, vol. 4, no. 2, pp. 55–60, 2021. [Google Scholar]
29. R. Muthalagu, A. Bolimera and V. Kalaichelvi, “Lane detection technique based on perspective transformation and histogram analysis for self-driving cars,” Comput. Electr. Eng., vol. 85, pp. 106653, 2020. [Google Scholar]
30. B. Bataineh, S. N. H. S. Abdullah and K. Omar, “An adaptive local binarization method for document images based on a novel thresholding method and dynamic windows,” Pattern Recognit. Lett., vol. 32, no. 14, pp. 1805–1813, 2011. [Google Scholar]
31. B. Bataineh and M. K. Y. Shambour, “A robust algorithm for emoji detection in smartphone screenshot images,” J. ICT Res. Appl., vol. 13, no. 3, pp. 192–212, 2019. [Google Scholar]
32. D. Neven, B. De Brabandere, S. Georgoulis, M. Proesmans and L. Van Gool, “Towards end-to-end lane detection: An instance segmentation approach,” in IEEE Intell. Veh. Symp. Proc., China, vol. 2018, pp. 286–291, 2018. [Google Scholar]
33. B. Chen, Y. Chen, Z. Shao, T. Tong and L. Luo, “Blood vessel enhancement via multi-dictionary and sparse coding: Application to retinal vessel enhancing,” Neurocomputing, vol. 200, pp. 110–117, 2016. [Google Scholar]
34. K. B. Kim and D. H. Song, “Real time road lane detection with RANSAC and HSV color transformation,” J. Inf. Commun. Converg. Eng., vol. 15, no. 3, pp. 187–192, 2017. [Google Scholar]
35. W. Song, Y. Yang, M. Fu, Y. Li and M. Wang, “Lane detection and classification for forward collision warning system based on stereo vision,” IEEE Sens. J., vol. 18, no. 12, pp. 5151–5163, 2018. [Google Scholar]
36. U. Ozgunalp and N. Dahnoun, “Robust lane detection & tracking based on novel feature extraction and lane categorization,” in ICASSP, IEEE Int. Conf. Acoust. Speech Signal Process.—Proc., Italy, pp. 8129–8133, 2014. [Google Scholar]
37. T. M. Hoang, N. R. Baek, S. W. Cho, K. W. Kim and K. R. Park, “Road lane detection robust to shadows based on a fuzzy system using a visible light camera sensor,” Sensors (Switzerland), vol. 17, no. 11, pp. 1–29, 2017. [Google Scholar]
38. X. Yan and Y. Li, “A method of lane edge detection based on canny algorithm,” in Proc.—2017 Chinese Autom. Congr. CAC 2017, China, vol. 2017, pp. 2120–2124, 2017. [Google Scholar]
39. Y. Yeniaydin and K. W. Schmidt, “A lane detection algorithm based on reliable lane markings,” in 26th IEEE Signal Process. Commun. Appl. Conf. SIU 2018, Turkey, pp. 1–4, 2018. [Google Scholar]
40. M. Rezwanul Haque, M. Milon Islam, K. Saeed Alam and H. Iqbal, “A computer vision based lane detection approach,” Int. J. Image, Graph. Signal Process., vol. 11, no. 3, pp. 27–34, 2019. [Google Scholar]
41. Y. Tian, J. Gelernter, X. Wang, W. Chen, J. Gao et al., “Lane marking detection via deep convolutional neural network,” Neurocomputing, vol. 280, pp. 46–55, 2018. https://doi.org/10.1016/j.neucom.2017.09.098 [Google Scholar] [PubMed] [CrossRef]
42. E. Oğuz, A. Küçükmanisa, R. Duvar and O. Urhan, “A deep learning based fast lane detection approach,” Chaos, Solitons & Fractals, vol. 155, pp. 111722, 2022. [Google Scholar]
43. Z. Qin, H. Wang and X. Li, “Ultra fast structure-aware deep lane detection,” in European Conf. on Computer Vision, UK, pp. 276–291, 2020. [Google Scholar]
44. B. Huval, T. Wang, S. Tandon, J. Kiske, W. Song et al., “An empirical evaluation of deep learning on highway driving,” arXiv Prepr. arXiv1504.01716, 2015. [Google Scholar]
45. X. Pan, J. Shi, P. Luo, X. Wang and X. Tang, “Spatial as deep: Spatial cnn for traffic scene understanding,” in Proc. of the AAAI Conf. on Artificial Intelligence, New Orleans, vol. 32, no. 1, 2018. [Google Scholar]
46. R. Mohan, “Deep deconvolutional networks for scene parsing,” arXiv Prepr. arXiv1411.4101, 2014. [Google Scholar]
47. G. Li, Y. Yang, X. Qu, D. Cao and K. Li, “A deep learning based image enhancement approach for autonomous driving at night,” Knowledge-Based Syst., vol. 213, pp. 106617, 2021. [Google Scholar]
48. Y. Kortli, S. Gabsi, L. F. C. L. Y. Voon, M. Jridi, M. Merzougui et al., “Deep embedded hybrid CNN–LSTM network for lane detection on NVIDIA Jetson Xavier NX,” Knowledge-based Syst., vol. 240, pp. 107941, 2022. [Google Scholar]
49. D. K. Dewangan, S. P. Sahu, B. Sairam and A. Agrawal, “VLDNet: Vision-based lane region detection network for intelligent vehicle system using semantic segmentation,” Computing, vol. 103, no. 12, pp. 2867–2892, 2021. [Google Scholar]
50. L. Liu, X. Chen, S. Zhu and P. Tan, “Condlanenet: A top-to-down lane detection framework based on conditional convolution,” in Proc. IEEE Int. Conf. Comput. Vis., Tokyo, pp. 3753–3762, 2021. [Google Scholar]
51. S. Lee, J. Kim, J. Shin Yoon, S. Shin, O. Bailo et al., “Vpgnet: Vanishing point guided network for lane and road marking detection and recognition,” in Proc. of the IEEE Int. Conf. on Computer Vision, Italy, pp. 1947–1955, 2017. [Google Scholar]
52. Q. Zou, H. Jiang, Q. Dai, Y. Yue, L. Chen et al., “Robust lane detection from continuous driving scenes using deep neural networks,” IEEE Trans. Veh. Technol., vol. 69, no. 1, pp. 41–54, 2020. [Google Scholar]
53. Q. Tian, G. Xie, Y. Wang and Y. Zhang, “Pedestrian detection based on laplace operator image enhancement algorithm and faster R-CNN,” in 2018 11th Int. Congress on Image and Signal Processing, BioMedical Engineering and Informatics (CISP-BMEI), China, pp. 1–5, 2018. [Google Scholar]
54. T. Wen, D. Yang, K. Jiang, C. Yu, J. Lin et al., “Bridging the gap of lane detection performance between different datasets: Unified viewpoint transformation,” IEEE Trans. Intell. Transp. Syst., vol. 22, no. 10, pp. 6198–6207, 2020. [Google Scholar]
55. J. Ma, X. Fan, S. X. Yang, X. Zhang and X. Zhu, “Contrast limited adaptive histogram equalization-based fusion in YIQ and HSI color spaces for underwater image enhancement,” Int. J. Pattern Recognit. Artif. Intell., vol. 32, no. 7, pp. 1–26, 2018. [Google Scholar]
56. N. Hassan, S. Ullah, N. Bhatti, H. Mahmood and M. Zia, “A cascaded approach for image defogging based on physical and enhancement models,” Signal, Image Video Process., vol. 14, no. 5, pp. 867–875, 2020. [Google Scholar]
57. B. Bataineh and M. K. Alqudah, “Evaluation of skeletonization methods for document images with rotation states,” in 2019 Amity Int. Conf. on Artificial Intelligence (AICAI), Dubai, pp. 424–428, 2019. [Google Scholar]
58. B. Bataineh, “Fast component density clustering in spatial databases: A novel algorithm,” Information, vol. 13, no. 10, pp. 477, 2022. [Google Scholar]
59. M. Hahsler, M. Piekenbrock and D. Doran, “Dbscan: Fast density-based clustering with R,” J. Stat. Softw., vol. 91, no. 1, pp. 1–28, 2019. [Google Scholar]
60. G. L. Oliveira, W. Burgard and T. Brox, “Efficient deep models for monocular road segmentation,” in 2016 IEEE/RSJ Int. Conf. on Intelligent Robots and Systems (IROS), Korea, pp. 4885–4891, 2016. [Google Scholar]
Cite This Article
 Copyright © 2023 The Author(s). Published by Tech Science Press.
This work is licensed under a Creative Commons Attribution 4.0 International License , which permits unrestricted use, distribution, and reproduction in any medium, provided the original work is properly cited.
 Downloads
 Citation Tools