
 Submit a Paper
 Propose a Special lssue
 Open Access
ARTICLE

Optimization of Mortar Compressive Strength Prepared with Waste Glass Aggregate and Coir Fiber Addition Using Response Surface Methodology
1
Department of Civil Engineering, Universitas Abulyatama, Aceh Besar, 23372, Indonesia
2
Advanced Engineering Materials and Nano Technology Research Center, Universitas Abulyatama, Aceh Besar, 23372, Indonesia
3
Faculty of Fisheries, Universitas Abulyatama, Aceh Besar, 23372, Indonesia
4
Department of Mechanical Engineering, Universitas Abulyatama, Aceh Besar, 23372, Indonesia
5
Advanced Engineering Materials and Composites Research Center (AEMC), Department of Mechanical and Manufacturing
Engineering, Universiti Putra Malaysia, Selangor, 43400, Malaysia
6
Department of Mechanical Engineering, Universitas Malahayati, Lampung, 35153, Indonesia
7
Department of Civil Engineering, Millitary College of Engineering, Risalpur, 24080, Pakistan
8
Department of Construction Management, Qujing Normal University, Qujing, 655011, China
* Corresponding Author: Cut Rahmawati. Email:
(This article belongs to the Special Issue: Sustainable Concrete with Recyclable Materials)
Journal of Renewable Materials 2023, 11(10), 3751-3767. https://doi.org/10.32604/jrm.2023.028987
Received 21 January 2023; Accepted 24 March 2023; Issue published 10 August 2023
 View Full Text
 Download PDF
Abstract
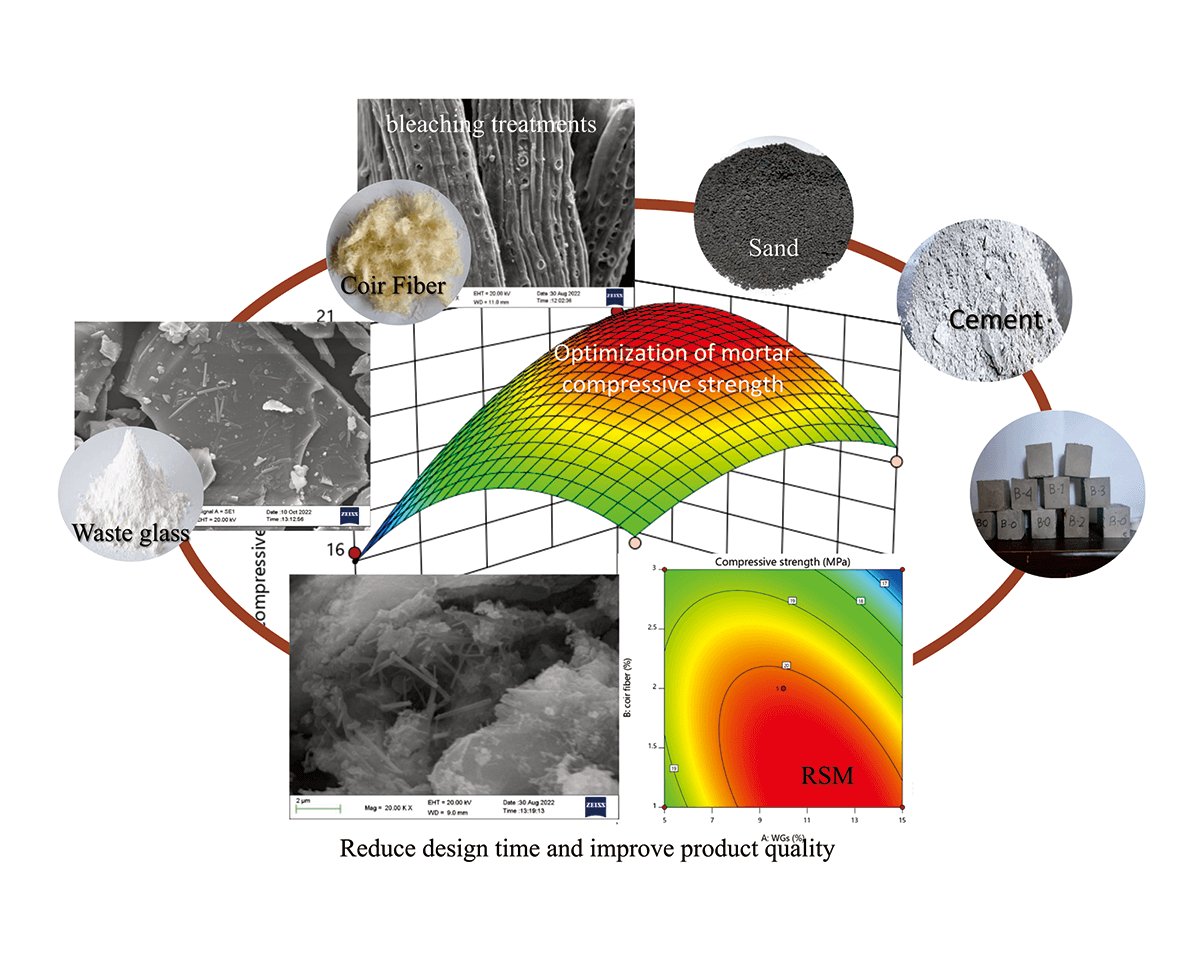
Waste Glass (WGs) and Coir Fiber (CF) are not widely utilized, even though their silica and cellulose content can be used to create construction materials. This study aimed to optimize mortar compressive strength using Response Surface Methodology (RSM). The Central Composite Design (CCD) was applied to determine the optimization of WGs and CF addition to the mortar compressive strength. Compressive strength and microstructure testing with Scanning Electron Microscope (SEM), Fourier-transform Infrared Spectroscopy (FT-IR), and X-Ray Diffraction (XRD) were conducted to specify the mechanical ability and bonding between the matrix, CF, and WGs. The results showed that the chemical treatment of CF produced 49.15% cellulose, with an average particle size of 1521 µm. The regression of a second-order polynomial model yielded an optimum composition consisting of 12.776% WGs and 2.344% CF with a predicted compressive strength of 19.1023 MPa. C–S–H gels were identified in the mortars due to the dissolving of SiO2 in WGs and cement. The silica from WGs increased the C–S–H phase. CF plays a role in preventing, bridging, and branching micro-cracks before reaching maximum stress. WGs aggregates and chemically treated CF are suitable to be composited in mortar to increase compressive strength.Graphic Abstract
Keywords
Nomenclature
| WGs | Waste Glass |
| CF | Coir Fiber |
| RSM | Response Surface Methodology |
| | Central Composite Design |
| SEM | Scanning Electron Microscope |
| FT-IR | Fourier-Transform Infrared Spectroscopy |
| XRD | X-Ray Diffraction |
Waste management is a severe environmental issue requiring proper handling. Efforts have been made to utilize waste glass (WGs) and natural fibers as reinforcement for construction materials. Therefore, it is necessary to further study the effects of the two composites on the mortar compressive strength. Many studies have been carried out on the replacement of aggregates utilizing wastes, such as glass waste [1], tin cans [2,3], rice husk ash [4,5], copper slag [6], and more. WGs is utilized as a substitute for sand because it has a chemical composition and physical characteristics similar to sand. Utilizing 20% WGs as a sand substitute increased the compressive strength of concrete [7]. Unfortunately, most WGs are not recycled but discarded, polluting the environment and causing severe ecological problems [8,9]. Hence, the utilization of WGs in concrete preparation has attracted many researchers in protecting the environment, saving natural resources, and improving the performance of concrete construction [10–12].
Meanwhile, the use of natural fiber as reinforcement in cement-based construction materials has continued to increase in recent years to overcome the limitations of toughness and tensile strength [13]. Cracks in concrete result from low tensile strength. The ability to bridge the crack growth shows good performance of fibers [14–16]. This study used coir fiber (CF) because of its cellulose binding well with cement. CF is the strongest natural fiber, with four to six times higher strain than other fibers [17].
In developing these two materials composites (WGs and CF), it is necessary to know their optimal values so that the mortar can provide the best compressive strength. Response Surface Methodology (RSM) is a suitable tool for this purpose. It is a robust technique for systematically designing and analyzing different experiments. Models are developed to predict the outputs of the experiment, including statistical approaches to determine the relationship between independent input and dependent output variables [18]. The advantages of using RSM to design experiments include: a) fewer experiments need to be conducted, b) statistical models can be developed for desired output variables, c) relationships between factors and responses are known more quickly, and d) response optimization can be performed for desired constraints [19].
Researchers developed RSM to optimize mechanical strength with several variables [20–23]. RSM can optimize the use of Ordinary Portland Cement (OPC) and silica fume content on the compressive strength of ultra-high performance fiber-reinforced concrete [24]. This methodology is also effective in modeling and optimizing polyvinyl alcohol (PVA) fiber-reinforced nanosilica, which is self-compacting engineered cementitious composites [25]. The influence of variables is examined on elastic modulus, compressive strength, and energy absorption.
Althogh RSM is successfully used for the modeling and optimization of concrete. Not many studies have examined the optimal use of WGs and CF in cement-based composites. Therefore, this study aimed to determine the percentage utilization of WGs and CF in mortar compressive strength optimization. The urgency of establishing the relationship between influencing factors and influenced parameters as output and input variables are significant. Before RSM was conducted, CF was chemically treated to obtain cellulose. The percentage of WGs used was 5% to 15%, and the CF was 1% to 3%. In this study, experiments were implemented using Central Composite Design (CCD) because it has a good correlation between experimental and predicted values of responses. The microstructural properties of CF and WGs and CF-based mortar were determined using Scanning Electron Microscopy (SEM), X-ray Diffraction (XRD), and Fourier Transform Infrared (FT-IR).
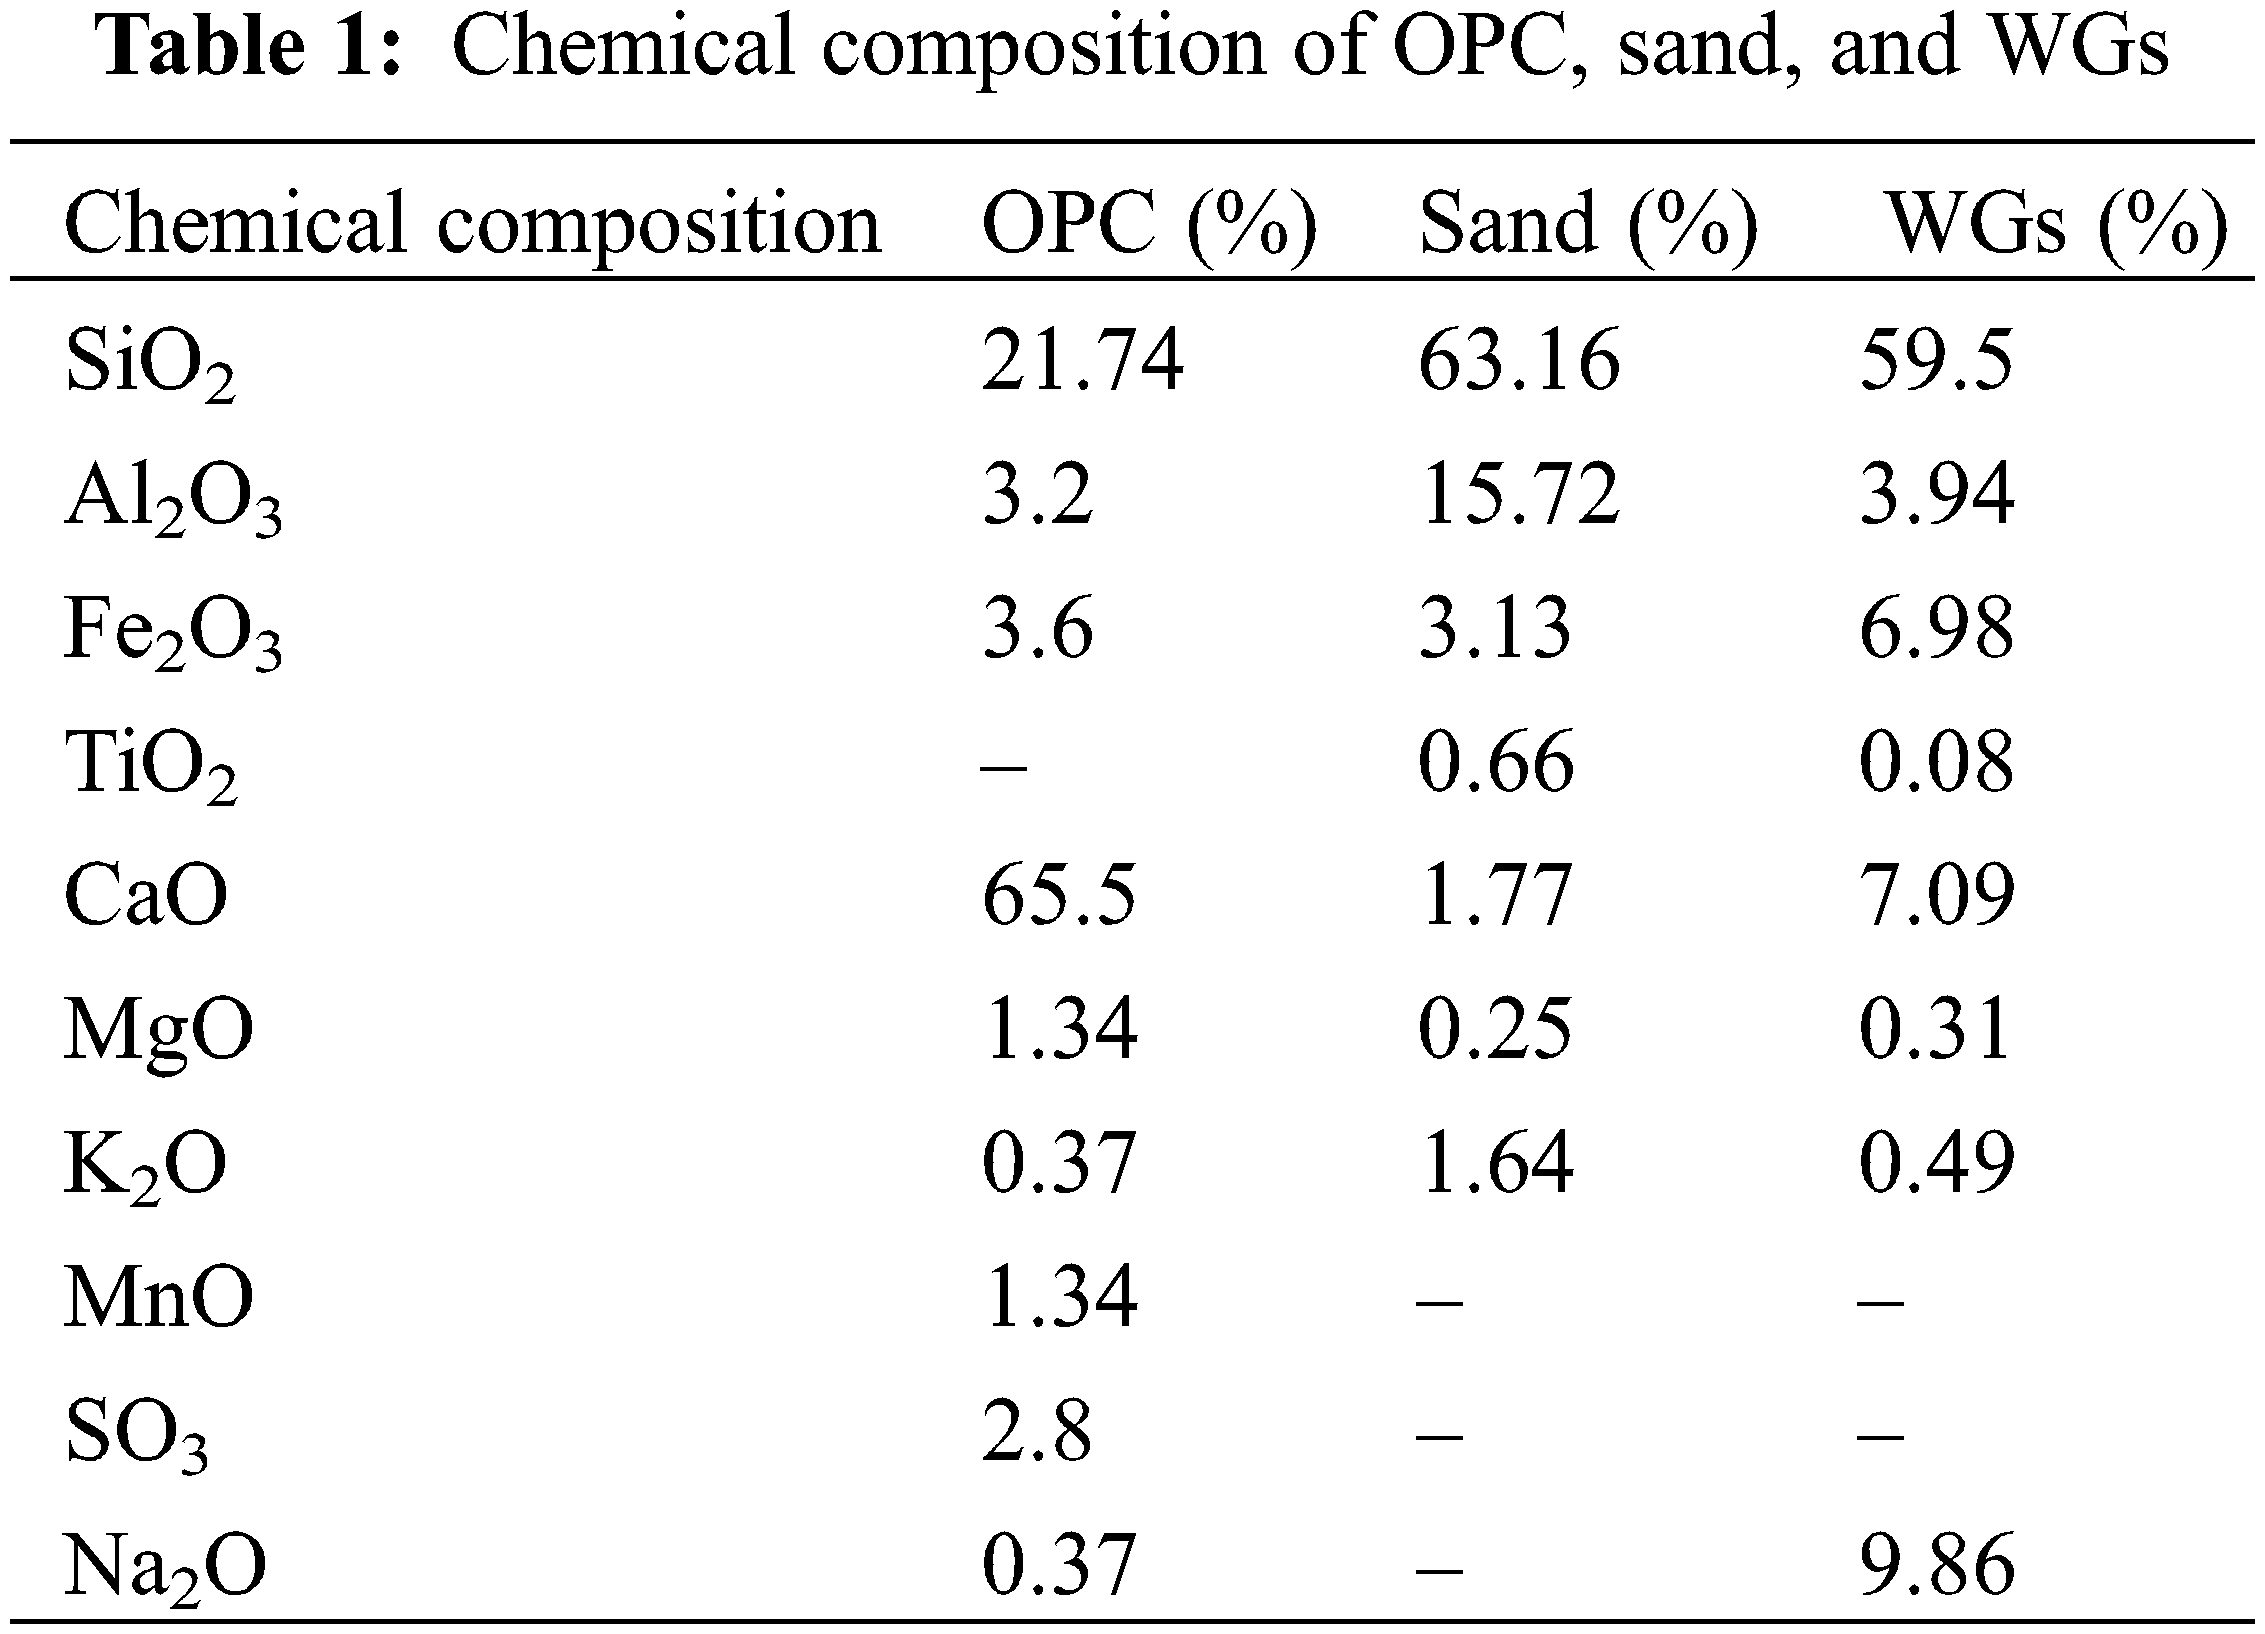
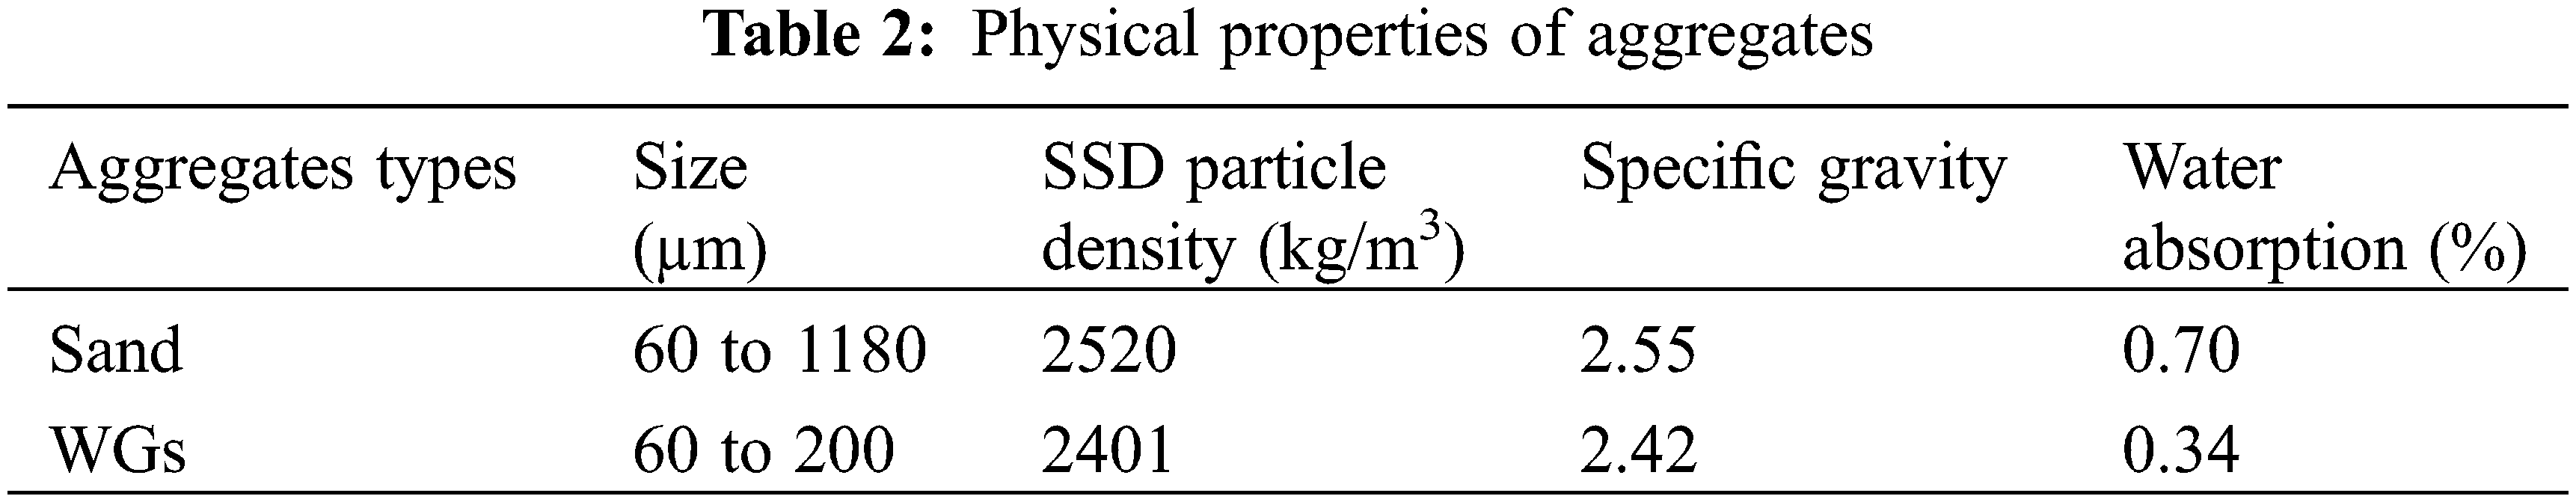
The chemicals used to obtain cellulose from CF were sodium hydroxide (NaOH, 97%, Merck) and hydrogen peroxide (H2O2, 50%, Merck). Natural fine aggregates from local suppliers were used to produce mortar. OPC Type I, locally produced, was used in this study. The WGs aggregates were obtained from a grinding machine with a final particle size grading below 600 µm. Fig. 1 shows SEM micrographs of the WGs. The chemical composition of OPC, sand, and WGs was analyzed by X-ray fluorescence (XRF) testing, and the results are shown in Table 1. The physical properties of sand and WGs are displayed in Table 2.
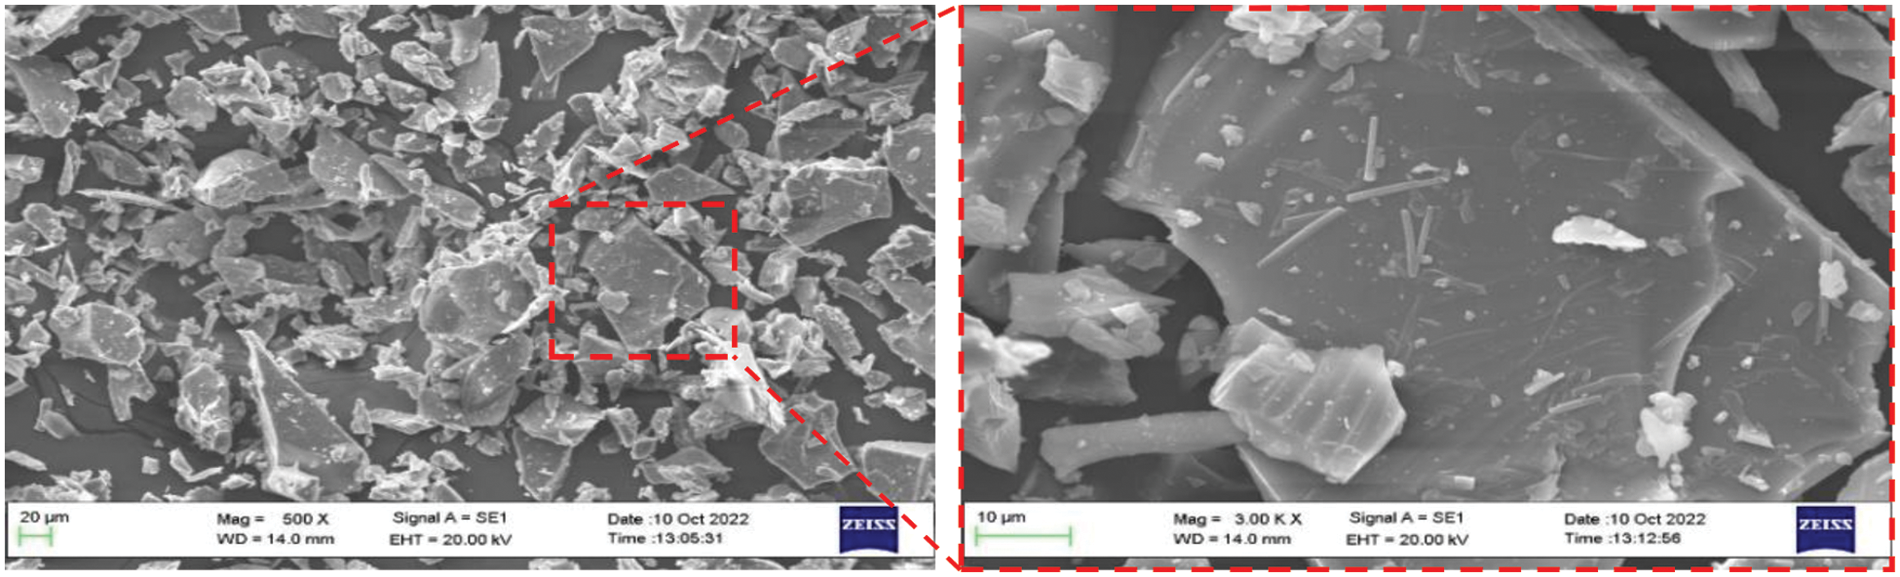
Figure 1: SEM micrographs of WGs
2.2 Extraction of Coir Fiber (CF)
The extraction of CF is shown in Fig. 2. First, CF was cleaned and cut to a size of 5 mm. Then, alkalization treatment was carried out by preparing CF, which refluxed with 1 M NaOH at 90°C for one hour. Furthermore, bleaching treatments were carried out using 1M NaOH and 1M H2O2 solutions at 50°C for 1.5 h in a ratio of 1:20 (g/mL). The fibers were washed with distillate water and dried to reach a constant weight. The chemical composition of coconut fiber (coir) before and after chemical treatment was determined using Chesson data [26]. The product yield from cellulose is calculated by dividing the mass of the cellulose product obtained by the mass of the initial sample [27].
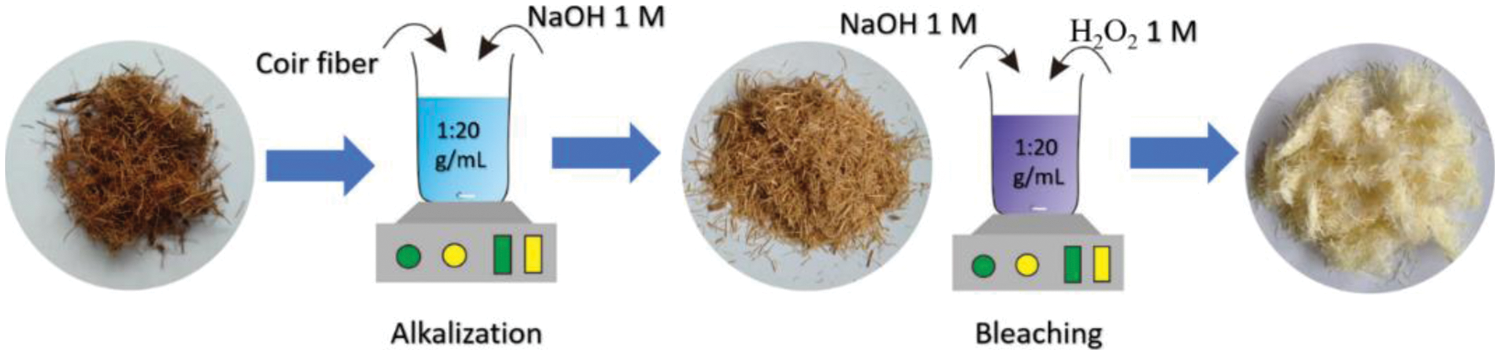
Figure 2: Schematic illustration of the CF extraction process
2.3 Samples Preparation and Characterization
2.3.1 Sample Preparation and Testing
In studying the effect of CF and WGs contents on the compressive strength of mortar, thirteen mortars were prepared according to the experiment design. The mix ratio of OPC and sand for mortar production was 1:2, and the volume of OPC in each sample was replaced by 0% to 3% CF. WGs is a partial substitute for sand with 0% to 15%. The water-to-binder ratio used was 0.4. Specimens were produced by placing all ingredients in a Hobart mixer and stirring for approximately 15 min. The mixture was then poured into a 50 mm × 50 mm × 50 mm cube mold. After 24 h, the specimens were removed from the mold and labeled according to their respective codes. The compressive strength test was conducted according to ASTM C-109 [28], using an ADR-Auto V2.0 BS EN 3000/250 kN machine with an incremental load of 3–5 kg/sec. Tests were conducted when the specimens were 28 days old.
2.3.2 Microstructure Characterization
The microstructures and surface morphologies were examined by SEM, EVOMA 15, ZEISS, from Germany. The specimens were imaged with an accelerating voltage of 5 kV at a working distance of 8 mm. ImageJ software was used to determine the CF length after bleaching treatment. In addition, FT-IR spectra were measured using IRPrestige-21, Shimadzu, Kyoto, Japan. The spectra were obtained using 25 scans at a resolution of 4 cm−1 for each sample, with scanning ranges ranging from 4000 to 400 cm−1, and analyzed with Spectrum software. XRD spectra were measured using Shimadzu XRD-7000, Japan. The XRD scans were performed at 10 to 50° 2theta with a scan speed of 0.5 s/step.
2.4 Experimental Design and Statistical Analysis
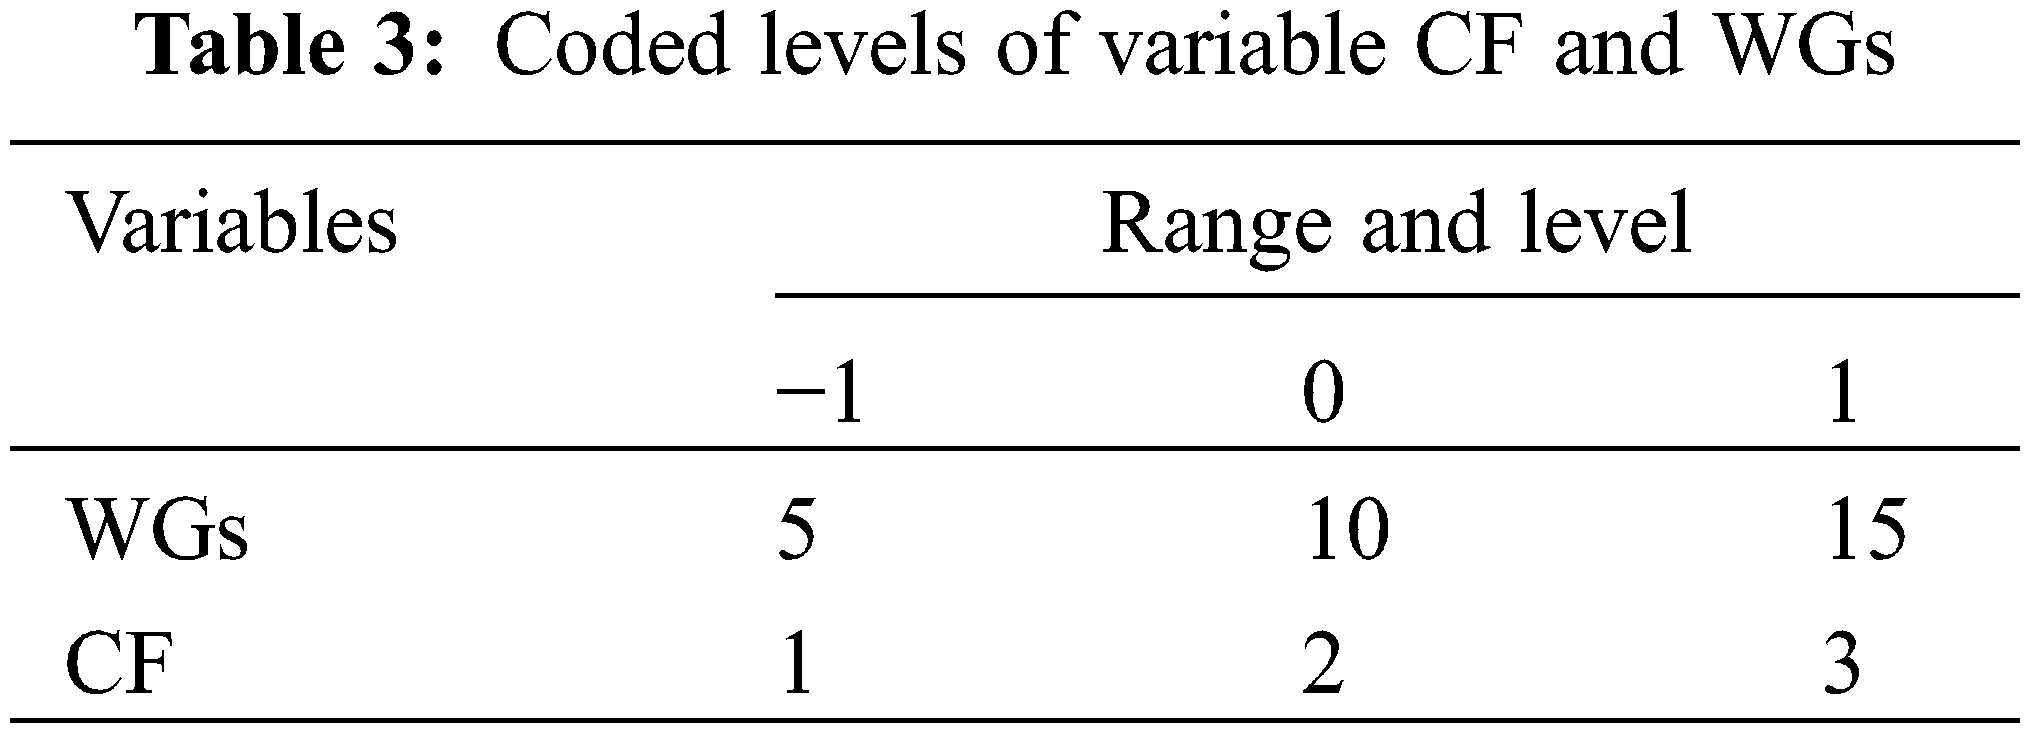
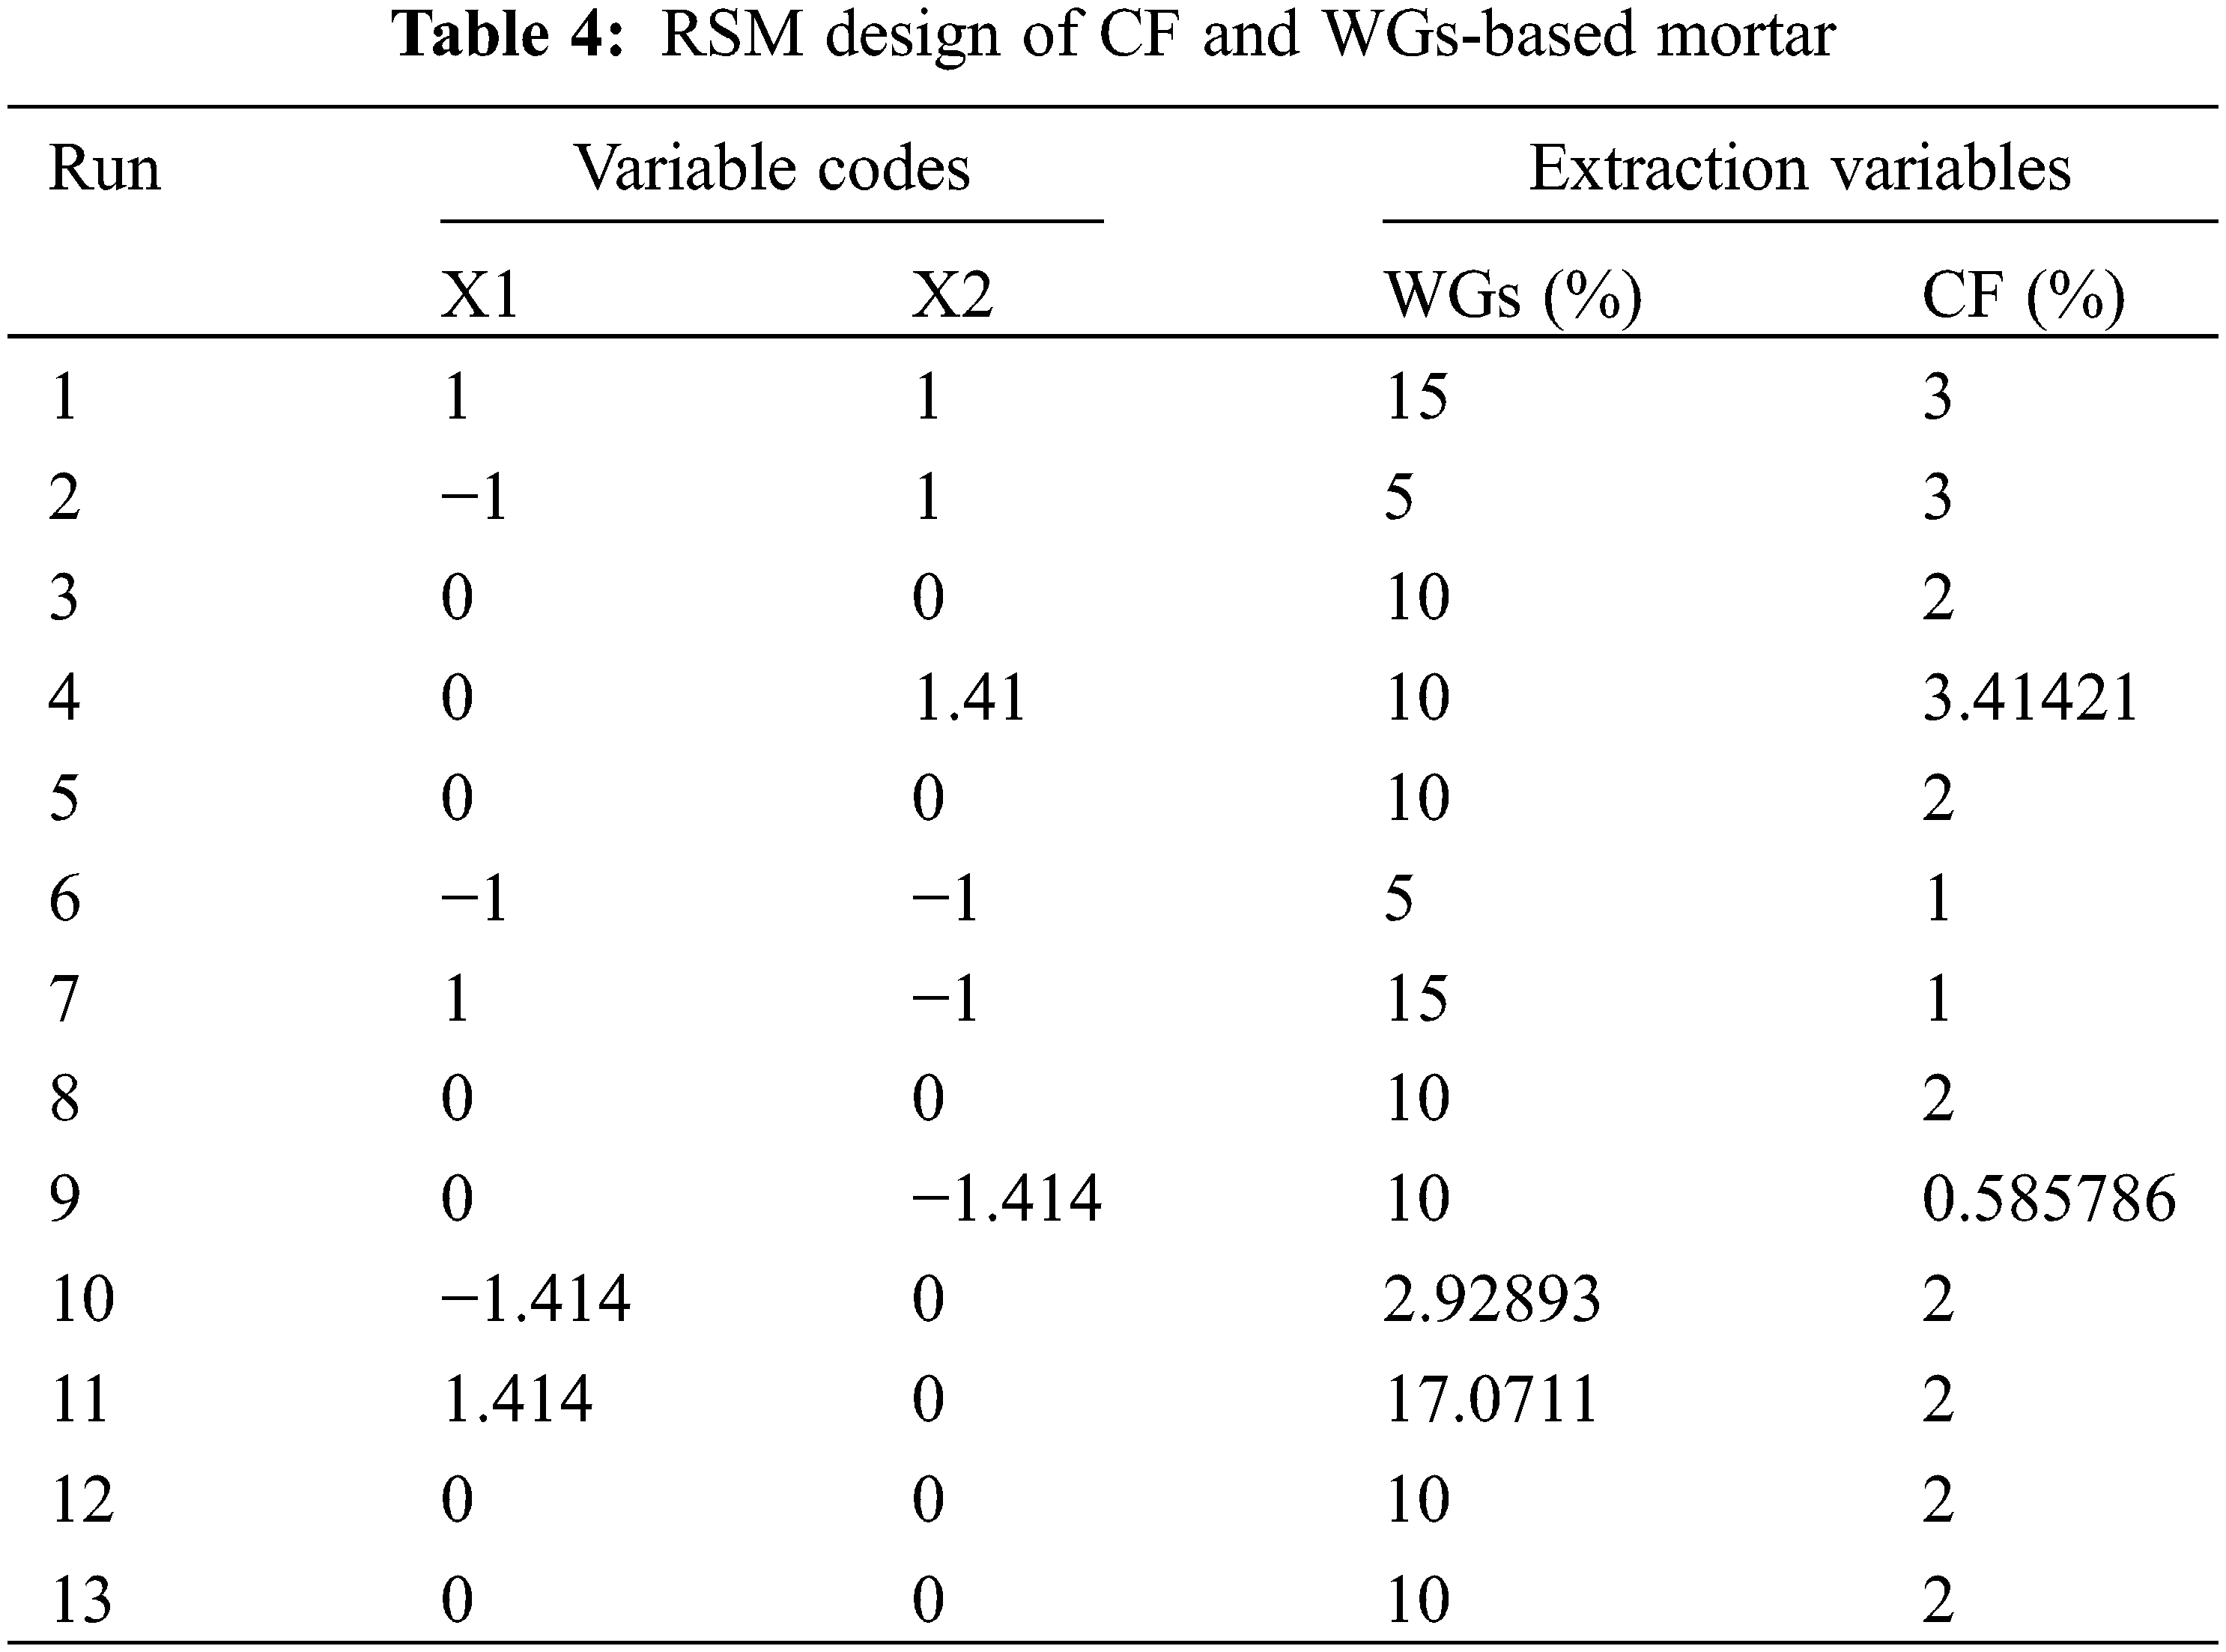
CF and WGs-based mortar optimization was designed using CCD-based RSM. The independent variables were WGs concentration (X1) and CF concentration (X2). Based on Design Expert software using the CCD method, the experimental design was produced with 13 experimental runs, with a center point of five runs. Table 3 shows coded-level factors and variables.
Quadratic models were used to estimate the response surfaces for the compressive strength of mortar, calculated according to the 2nd-degree polynomial Eq. (1) [29].
where y is the predicted response, 0 is a constant, i represents the coefficient variable for linear terms, ii denotes the coefficient variable for quadratic terms, ij represents the coefficient variable for interactive terms, and Xi and Xj are the independent variables of WGs and CF concentration, respectively. The variation of each factor is classified into three categories: linear, quadratic, and interactive. Table 4 shows the configuration of the RSM for the design of CF and WGs-based mortar.
3.1 Characterization of Fibers
Table 5 shows the treatments given to the fibers produced different chemical compositions. It resulted in the contents of cellulose from 23.45% to 49.15%; hemicellulose from 18.84% to 32.56%; lignin from 10.33% to 10.37%, and the ash range from 9.03% to 15.41%.
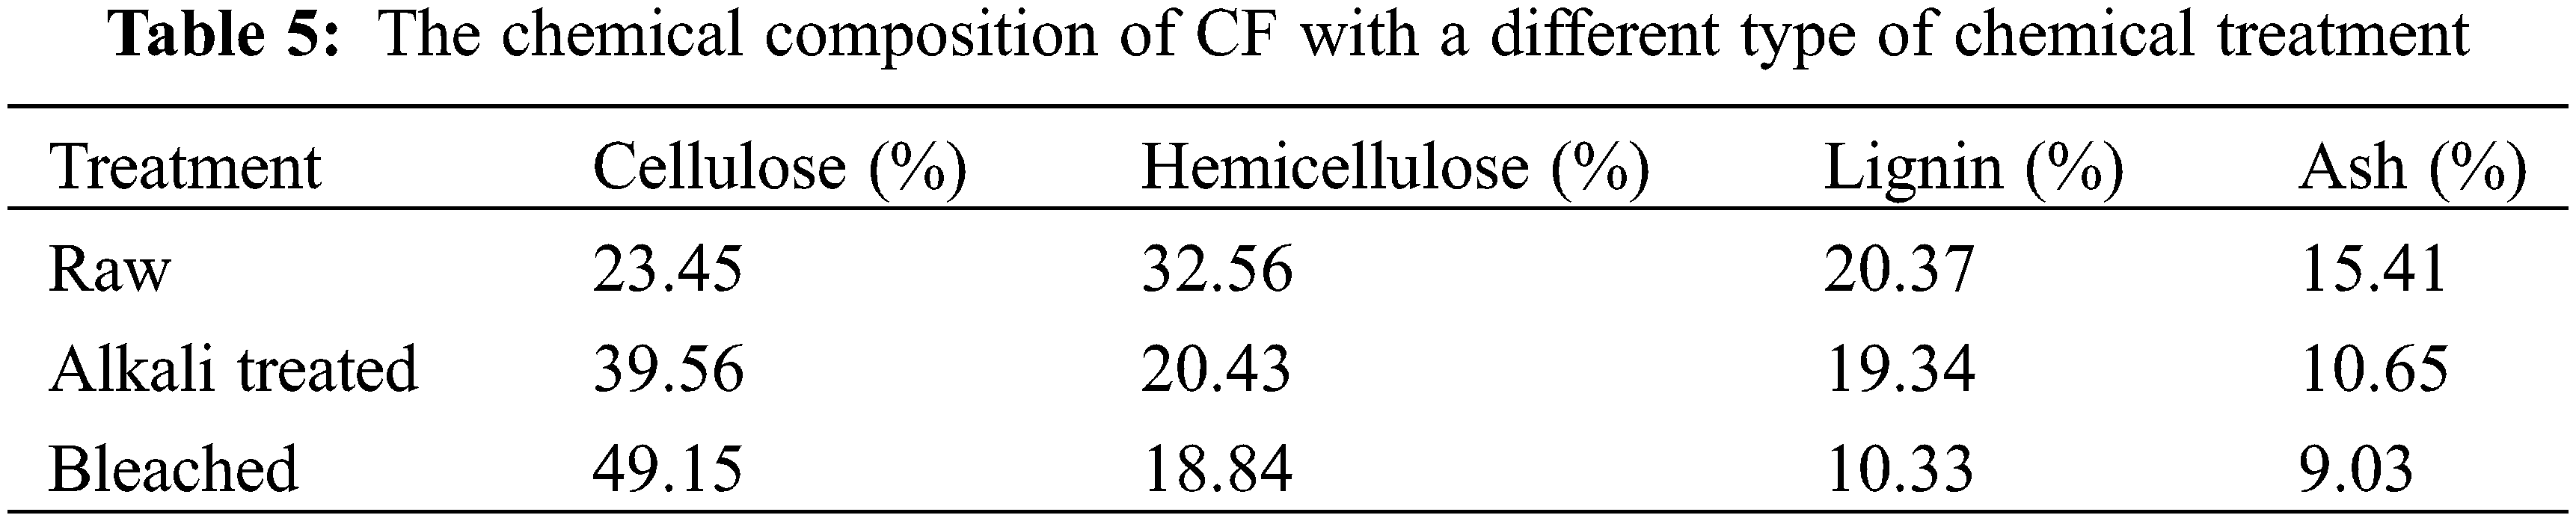
Table 5 shows that the cellulose content of CF after chemical treatment increased by 2.1 times from the raw material. It shows that the bleached treatment removed hemicellulose and lignin, increasing cellulose content. It helps bond the fibers when composite with the cement-based matrix [13]. The cellulose yield from coconut fiber using 1M NaOH and 1M H2O2 solutions at 50°C is 21.43%. The results indicated the possibility of efficiently recovering cellulose. This also showed that hemicellulose and lignin had been hydrolyzed.
Chemical treatment has changed CF morphology. Fig. 3 shows the SEM micrographs of CF under various treatments.
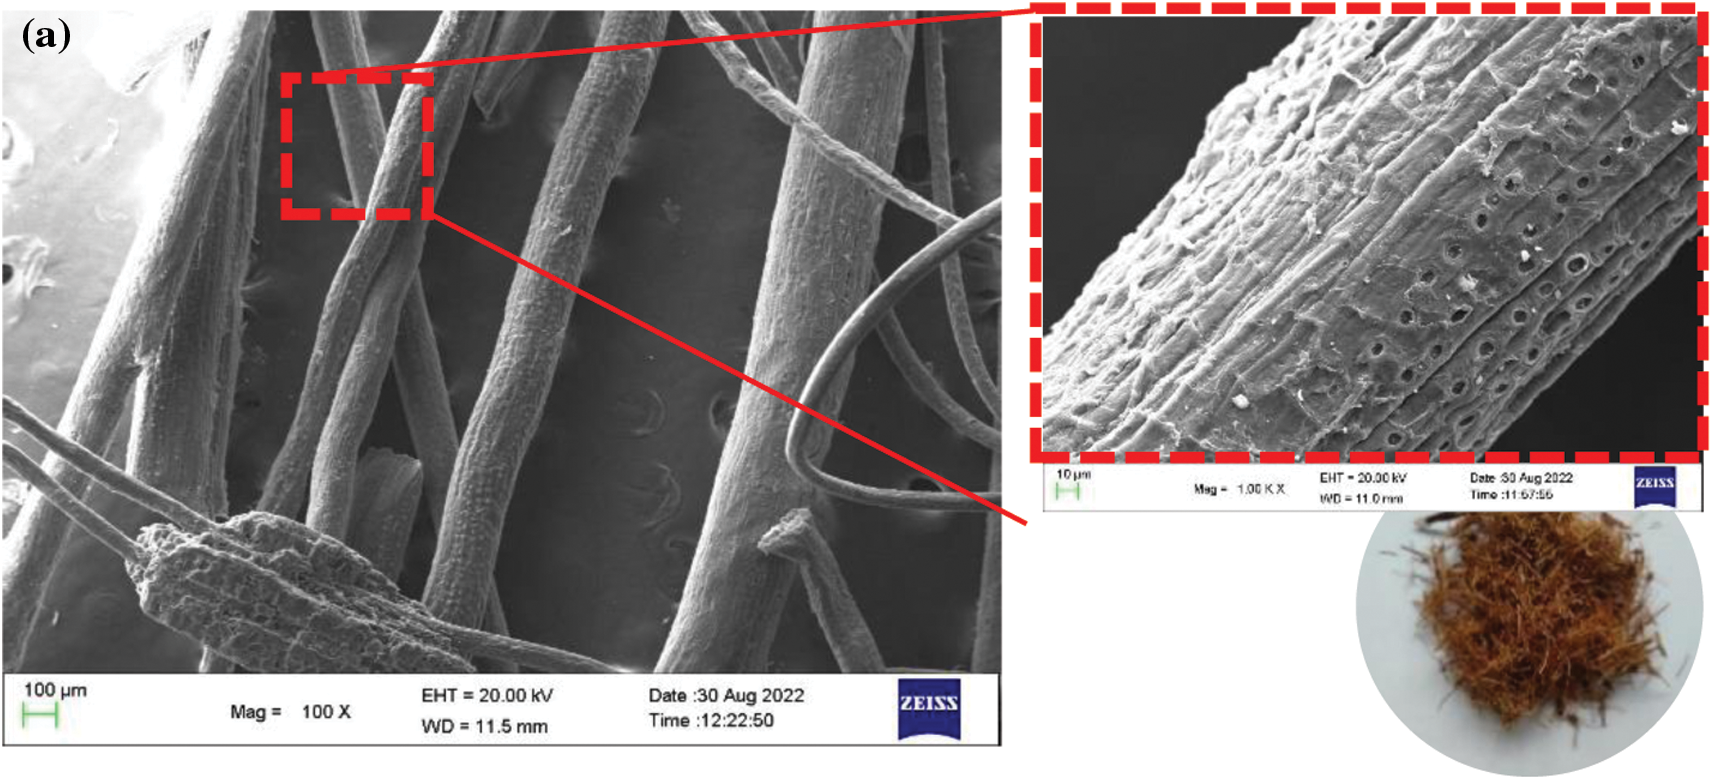
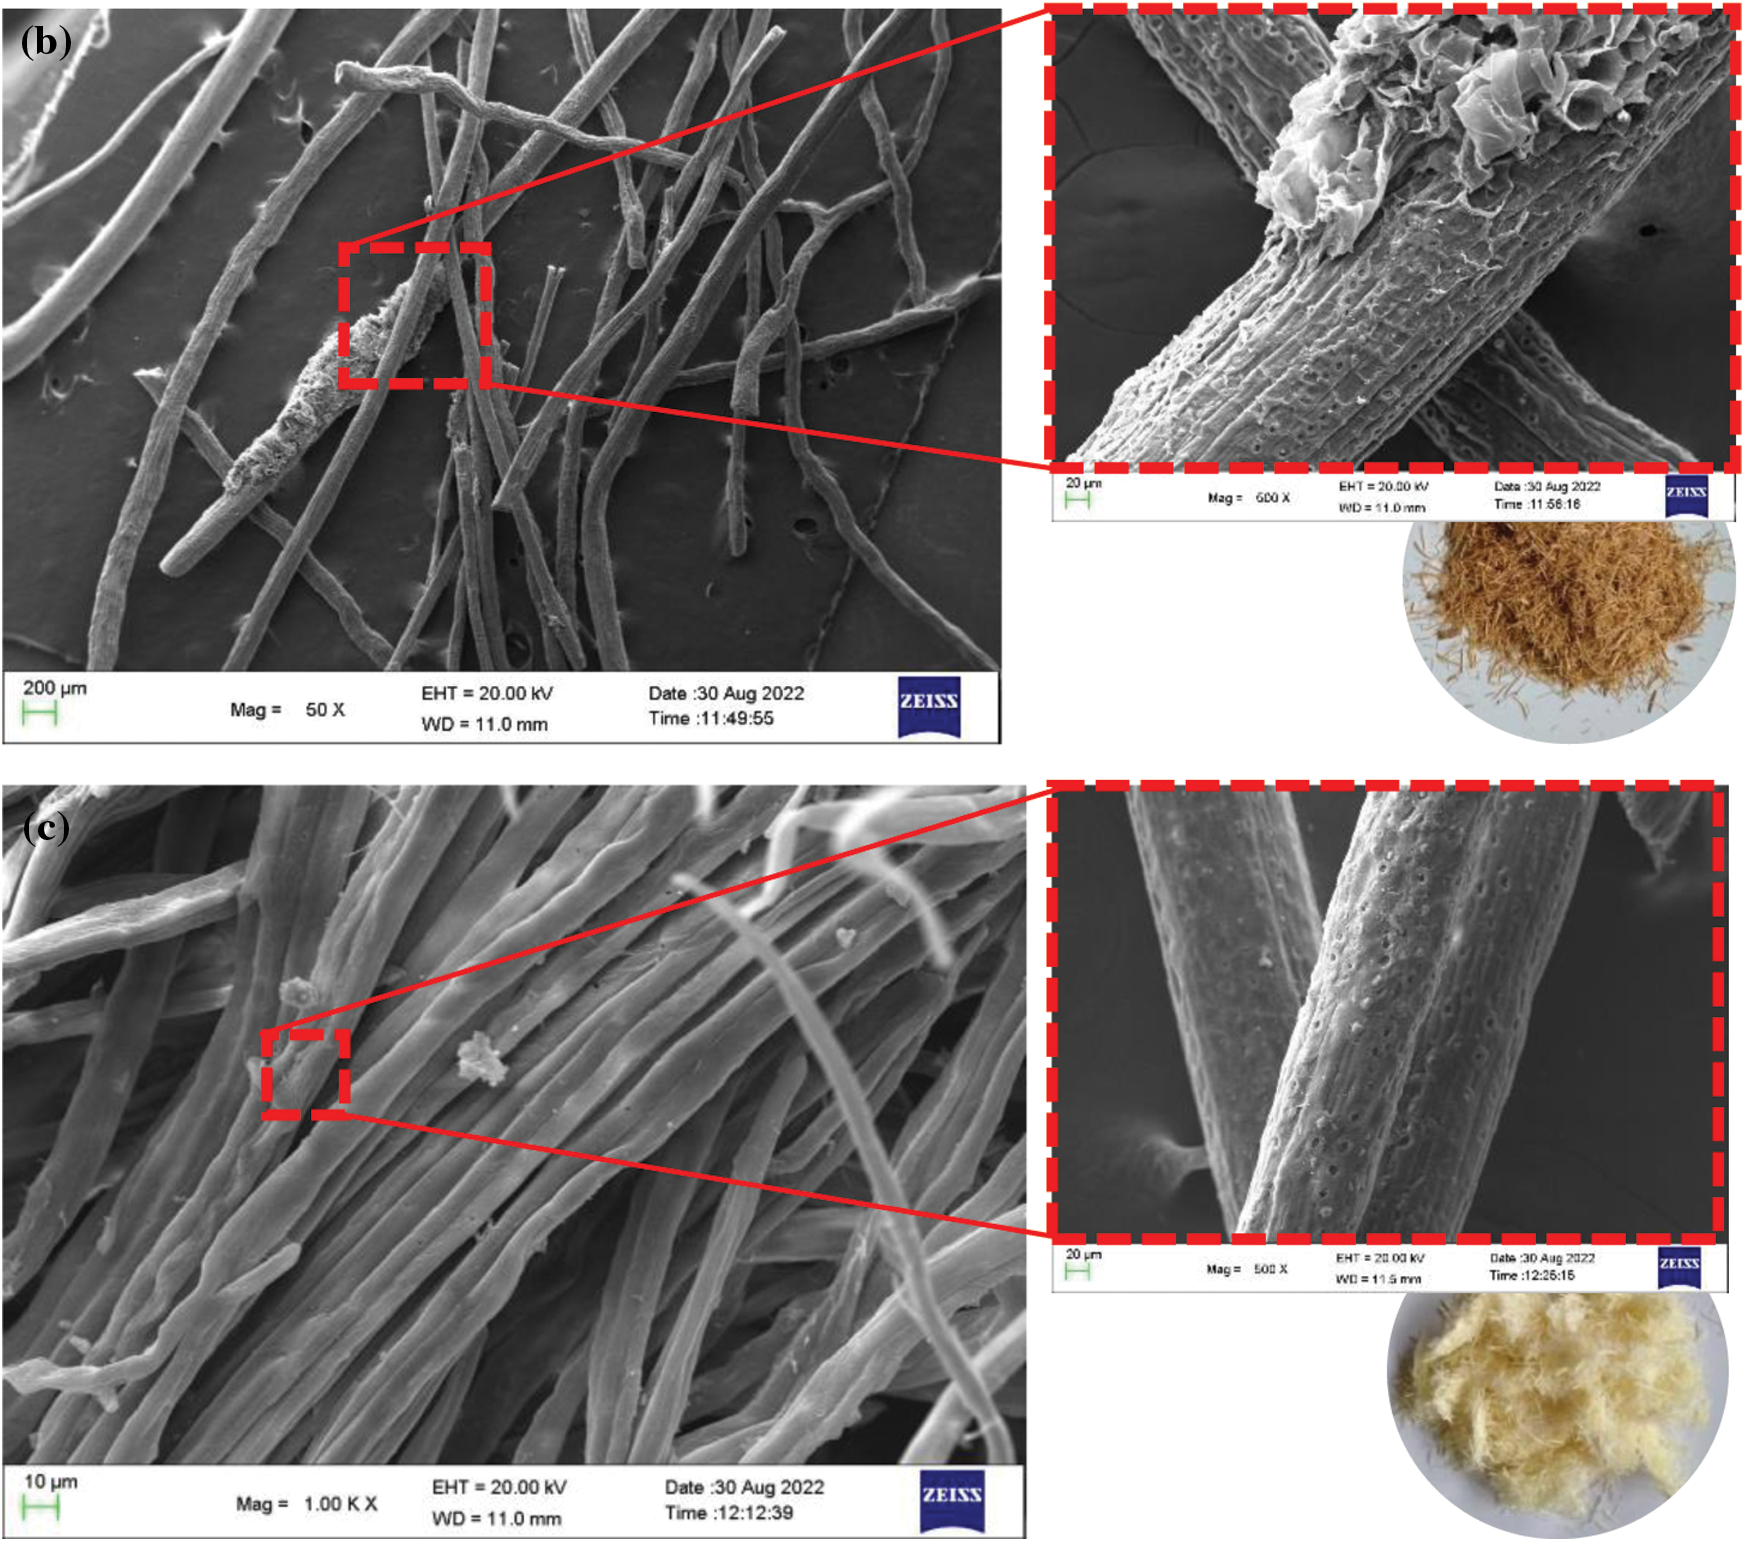
Figure 3: SEM images of CF under various treatments: (a) Raw material, (b) Alkalization, (c) Bleaching
The color changes in CF in Fig. 3 are caused by H2O2 successfully removing non-cellulose materials and other impurities such as lignin, hemicellulose, pectin, and others [30,31]. The final white product was a clear indication of 49.15% cellulose. The alkalization process has modified the fiber surface, as shown by the peeling off of the outer fibers. The CF already looked slightly cleaner in the bleaching process, but impurities remained visible.
The longest CF is in the range of 500–3000 µm. The average fiber length is about 1521 µm. This fiber length is commonly used in natural fiber-based composite materials. In this study, CF has a specific gravity of 1.44 g.cm−3. Table 6 shows some fiber types and lengths used in the cementitious matrix.
3.2 Structural Characterization of WGs and CF Based Mortar
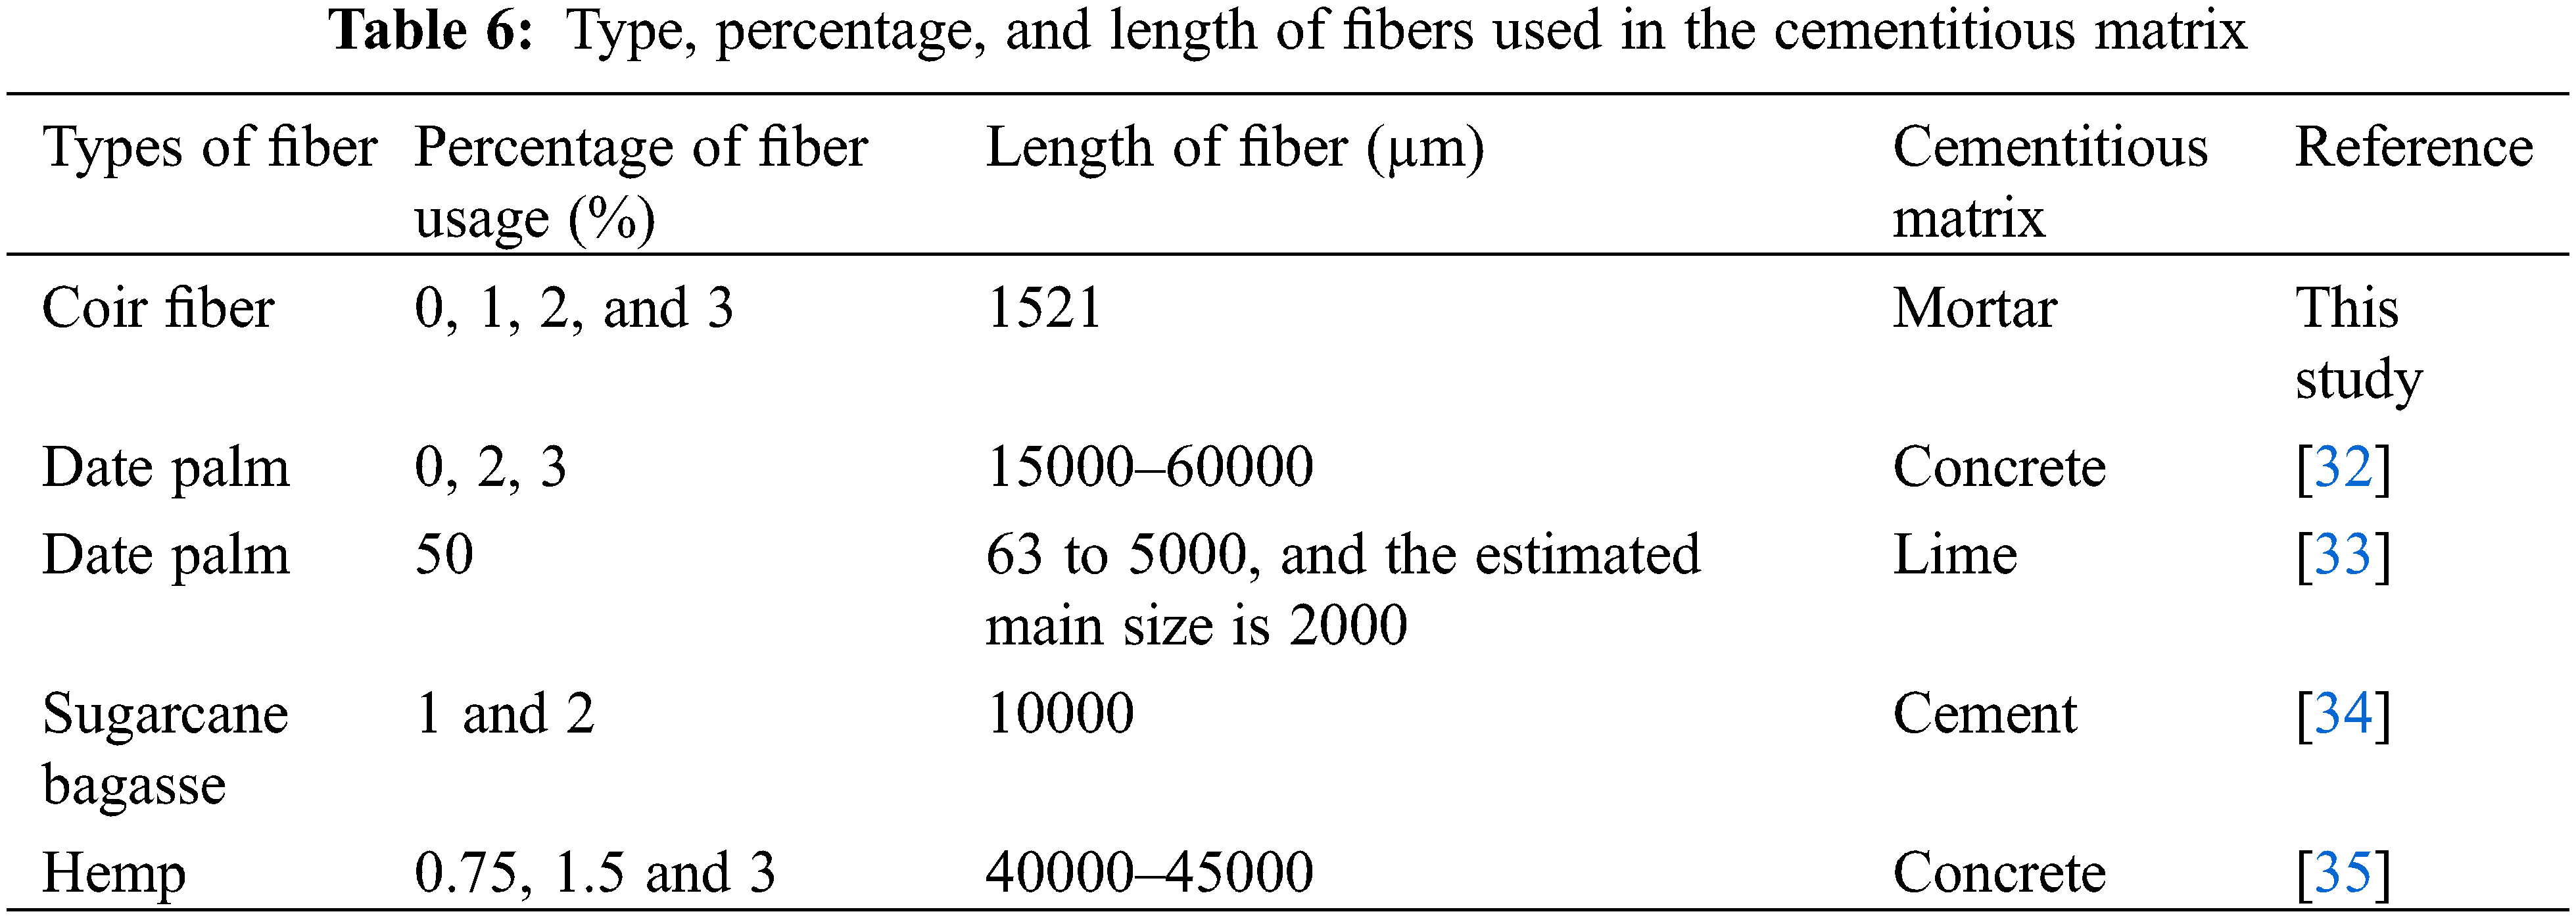
Fig. 4 shows SEM micrographs of the WGs and CF-based matrix. No special features, such as micro-cracks, and micro-voids, were observed on the surface of the samples. The images show more fiber pullout, disentanglements, and larger voids. The fiber pullout is caused by debonding during testing [36]. The void formation of the fiber was pulled out entirely during testing, indicating that the fiber was insufficient to resist crack growth. The resulting voids can act as nucleation sites for crack growth.
Figure 4: SEM micrographs of WGs and CF-based matrix
Fig. 5 shows the functional group analysis of the WGs and CF-based mortars. Observations were made at the wavelength numbers of 700–1200 cm−1, as these wavelengths are associated with Si–O. The peak at 500–1100 cm−1 also indicates the Si–O bond [37–39]. This is attributed to the form in which silica is present in specimens. This study’s Si–O peak was due to hydrated cement. The Si–O asymmetric stretching vibration occurred at the 800–100 cm−1 peak, indicating the silicate units (SiO4) [40]. This bond was formed during the dissolution of SiO2 contributed by the raw material (cement and WGs) [41,42]. Other peaks investigated were at 800 and 1400 cm−1. In this phase, there was a higher increase in sulfate due to the ettringite formation through gypsum reaction with tricalcium aluminates in cement [37]. The increase was observed in samples with WGs addition above 10%. Meanwhile, the role of CF was not clearly confirmed in this FTIR analysis.
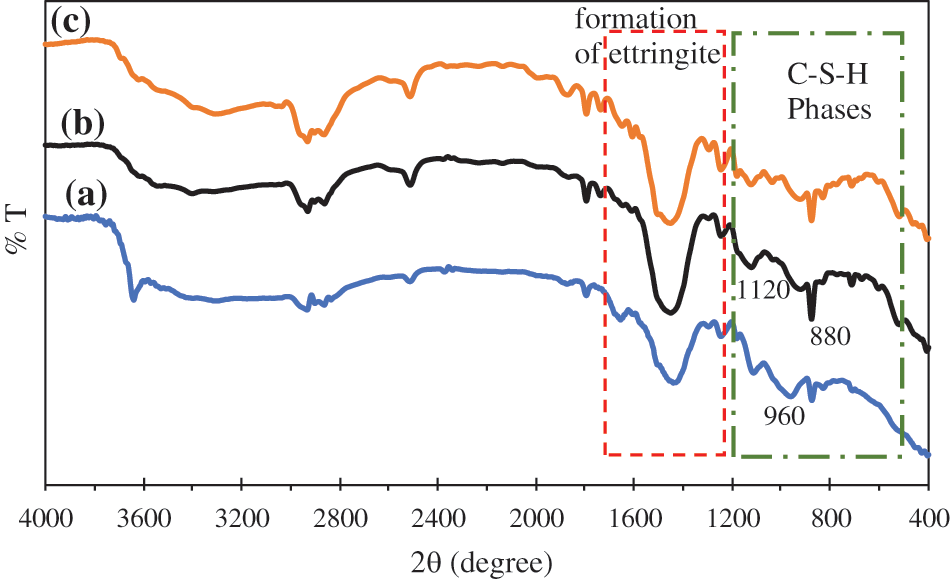
Figure 5: FTIR spectra for WGs and CF-based mortars, (a) WGs 5% + CF 3%, (b) WGs 10% + CF 2%, (c) WGs 15% + CF 1%
Fig. 6 shows the XRD patterns of the WGs and CF based mortars. Calcium Silicates Hydrates (C–S–H) is the major hydration product of Portland Cement. C–S–H peaks at 30° to 45° were selected for analysis. C–S–H peaks were seen at 10% to 15% WGs addition and 1% and 2% CF addition. The C–S–H peak was less visible at 5% WGs addition and 3% CF. It indicates that the addition of WGs above 10% and CF below 2% contributed to the enhancement of the C–S–H gel.
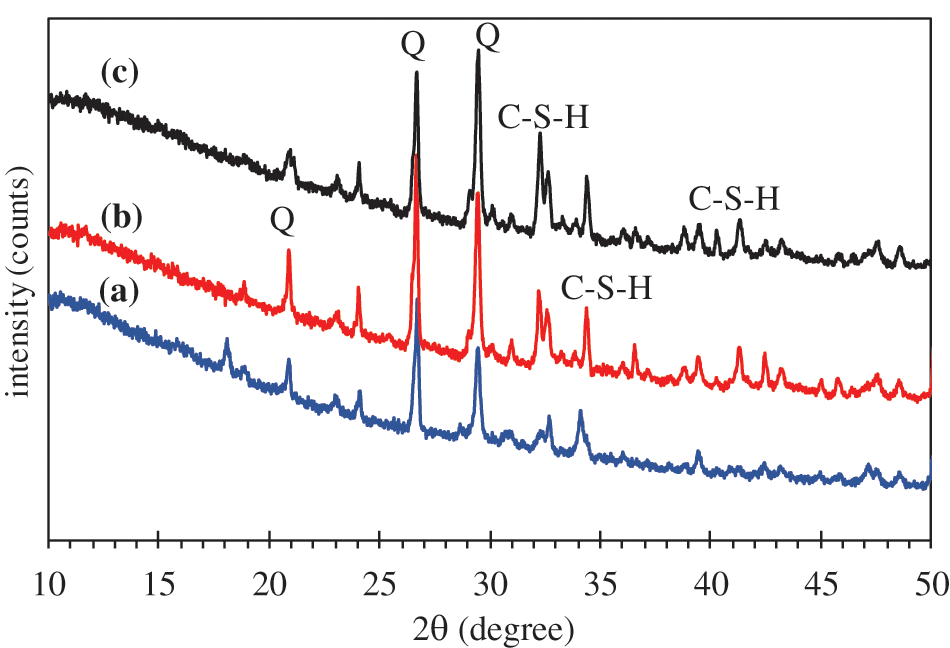
Figure 6: X-ray diffraction pattern of WGs and CF-based mortar, (a) WGs 5% + CF 3%, (b) WGs 10% + CF 2%, (c) WGs 15% + CF 1%
The prominent crystal peak was identified as quartz (SiO2) with high intensity at 2θ = 26.68°. This peak appeared due to the contribution of SiO2 derived from cement and WGs. The crystalline silica increased with the increasing percentage of WGs. The C–S–H amount increased from 10% to 15% of the cement replacement. It was due to the pozzolanic activity of WGs, which utilized the available C–H in the mortar and produced a C–S–H gel. The increase in compressive strength of the mortar confirmed it. Meanwhile, adding 5% WGs did not increase the amount of C–S–H due to insufficient WGs to react with C–H, decreasing the compressive strength. It was confirmed in the statistical model optimization. Adding WGs by 12.776% and CF by 2.344% provided the best compressive strength optimization. Other patterns were not clearly detected in XRD. The number of quartz appearing was more due to the bonding between cement and WGs. From the XRD test, it can be concluded that raw materials affected the formation of C–S–H gel.
3.3 Statistical Model of WGs and CF on the Compressive Strength of Mortar
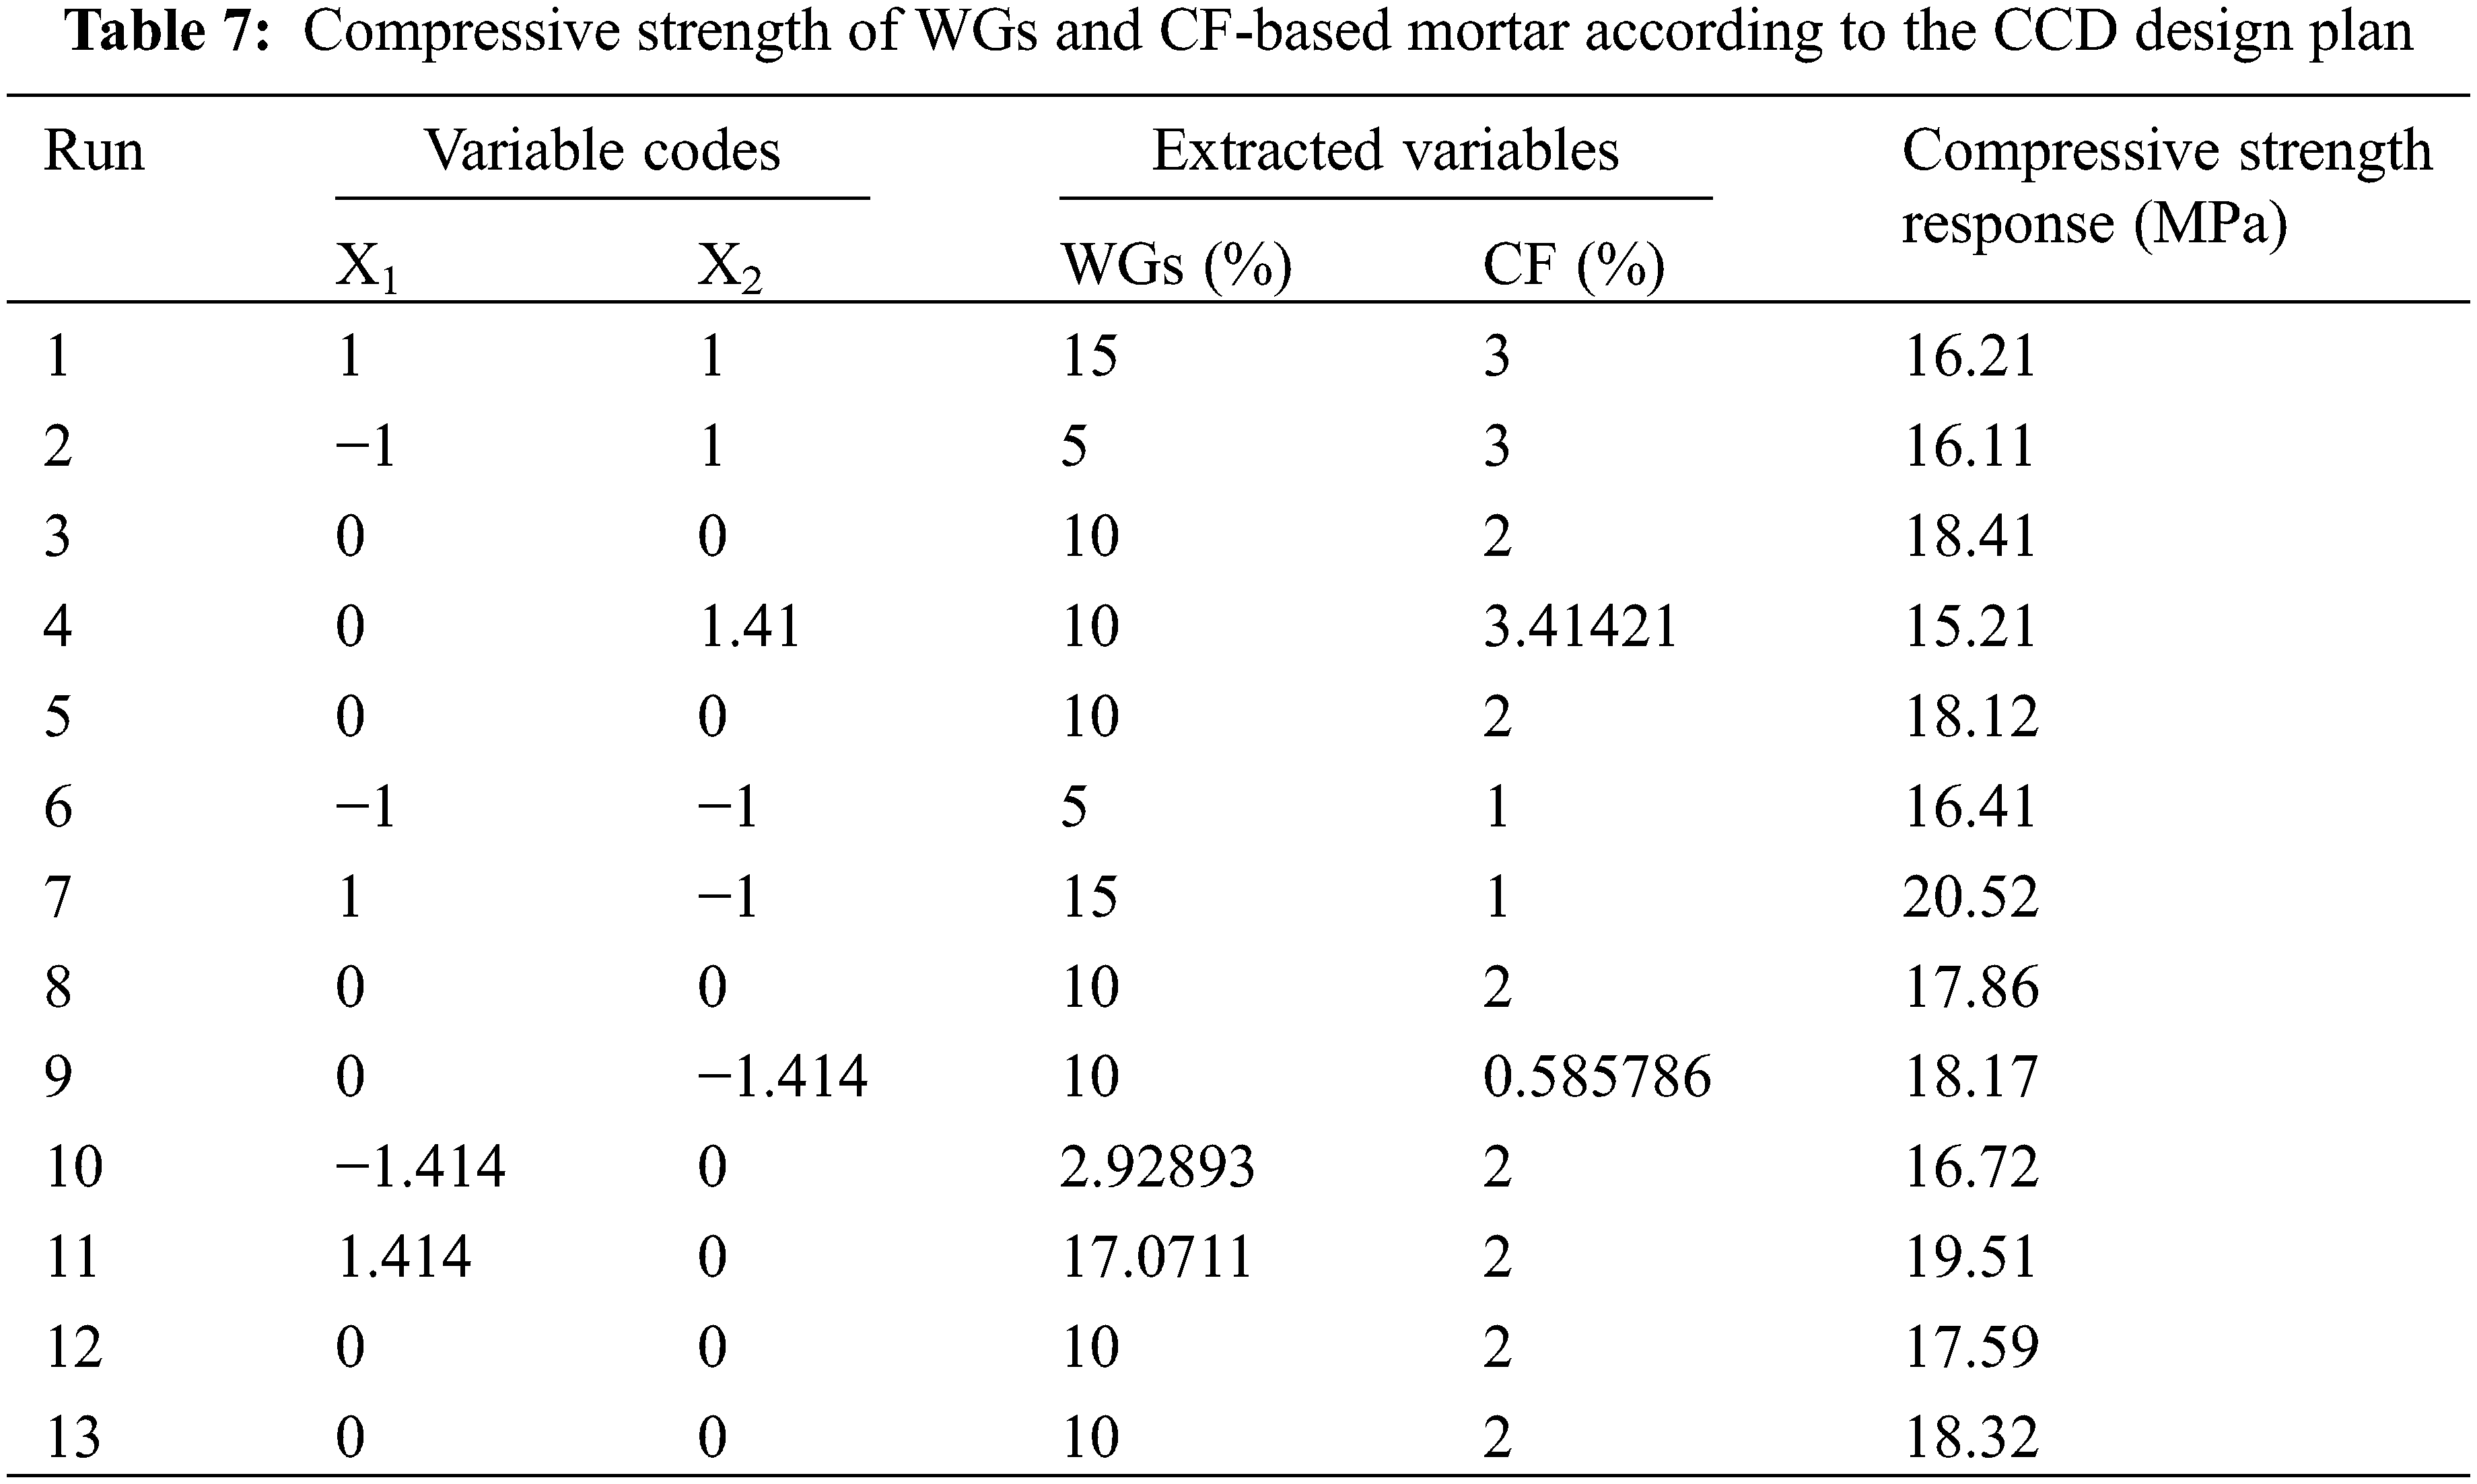
Table 7 shows the compressive strength test results with the variation of WGs and CF concentrations. Five repetitions were carried out at 10% WGs and 2% CF concentrations. Using a mathematical model, the results were then analyzed for compressive strength and model validation.
The statistical summary model suggested by the Design Expert software and the statistical data for model selection is shown in Tables 8 and 9. The model selection is based on the resulting R2.
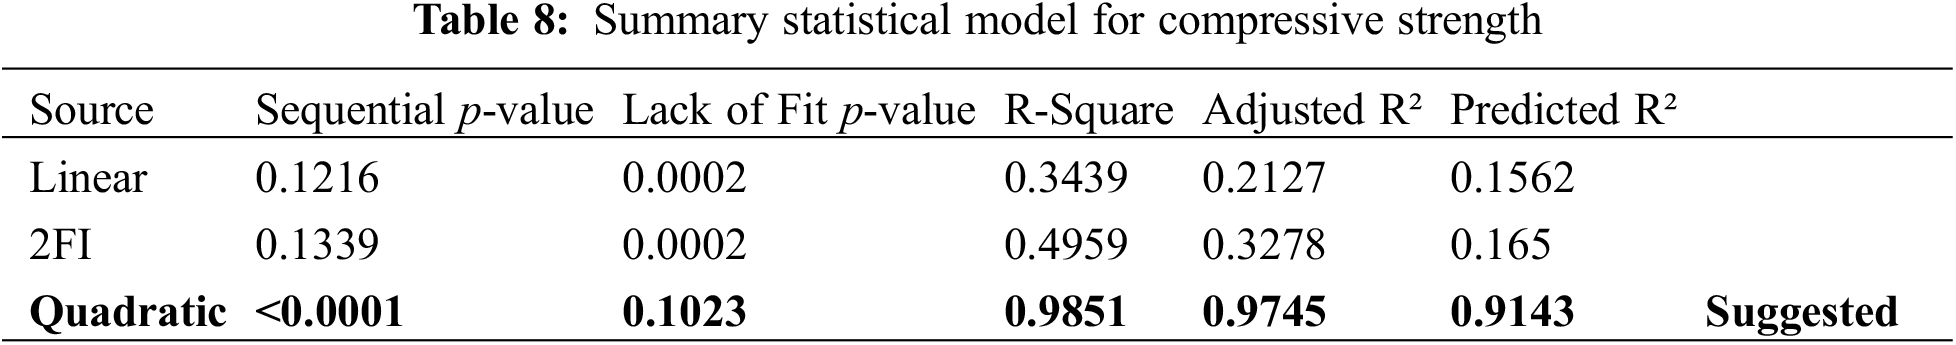
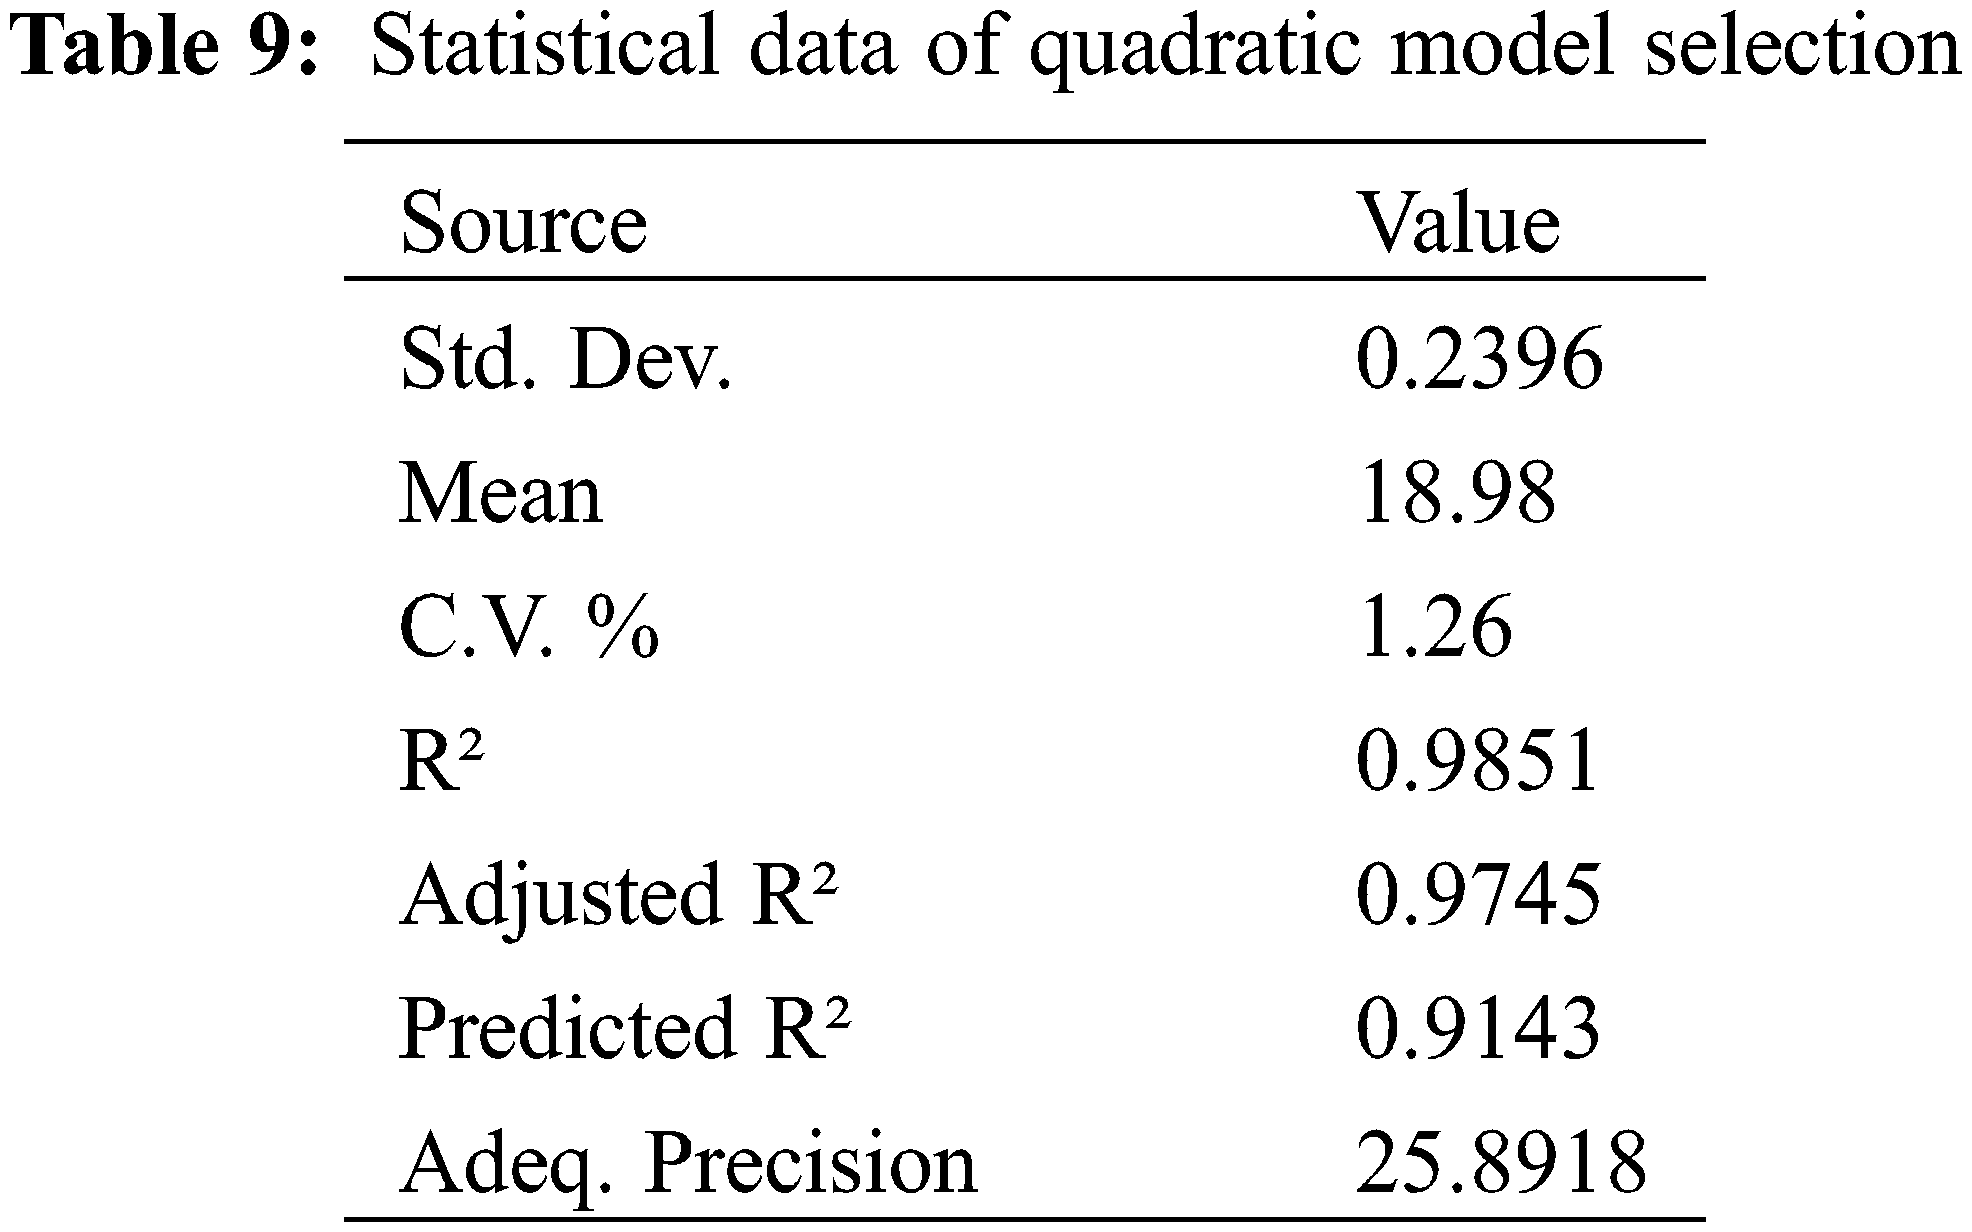
Table 8 indicates that the recommended model is the Quadratic Model, showing an R2 close to 1 (R2 = 0.9851) with Adj-R2 = 0.9745 and predicted-R2 = 0.9143. This model is a good fit because the R2 is close to 1. Hence, the correlation is accurate, with the actual and the prediction values being almost similar. In contrast, the other models have larger deviations.
Table 9 shows that the difference between Adjusted R² and Predicted R² is less than 0.2. The Adeq. Precision measures the accuracy ratio of the prediction results to noise, with the desired ratio being greater than 4. The ratio obtained in this study of 25.8918 indicates an adequate signal. This model can predict the compressive strength of WGs and CF-based mortar. The actual mathematical model obtained for predicting compressive strength values is as follows:
where Y is compressive strength (MPa), X1 is WGs concentration (%), dan X2 is CF concentration (%). The mathematical model above explains the effect of each variable, WGs and CF, either linearly or quadratic, and the interaction of the two variables.
The normal distribution of the residuals plot was assessed with the help of a graphical method referred to as the normal probability plot, as shown in Fig. 7.
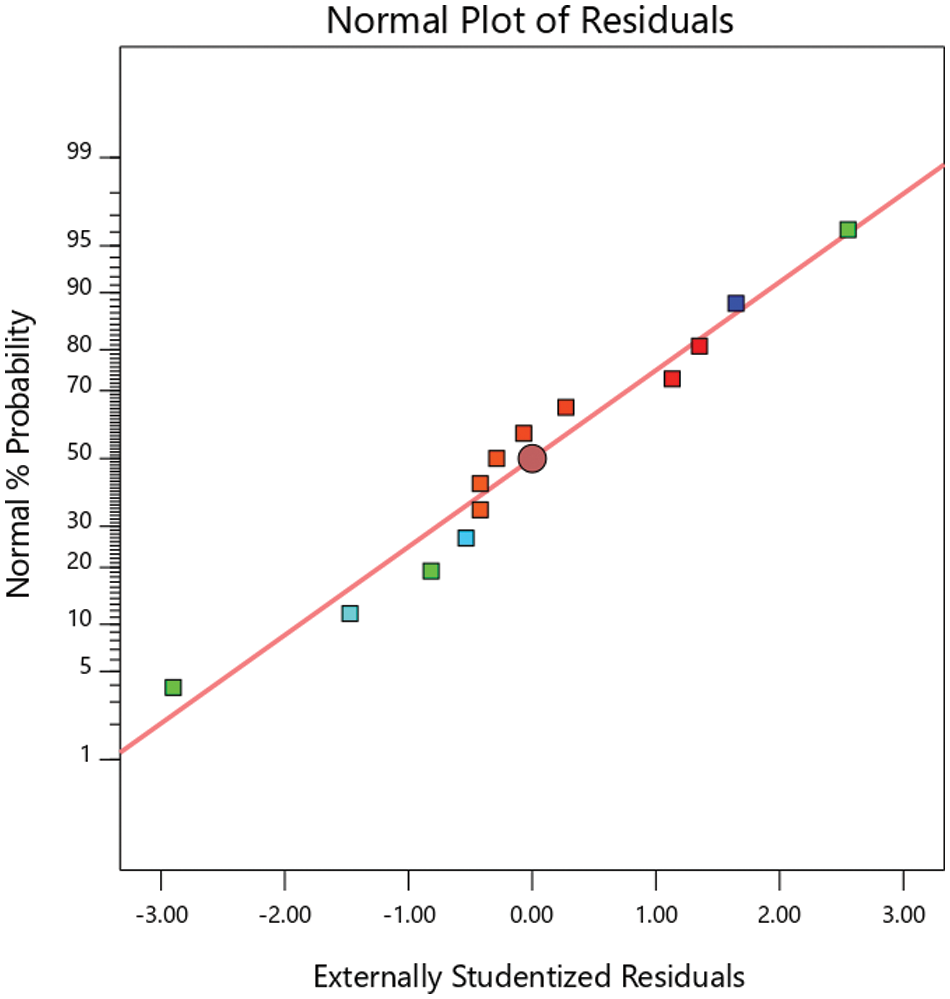
Figure 7: The normal plot of residual values for response surface of compressive strength
Fig. 8 shows that the data points are close to a straight line, and the plot of data points also shows the same trend of almost forming a 45-degree straight line, so the predicted values followed the actual values. The compressive strength test results are plotted in 3D, as shown in Figs. 8a and 8b. The graphs indicate that the percentage WGs and CF addition increased the compressive strength, but the decrease also occurred due to the composites effect.
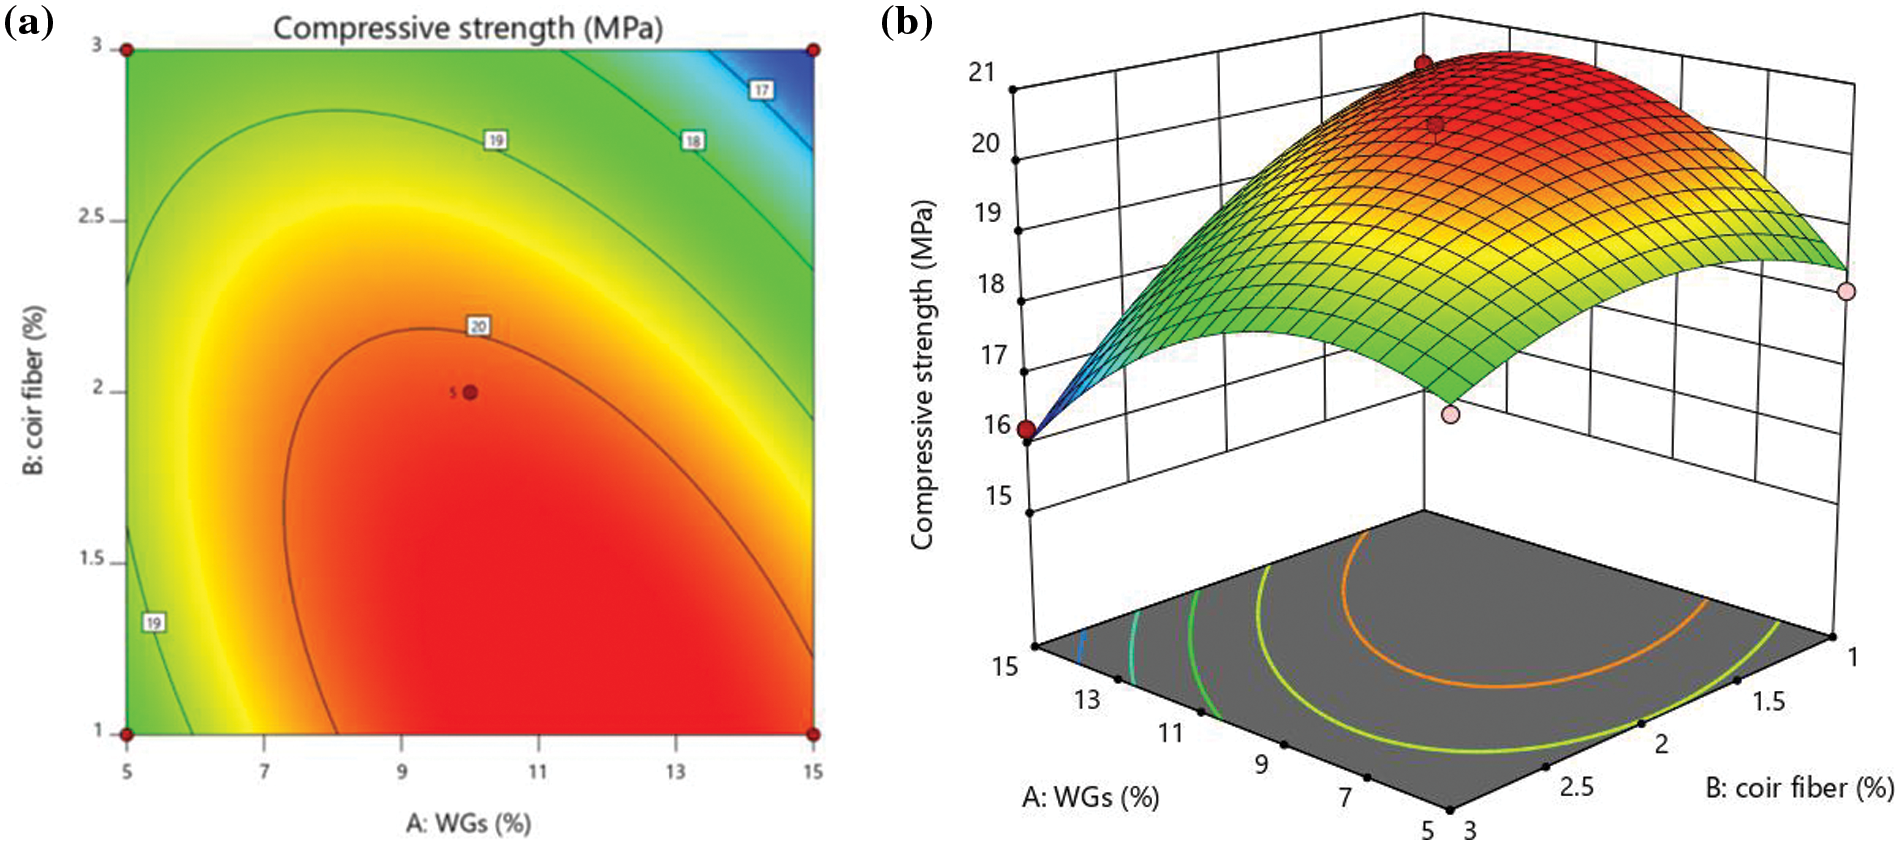
Figure 8: The effect of WGs and CF concentration on compressive strength, (a) Contour diagram view, (b) 3D view of response surface
A numerical ramp was performed to assess the optimum compressive strength of WGs and CF-based mortar, as shown in Fig. 9. It reveals that WGs and CF influenced the increase of compressive strength.
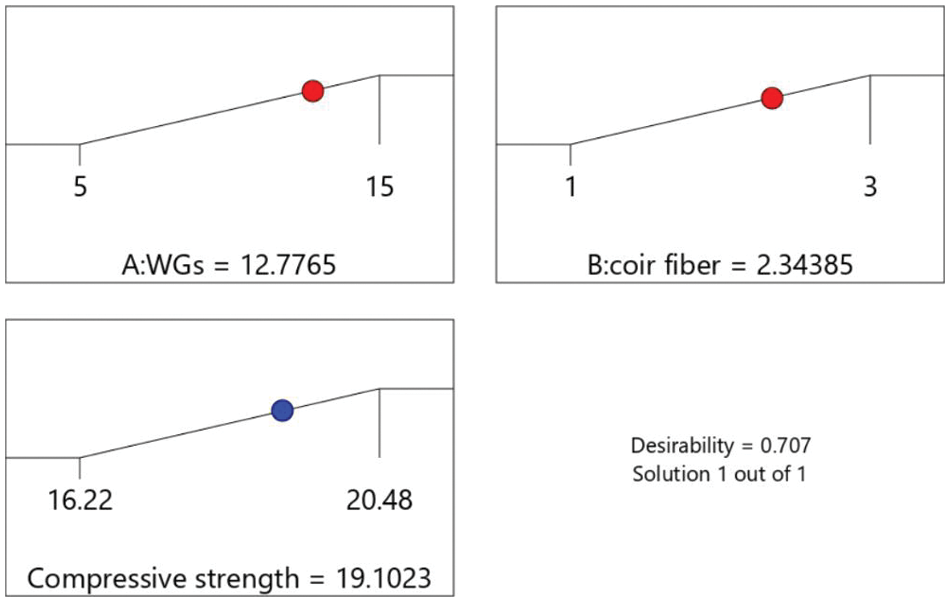
Figure 9: Optimization results of WGs and CF-based mortars according to numerical ramp graphs
Fig. 10 shows that the optimum compressive strength of 19.1023 MPa was obtained by adding 12.776% WGs and 2.344% CF concentrations. The effect of WGs and CF on compressive strength can be seen in the perturbation curve plot shown in Fig. 7. The steep gradient was given by the factors, A (WGs) and B (CF), indicating the sensitivity of these two factors. The gradient of factor A (WGs) shows an increase, in contrast to factor B (CF). This graph indicates that adding WGs increased the compressive strength at a certain point, and if composited with CF, the optimum value will occur at a certain point. The optimum compressive strength value of mortar will occur at low CF concentration.
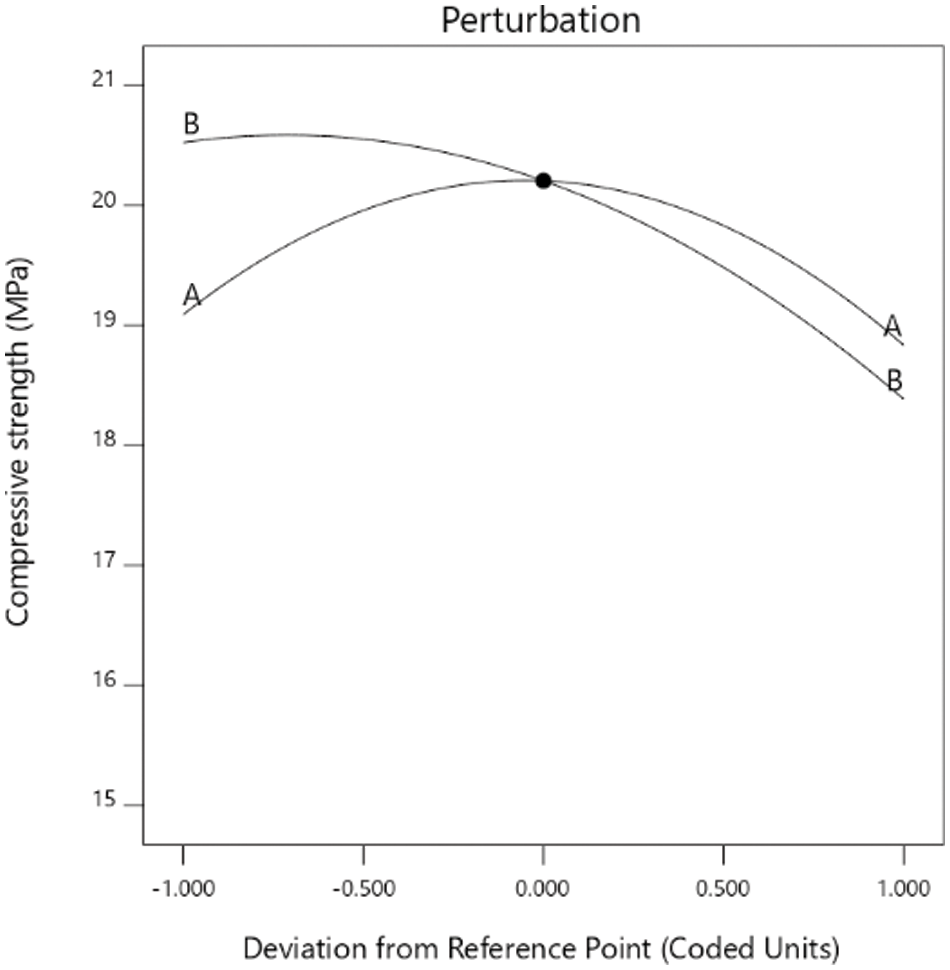
Figure 10: Perturbation curve for compressive strength of WGs and CF-based mortar
The statistical model showed that the optimum compressive strength was for the addition of 12.776% WGs and 2.344% CF. The addition of excess WGs and CF will reduce the compressive strength. Raw characteristics influence the increase and decrease in the compressive strength of mortar. Fiber with characteristics, cellulose content of 49.15% (see Table 5), and length of 1521 µm (see Table 6) contributes to the increase in compressive strength. The decrease in compressive strength is due to the presence of 18.84% hemicellulose, adversely affecting the bonding matrix with fibers. This was also confirmed in the SEM image (see Fig. 3), where the fiber has undergone surface modification through a chemical treatment to easily make the fiber bond with the matrix.
Adding CF increases the compressive strength of the mortar, resulting the mortar resisting crack propagation. However, adding a percentage above it causes the fibers to agglomerate and decreases compressive strength. The addition of WGs in the matrix is needed as its silica content makes the matrix denser, but adding a higher percentage of WGs disrupts the hydration process of the cement and reduces the compressive strength. The combination of WGs and CF of 12.776% and 2.344% is essential as a mortar constituent since the silica content can play a role in the hydration process, and CF can act as reinforcement in mortar.
3.3.2 Model Validation Using ANOVA
Based on the CCD, the ANOVA (analysis of variance) calculation shows the linear and quadratic individual effects of WGs and CF and the interactions between those variables. Table 10 shows the ANOVA results for the effect of WGs (%) and CF (%) on the compressive strength of mortar.
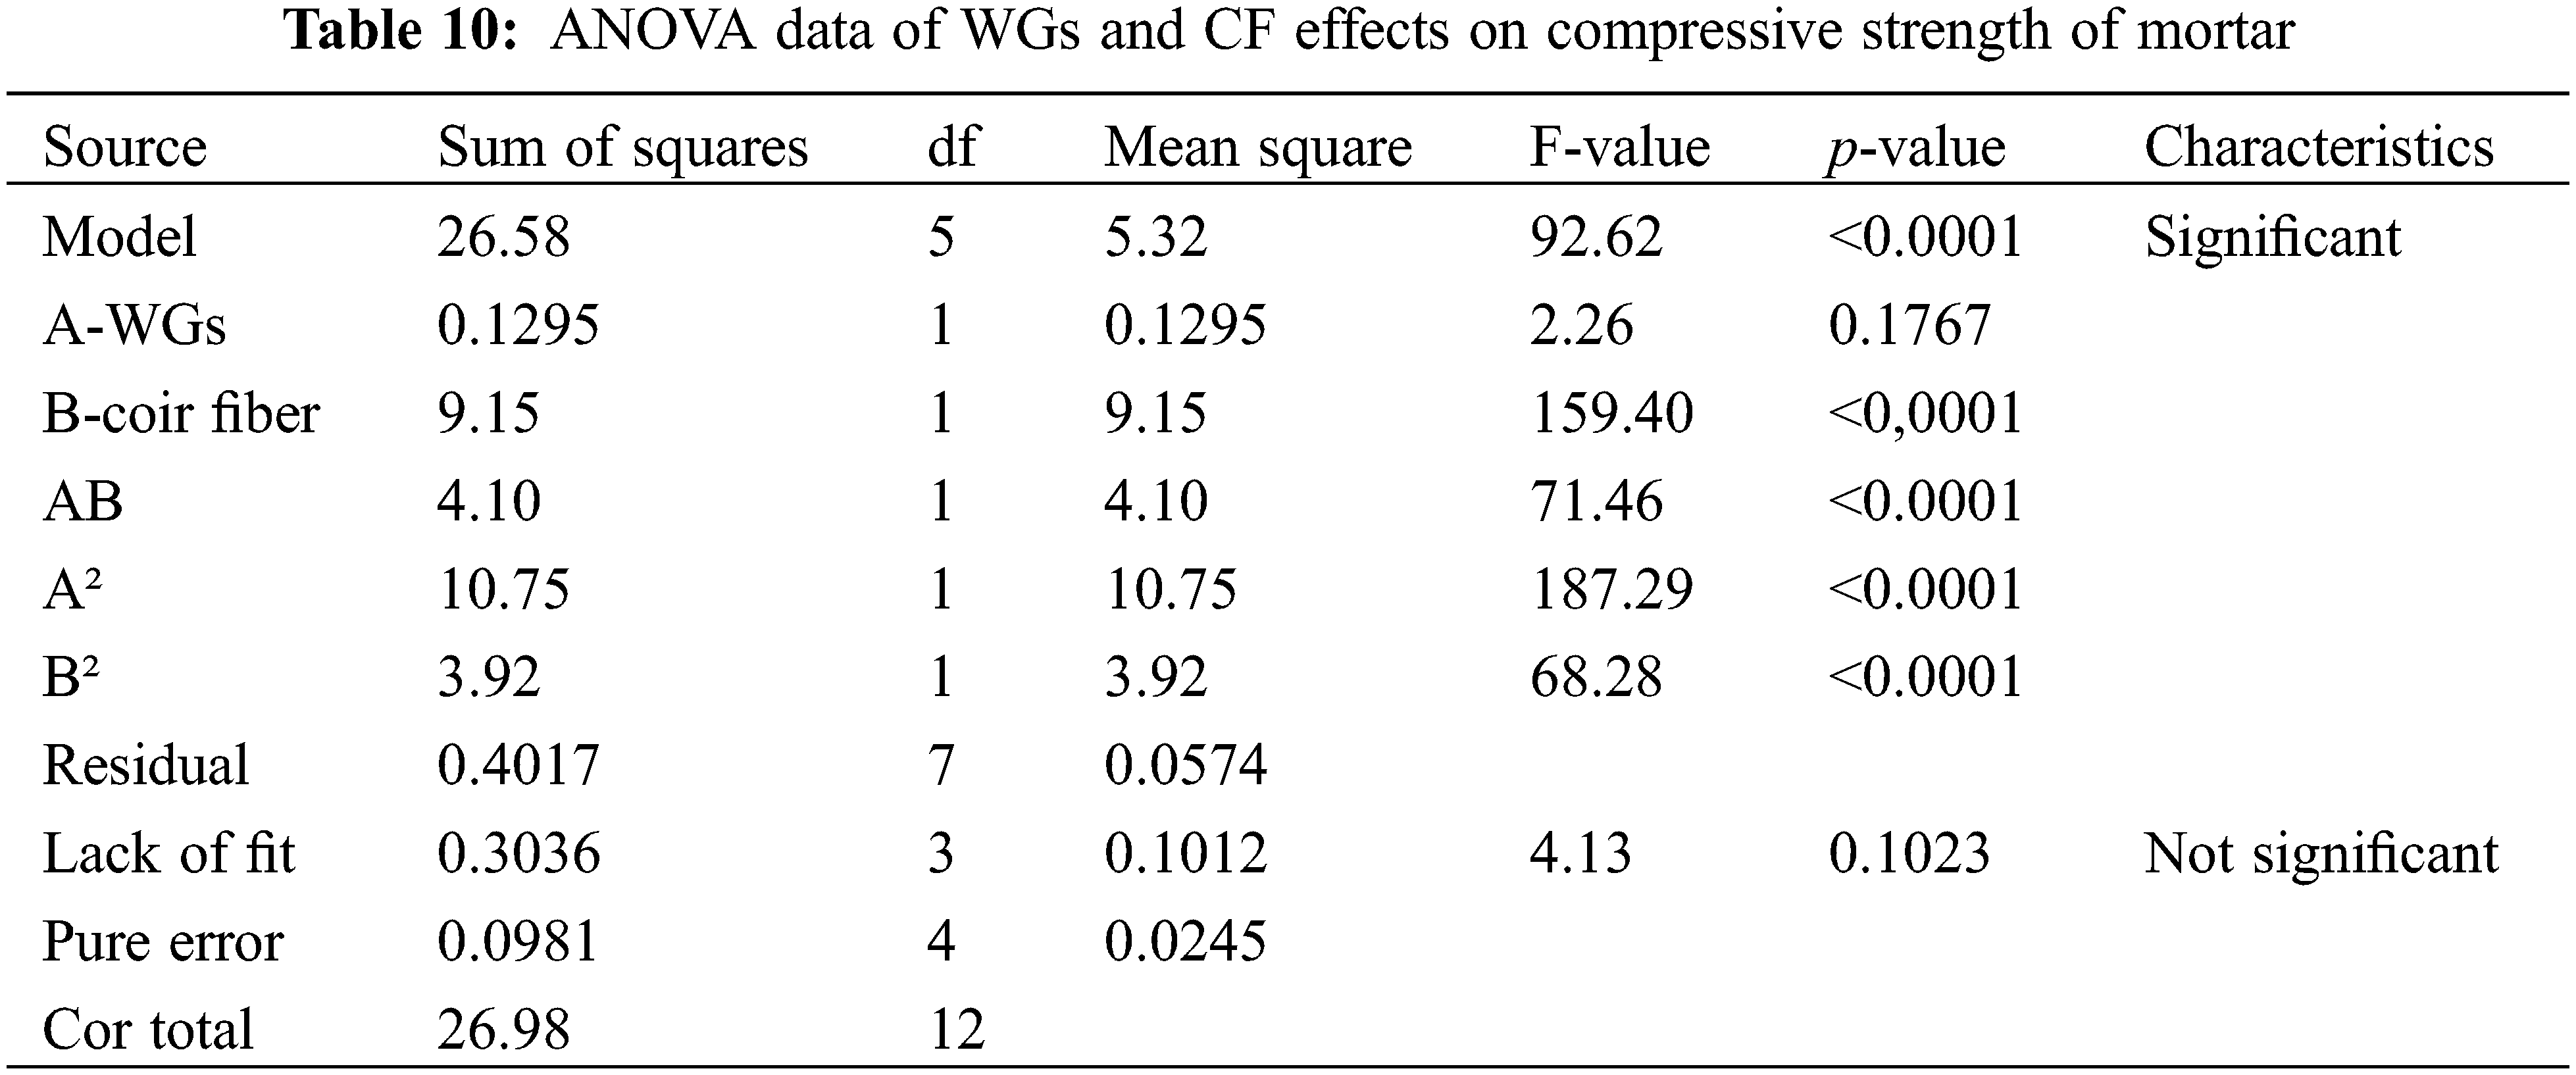
The validation results show that the model for the compressive strength response of mortar is appropriate and applicable. The F and p-values confirmed the significance of the model. The lack of fit test was not significant (p = 0.1023), meaning the model is appropriate and can be used. The statistical analysis reveals an interaction between WGs and CF on compressive strength. WGs seems to work better in the composite than CF. Not all OH– bonds in CF can bind due to agglomeration, so CF is less reacted in the matrix.
This study used WGs as a partial replacement for sand and CF as an additional reinforcing agent in mortar mix. To obtain the optimal mix proportions of the constituent materials and build a mathematical model, RSM has been used to predict the mortar compressive strength. The proposed mathematical model was found significant using the p-value approach and could predict the compressive strength of mortar. The interaction of WGs dan CF with the compressive strength has been efficiently observed with the 3D surface diagrams. Similarly, the ranges of WGs and CF can be efficiently predicted from the intervals of compressive strength. The RSM-ANOVA model of compressive strength has been developed and statistically validated. Therefore, RSM can be used to predict the compressive strength of mortar mixes using WGs and CF. The RSM optimization technique can reduce design time and improve product quality based on WGs and CF.
WGs and CF-based mortar microstructure show that silica from WGs enhanced the C–S–H phase, and CF worked as bridging in resisting crack growth. The combination of WGs and CF is important as mortar constituents because it contains the required amount of silica in the hydration of cement and as reinforcement in mortar. Based on this study, compositing WGs and CF in mortar can be beneficial to develop construction materials and saving the environment through effective non-biodegradable waste management.
Funding Statement: This research was funded by the Ministry of Education, Culture, Research, and the Technology, Indonesia for Matching Fund (Kedaireka) Scheme in 2022 with Contract No. 155/E1/KS.06.02/2022.
Conflicts of Interest: The authors declare that they have no conflicts of interest to report regarding the present study.
References
1. Paul, D., Bindhu, K. R., Matos, A. M., Delgado, J. (2022). Eco-friendly concrete with waste glass powder: A sustainable and circular solution. Construction and Building Materials, 355, 129217. https://doi.org/10.1016/j.conbuildmat.2022.129217 [Google Scholar] [CrossRef]
2. Ravinder, K. (2016). Strength characteristics of coca-cola tin waste as fibres in concrete. Materials Science, Engineering, 3, 9–12. [Google Scholar]
3. Ahmed, T., Ray, S., Haque, M., Nahin, T. T., Mita, A. F. (2022). Optimization of properties of concrete prepared with waste glass aggregate and condensed milk can fiber using response surface methodology. Cleaner Engineering and Technology, 8(1), 100478. https://doi.org/10.1016/j.clet.2022.100478 [Google Scholar] [CrossRef]
4. Handayani, L., Aprilia, S., Abdullah, A., Rahmawati, C. (2020). Synthesis of sodium silicate from rice husk ash as an activator to produce epoxy-geopolymer cements. Journal of Physics: Conference Series, 1845, 012072. https://doi.org/10.1088/1742-6596/1845/1/012072 [Google Scholar] [CrossRef]
5. Handayani, L., Aprilia, S., Abdullah, A., Rahmawati, C., Aulia, T. B. et al. (2022). Sodium silicate from rice husk ash and their effects as geopolymer cement. Polymers, 14(14), 1–14. https://doi.org/10.3390/polym14142920 [Google Scholar] [PubMed] [CrossRef]
6. Ahmad, J., Majdi, A., Deifalla, A. F., Isleem, H. F., Rahmawati, C. (2022). Concrete made with partially substitutions of copper slag (CPSState of the art review. Materials, 15(15), 1–28. https://doi.org/10.3390/ma15155196 [Google Scholar] [PubMed] [CrossRef]
7. de Castro, S., de Brito, J. (2013). Evaluation of the durability of concrete made with crushed glass aggregates. Journal of Cleaner Production, 41(3), 7–14. https://doi.org/10.1016/j.jclepro.2012.09.021 [Google Scholar] [CrossRef]
8. Jani, Y., Hogland, W. (2014). Waste glass in the production of cement and concrete–A review. Journal of Environmental Chemical Engineering, 2(3), 1767–1775. https://doi.org/10.1016/j.jece.2014.03.016 [Google Scholar] [CrossRef]
9. Degirmenci, N., Yilmaz, A., Cakir, O. A. (2011). Utilization of waste glass as sand replacement in cement mortar. Indian Journal of Engineering & Materials Sciences, 18, 303–308. [Google Scholar]
10. Ali, E. E., Al-Tersawy, S. H. (2012). Recycled glass as a partial replacement for fine aggregate in self compacting concrete. Construction and Building Materials, 35(7), 785–791. https://doi.org/10.1016/j.conbuildmat.2012.04.117 [Google Scholar] [CrossRef]
11. Foti, D. (2011). Preliminary analysis of concrete reinforced with waste bottles PET fibers. Construction and Building Materials, 25(4), 1906–1915. https://doi.org/10.1016/j.conbuildmat.2010.11.066 [Google Scholar] [CrossRef]
12. Afshinnia, K., Rangaraju, P. R. (2015). Influence of fineness of ground recycled glass on mitigation of alkali-silica reaction in mortars. Construction and Building Materials, 81(7), 257–267. https://doi.org/10.1016/j.conbuildmat.2015.02.041 [Google Scholar] [CrossRef]
13. Rahmawati, C., Aprilia, S., Saidi, T., Aulia, T. B., Amin, A. et al. (2022). Mechanical properties and fracture parameters of geopolymers based on cellulose nanocrystals from Typha sp. fibers. Case Studies in Construction Materials, e01498. https://doi.org/10.1016/j.cscm.2022.e01498 [Google Scholar] [CrossRef]
14. Foti, D. (2013). Use of recycled waste pet bottles fibers for the reinforcement of concrete. Composite Structures, 96(12), 396–404. https://doi.org/10.1016/j.compstruct.2012.09.019 [Google Scholar] [CrossRef]
15. Haque, M., Ray, S., Mita, A. F., Bhattacharjee, S., Bin Shams, M. J. (2021). Prediction and optimization of the fresh and hardened properties of concrete containing rice husk ash and glass fiber using response surface methodology. Case Studies in Construction Materials, 14, e00505. https://doi.org/10.1016/j.cscm.2021.e00505 [Google Scholar] [CrossRef]
16. Ray, S., Haque, M., Rahman, M. M., Sakib, M. N., Al Rakib, K. (2021). Experimental investigation and SVM-based prediction of compressive and splitting tensile strength of ceramic waste aggregate concrete. Journal of King Saud University-Engineering Sciences. https://doi.org/10.1016/j.jksues.2021.08.010 [Google Scholar] [CrossRef]
17. Syed, H., Nerella, R., Madduru, S. R. C. (2020). Role of coconut coir fiber in concrete. Materials Today: Proceedings, 1104–1110. https://doi.org/10.1016/j.matpr.2020.01.477 [Google Scholar] [CrossRef]
18. Eriksson, L., Johansson, E., Wikström, C. (1998). Mixture design—Design generation, PLS analysis, and model usage. Chemometrics and Intelligent Laboratory Systems, 43(1), 1–24. https://doi.org/10.1016/S0169-7439(98)00126-9 [Google Scholar] [CrossRef]
19. Upasani, R. S., Banga, A. K. (2004). Response surface methodology to investigate the iontophoretic delivery of tacrine hydrochloride. Pharmaceutical Research, 21(12), 2293–2299. https://doi.org/10.1007/s11095-004-7682-6 [Google Scholar] [PubMed] [CrossRef]
20. Thakur, M., Sharma, A., Ahlawat, V., Bhattacharya, M., Goswami, S. (2020). Process optimization for the production of cellulose nanocrystals from rice straw derived α-cellulose. Materials Science for Energy Technologies, 3(3), 328–334. https://doi.org/10.1016/j.mset.2019.12.005 [Google Scholar] [CrossRef]
21. Zahid, M., Shafiq, N., Isa, M. H., Gil, L. (2018). Statistical modeling and mix design optimization of fly ash based engineered geopolymer composite using response surface methodology. Journal of Cleaner Production, 194, 483–498. https://doi.org/10.1016/j.jclepro.2018.05.158 [Google Scholar] [CrossRef]
22. Pham, T. D., Bui, T. T., Trang Truong, T. T., Hoang, T. H., Le, T. S. et al. (2020). Adsorption characteristics of beta-lactam cefixime onto nanosilica fabricated from rice HUSK with surface modification by polyelectrolyte. Journal of Molecular Liquids, 298, 111981. https://doi.org/10.1016/j.molliq.2019.111981 [Google Scholar] [CrossRef]
23. Oyebisi, S., Owamah, H., Ede, A. (2021). Flexural optimization of slag-based geopolymer concrete beams modified with corn cob ash. Sharif University of Technology. [Google Scholar]
24. Aldahdooh, M. A. A., Bunnori, N. M., Johari, M. A. M. (2013). Evaluation of ultra-high-performance-fiber reinforced concrete binder content using the response surface method. Materials & Design, 53(6), 957–965. https://doi.org/10.1016/j.matdes.2013.06.034 [Google Scholar] [CrossRef]
25. Mohammed, B. S., Achara, B. E., Nuruddin, M. F., Yaw, M., Zulkefli, M. Z. (2017). Properties of nano-silica-modified self-compacting engineered cementitious composites. Journal of Cleaner Production, 162, 1225–1238. https://doi.org/10.1016/j.jclepro.2017.06.137 [Google Scholar] [CrossRef]
26. Datta, R. (1981). Acidogenic fermentation of lignocellulose-acid yield and conversion of components. Biotechnology and Bioengineering, 23, 2167–2170. https://doi.org/10.1002/(ISSN)1097-0290 [Google Scholar] [CrossRef]
27. Seta, F. T., An, X., Liu, L., Zhang, H., Yang, J. et al. (2020). Preparation and characterization of high yield cellulose nanocrystals (CNC) derived from ball mill pretreatment and maleic acid hydrolysis. Carbohydrate Polymers, 234(70), 115942. https://doi.org/10.1016/j.carbpol.2020.115942 [Google Scholar] [PubMed] [CrossRef]
28. ASTM C 109 (2001). Standart test method for compressive strength of hydrulic 557 cement mortar (using 2-in or 50 mm cube specimens. In: Annual book of 558 ASTM standars. [Google Scholar]
29. Ghafari, E., Costa, H., Júlio, E. (2014). RSM-based model to predict the performance of self-compacting UHPC reinforced with hybrid steel micro-fibers. Construction and Building Materials, 66(6), 375–383. https://doi.org/10.1016/j.conbuildmat.2014.05.064 [Google Scholar] [CrossRef]
30. Ahmad, J., Arbili, M. M., Majdi, A., Althoey, F., Deifalla, A. F. et al. (2022). Performance of concrete reinforced with jute fibers (natural fibersA review. Journal of Engineered Fibers and Fabrics, 17(1), 1–17. https://doi.org/10.1177/15589250221121871 [Google Scholar] [CrossRef]
31. Rahmawati, C., Aprilia, S., Saidi, T., Aulia, T. B., Ahmad, I. (2021). Preparation and characterization of cellulose nanocrystals from typha sp. as a reinforcing agent. Journal of Natural Fibers, 18(13), 1–14. https://doi.org/10.1080/15440478.2021.1904486 [Google Scholar] [CrossRef]
32. Kriker, A., Debicki, G., Bali, A., Khenfer, M. M., Chabannet, M. (2005). Mechanical properties of date palm fibres and concrete reinforced with date palm fibres in hot-dry climate. Cement and Concrete Composites, 27(5), 554–564. https://doi.org/10.1016/j.cemconcomp.2004.09.015 [Google Scholar] [CrossRef]
33. Belakroum, R., Gherfi, A., Kadja, M., Maalouf, C., Lachi, M. et al. (2018). Design and properties of a new sustainable construction material based on date palm fibers and lime. Construction and Building Materials, 184(10), 330–343. https://doi.org/10.1016/j.conbuildmat.2018.06.196 [Google Scholar] [CrossRef]
34. Colorado, H. A., Zapata, J. F. (2019). Composites of Portland cement paste and sugarcane bagasse fibers: Structure-property relation and Weibull statistics. Journal of Materials and Environmental Sciences, 10(11), 1162–1171. [Google Scholar]
35. Gencel, O., Bayraktar, O. Y., Kaplan, G., Benli, A., Martínez-Barrera, G. et al. (2021). Characteristics of hemp fibre reinforced foam concretes with fly ash and Taguchi optimization. Construction and Building Materials, 294(1), 123607. https://doi.org/10.1016/j.conbuildmat.2021.123607 [Google Scholar] [CrossRef]
36. Huang, J. K., Huang, J. K. (2019). The mechanical, hygral, and interfacial strength of continuous bamboo fiber reinforced epoxy composites. Composites Part B: Engineering, 166(2), 272–283. https://doi.org/10.1016/j.compositesb.2018.12.013 [Google Scholar] [CrossRef]
37. Ylmén, R., Jäglid, U., Steenari, B. M., Panas, I. (2009). Early hydration and setting of Portland cement monitored by IR, SEM and Vicat techniques. Cement and Concrete Research, 39(5), 433–439. https://doi.org/10.1016/j.cemconres.2009.01.017 [Google Scholar] [CrossRef]
38. Mollah, M. Y. A., Yu, W., Schennach, R., Cocke, D. L. (2000). A Fourier transform infrared spectroscopic investigation of the early hydration of Portland cement and the influence of sodium lignosulfonate. Cement and Concrete Research, 30(2), 267–273. https://doi.org/10.1016/S0008-8846(99)00243-4 [Google Scholar] [CrossRef]
39. Wongsa, A., Boonserm, K., Waisurasingha, C., Sata, V., Chindaprasirt, P. (2017). Use of municipal solid waste incinerator (MSWI) bottom ash in high calcium fly ash geopolymer matrix. Journal of Cleaner Production, 148, 49–59. https://doi.org/10.1016/j.jclepro.2017.01.147 [Google Scholar] [CrossRef]
40. Jose, A., Nivitha, M. R., Krishnan, J. M., Robinson, R. G. (2020). Characterization of cement stabilized pond ash using FTIR spectroscopy. Construction and Building Materials, 263(6), 1–13. https://doi.org/10.1016/j.conbuildmat.2020.120136 [Google Scholar] [CrossRef]
41. Zhang, Y., Wei, S., Chen, Q., Lin, C. (2007). Synthesis and heavy metal immobilization behaviors of slag based geopolymer. Journal of Hazardous Materials, 143(1–2), 206–213. https://doi.org/10.1016/j.jhazmat.2006.09.033 [Google Scholar] [PubMed] [CrossRef]
42. Fernández-Jiménez, A., Puertas, F. (2003). Effect of activator mix on the hydration and strength behaviour of alkali-activated slag cements. Advances in Cement Research, 15(3), 129–136. https://doi.org/10.1680/adcr.2003.15.3.129 [Google Scholar] [CrossRef]
Cite This Article
 Copyright © 2023 The Author(s). Published by Tech Science Press.
This work is licensed under a Creative Commons Attribution 4.0 International License , which permits unrestricted use, distribution, and reproduction in any medium, provided the original work is properly cited.
 Downloads
 Citation Tools