
 Submit a Paper
 Propose a Special lssue
 Open Access
ARTICLE
Rapid Analysis of Four Alkaloids in Uncaria rhynchophylla by Core-Shell Column HPLC and Quantitative Analysis of Multi-Components by Single Marker (QAMS)
1 KMHD (Kangmeihuada Gene Technology Co., Ltd.), Shenzhen, 518128, China
2 Guangdong Province Enterprise Key Laboratory of Traditional Chinese Medicine Decoction Pieces, Kangmei Pharmaceutical Co., Ltd., Jieyang, 515300, China
* Corresponding Author: Ning Li. Email:
(This article belongs to the Special Issue: Therapeutic Efficiency of Phyto-Molecules)
Phyton-International Journal of Experimental Botany 2023, 92(1), 285-296. https://doi.org/10.32604/phyton.2022.023219
Received 15 April 2022; Accepted 20 May 2022; Issue published 06 September 2022
 View Full Text
 Download PDF
Abstract
As a traditional herbal medicine, the major alkaloids in Uncaria rhynchophylla have been proven to have blood pressure-lowering and sedative effects. It is essential to develop an effective method for the determination of the major alkaloids in U. rhynchophylla. In this research, a rapid quantitative analysis involving multi-components analysis by a single marker strategy coupled with core-shell column HPLC was adopted to analyse four alkaloids (corynoxeine, isocorynoxeine, isorhynchophylline, rhynchophylline) in U. rhynchophylla. Isorhynchophylline was selected as the internal reference substance, the content of which was determined by the traditional external standard method. Relative correction factors (RCF) between isorhynchophylline and the other three alkaloids were calculated respectively. The results showed that the QAMS method had good robustness under different HPLC instruments. Nineteen batches of U. rhynchophylla were tested. No significant difference was observed between the results by QAMS and EMS (Correlation coefficient > 0.99, p > 0.05). The QAMS method could be employed as a rapid, effective technique for the quality control of U. rhynchophylla.Keywords
Nomenclature
| HPLC: | High performance liquid chromatography |
| QAMS: | Quantitative analysis of multi-components by single marker |
| ESM: | External standard method |
| TCM: | Traditional Chinese Medicine |
As a woody vine or liana in the Rubiaceae family, Uncaria contains 34 species worldwide, which are extensively distributed in subtropics and tropical regions, including Southern China, Southeast Asia and South America, etc. [1]. China has numerous Uncaria species, five species, U. rhynchophylla, U. macrophylla, U. hirsuta, U. sinensis and U. sessilifrudus are listed in “ChP” (Pharmacopoeia of the People’s Republic of China) [2]. In most Chinese areas, the mainstream commodity among Uncaria species is the stem with hook of U. rhynchophylla. U. rhynchophylla mainly contains alkaloids, flavonoids, saponins as well as other components. Among which alkaloids account for the largest proportion and the total amount of rhynchophylline and isorhynchophylline accounts for the 40% or more of alkaloids [3,4]. Monoterpenoid indole alkaloids have been reported to possess various pharmacological activities, such as antihyper-tensive and anti-proliferative effects [5,6]. Therefore, monoterpenoid indole alkaloids such as corynoxeine, isorhynchophylline, isocorynoxeine, and rhynchophylline usually serve as markers for the quality control of U. rhynchophylla [7,8].
In the previous researches, the quantitative analysis of U. rhynchophylla alkaloids was mainly based on the determination of isorhynchophylline and rhynchophylline on HPLC, while simultaneous determination of multiple alkaloids was mainly achieved by UPLC or NMR (1H nuclear magnetic resonance) [8,9]. These methods had significant disadvantages since they require a long analysis time or expensive instruments. In recent years, the core-shell columns have been increasingly used in the field of quality control of TCM. Core-shell column-HPLC can achieve a high-efficiency separation similar to UPLC [10–12]. Rapid quantitative analysis of the active components of Astragali Radix and Ophiocordyceps sinensis has been achieved by using core-shell chromatography [13,14].
Currently, ESM is the most widely accepted method for the quantitative analysis of TCM. However, the standard chemical markers used in ESM are expensive and difficult to obtain. The absence of such standards represents a major challenge for ESM. QAMS is an ideal strategy to solve this problem. Recently, QAMS has been extensively applied for the quality analysis of TCM, and is considered to be a feasible alternative to ESM [15–17]. It is gradually included in the official pharmacopoeia of an increasing number of countries such as China, India, USA, and the countries in Europe [18].
In the present study, a QAMS method by core-shell column-HPLC was developed for simultaneous determination of four alkaloids including corynoxeine, isocorynoxeine, isorhynchophylline and rhynchophylline (structures as shown in Fig. 1) in U. rhynchophylla. Sample extraction and HPLC conditions were optimized. Nineteen batches of U. rhynchophylla were tested by both QAMS and ESM strategies. The results demonstrated that there was no significant difference between the ESM and QAMS method, which indicated that the QAMS method could be employed as a rapid, effective technique for the quality control of U. rhynchophylla.
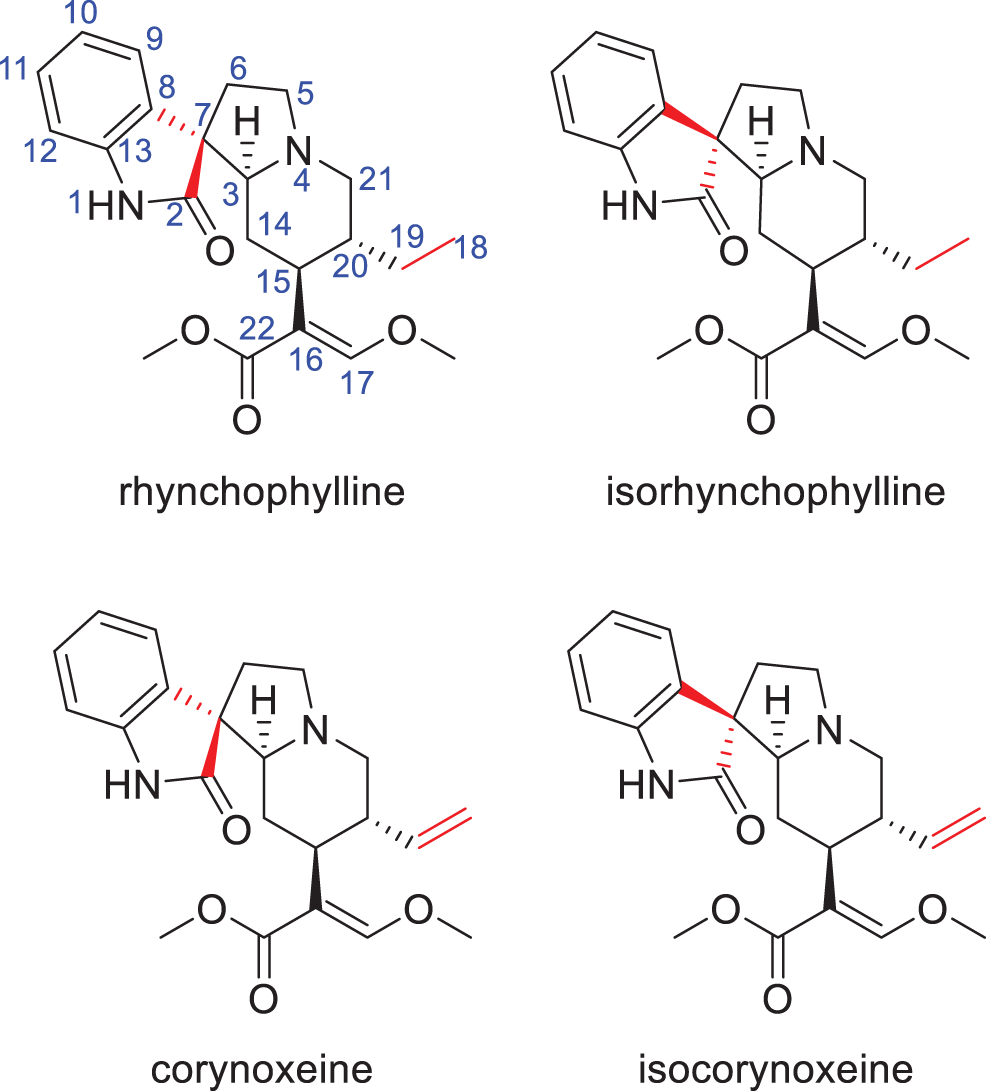
Figure 1: The structures of four alkaloids in U. rhynchophylla
The samples of U. rhynchophylla were gathered from Hunan, Hubei, Guizhou, Yunnan, Guangxi, and Jiangxi Provinces. The botanical origin of the materials was identified by Dr. Ning Li.
Corynoxeine, isocorynoxeine, isorhynchophylline, and rhynchophylline were obtained from Chengdu Must Biotechnology Co., Ltd. (Chengdu, China). The purity of each compound was certified to be >98% and verified by HPLC. HPLC-grade acetonitrile and methanol were purchased from Merck (USA). Triethylamine was purchased from CNW (Germany) and purified water was prepared by a pro-DI System (Sartorius, Germany).
2.2 Instruments and Conditions
HPLC analyses were conducted on Shimadzu LC-2030 HPLC system (Shimadzu, Japan) and Waters e2695 HPLC system (Waters, USA), respectively, which were both equipped with an online degasser, autosampler, quaternary pump, photodiode array detector and column temperature controller. Separation was performed on a PoroShell 120 EC-C18 column (75 mm × 4.6 mm, 2.7 μm). The mobile phase was composed of 0.015 mol·L−1 solution of dipotassium hydrogen phosphate (adjust pH to 7.7–7.8 with 2% phosphoric acid) (A) and acetonitrile (B). The mobile phase ratio was 62:38 (A:B). The flow rate was 0.8 mL·min−1 and the analysis time was 20 min. The detection wavelength was 246 nm while the collection frequency was 5 Hz. The column temperature was set at 25°C. The injection volume was 5 µL.
U. rhynchophylla was crushed and passed through a No. 3 sieve. 2.0 g of the powder was accurately weighed and transferred to a 25 mL conical flask with a stopper. The powder was immersed in 2 mL of ammonia for 30 min and then refluxed with 25 mL methanol for 45 min. Replenish the weight loss with methanol when the sample solvent cooled to room temperature. The test solution was filtered through a PTEE membrane (0.45 µm). The continuous filtrate was taken for subsequent HPLC analysis.
2.3.2 Preparation of Standard Solution
Each standard substance was precisely weighed and dissolved in methanol to prepare the standard stock solutions. These were corynoxeine 161.73 μg·mL−1, isocorynoxeine 163.15 μg·mL−1, isorhynchophylline 160.62 μg·mL−1 and rhynchophylline 159.88 μg·mL−1. The above four standard stock solutions were mixed in a volume ratio of 1:1:1:1 to obtain the mixed standard solution. All the above solutions were stored in a freezer at 4°C.
2.4 Calculation of Relative Correction Factors and Relative Retention Time
Under the chromatographic conditions of Section 2.2, the standard solutions of the four alkaloids mixtures were tested at different concentrations and peak retention times were recorded to establish the RRT (relative retention time). The RRT is calculated by the following Eq. (1):
Ti and Tx respectively denote the retention times of isorhynchophylline and the relevant analyte.
2.4.2 Relative Correction Factors
Currently, two methods are commonly used to calculate the relative correction factor, the concentration method and the slope method [19,20]. The slope method cannot neglect the effect of the interception in the line regression equation, while the concentration method only uses a solution of one single concentration. To address these issues, a combination of the two methods was employed. Eqs. (2) and (3) were used to calculate the RCF (fsi). The averages of the results calculated by the two methods were used as the final RCF values. Isorhynchophylline was selected as the internal reference substance.
From Eqs. (2) and (3), we can infer Eq. (4):
where Cs and Ci are the concentrations of isorhynchophylline and other components; As and Ai are the peak areas of isorhynchophylline and other components; Ks and Ki are the standard curve slopes of isorhynchophylline and other components, respectively.
Additionally, this study investigated the influence of different HPLC conditions on the robustness of RCFs.
Data was analyzed through SPSS 26.0 statistical software.
3.1 Optimization of Extraction Condition
Alkaloid components are easily soluble in organic solvents such as chloroform and methanol. In this study, chloroform and methanol were comparatively studied, methanol showed better extraction efficiency than chloroform. Two extraction methods including ultrasonic extraction and refluxing extraction were compared. The results showed that the efficiency of reflux extraction was about 20% higher than that of sonication. The influence of refluxing time and number of extractions were investigated. The total amount of the four alkaloids reached the peak when the heating time was 45 min and then tended to be stable, but decreased slightly. No significant difference was observed between multiple extraction and one single extraction of 45 min. In addition, the test found that adding 2 mL of concentrated ammonia to U. rhynchophylla powder before the extraction could improve the extraction yields of alkaloids by 32.9%–48.2%. Most alkaloids exist in plants in the form of salts, which can be converted into free state after infiltration with ammonia [21].
The above results indicated that the optimized extraction conditions were as follows: adding 2 mL of the ammonia for 30 min soaking and then adding 25 mL of methanol and refluxing extraction for 45 min.
3.2 Optimization of the Chromatographic Conditions
Different mobile phases, methanol/water and acetonitrile/water with different pH adjusting agents such as triethylamine, dipotassium hydrogen phosphate, phosphoric acid, ammonium acetate and dipotassium hydrogen phosphate were compared. 0.015 mol·L−1 solution of dipotassium hydrogen phosphate with acetonitrile provided a better separation between the four alkaloids. Representative HPLC chromatograms with different buffer pH were shown in Fig. 2. As a result, we chose acetonitrile (A)0.015 mol·L−1 solution of dipotassium hydrogen phosphate (adjust pH to 7.7–7.8 with 2% phosphoric acid, B) system. Moreover, the flow rates (0.7, 0.8, 0.9, and 1.0 mL·min−1), column temperatures (22°C, 25°C, and 28°C), and mobile phase ratios were carefully evaluated and compared. The study found that with the increase of the flow rate, the pressure of the chromatographic column increased gradually while the separation of each peak gradually decreased. Finally, we optimized the mobile phase ratio as 38:62 (A:B), the column temperature was 25°C, while the flow rate was set at 0.8 mL·min−1. The detection wavelength was set at 246 nm for both sensitivity and specificity. These chromatographic conditions could provide a desired separation in less than 20 min.
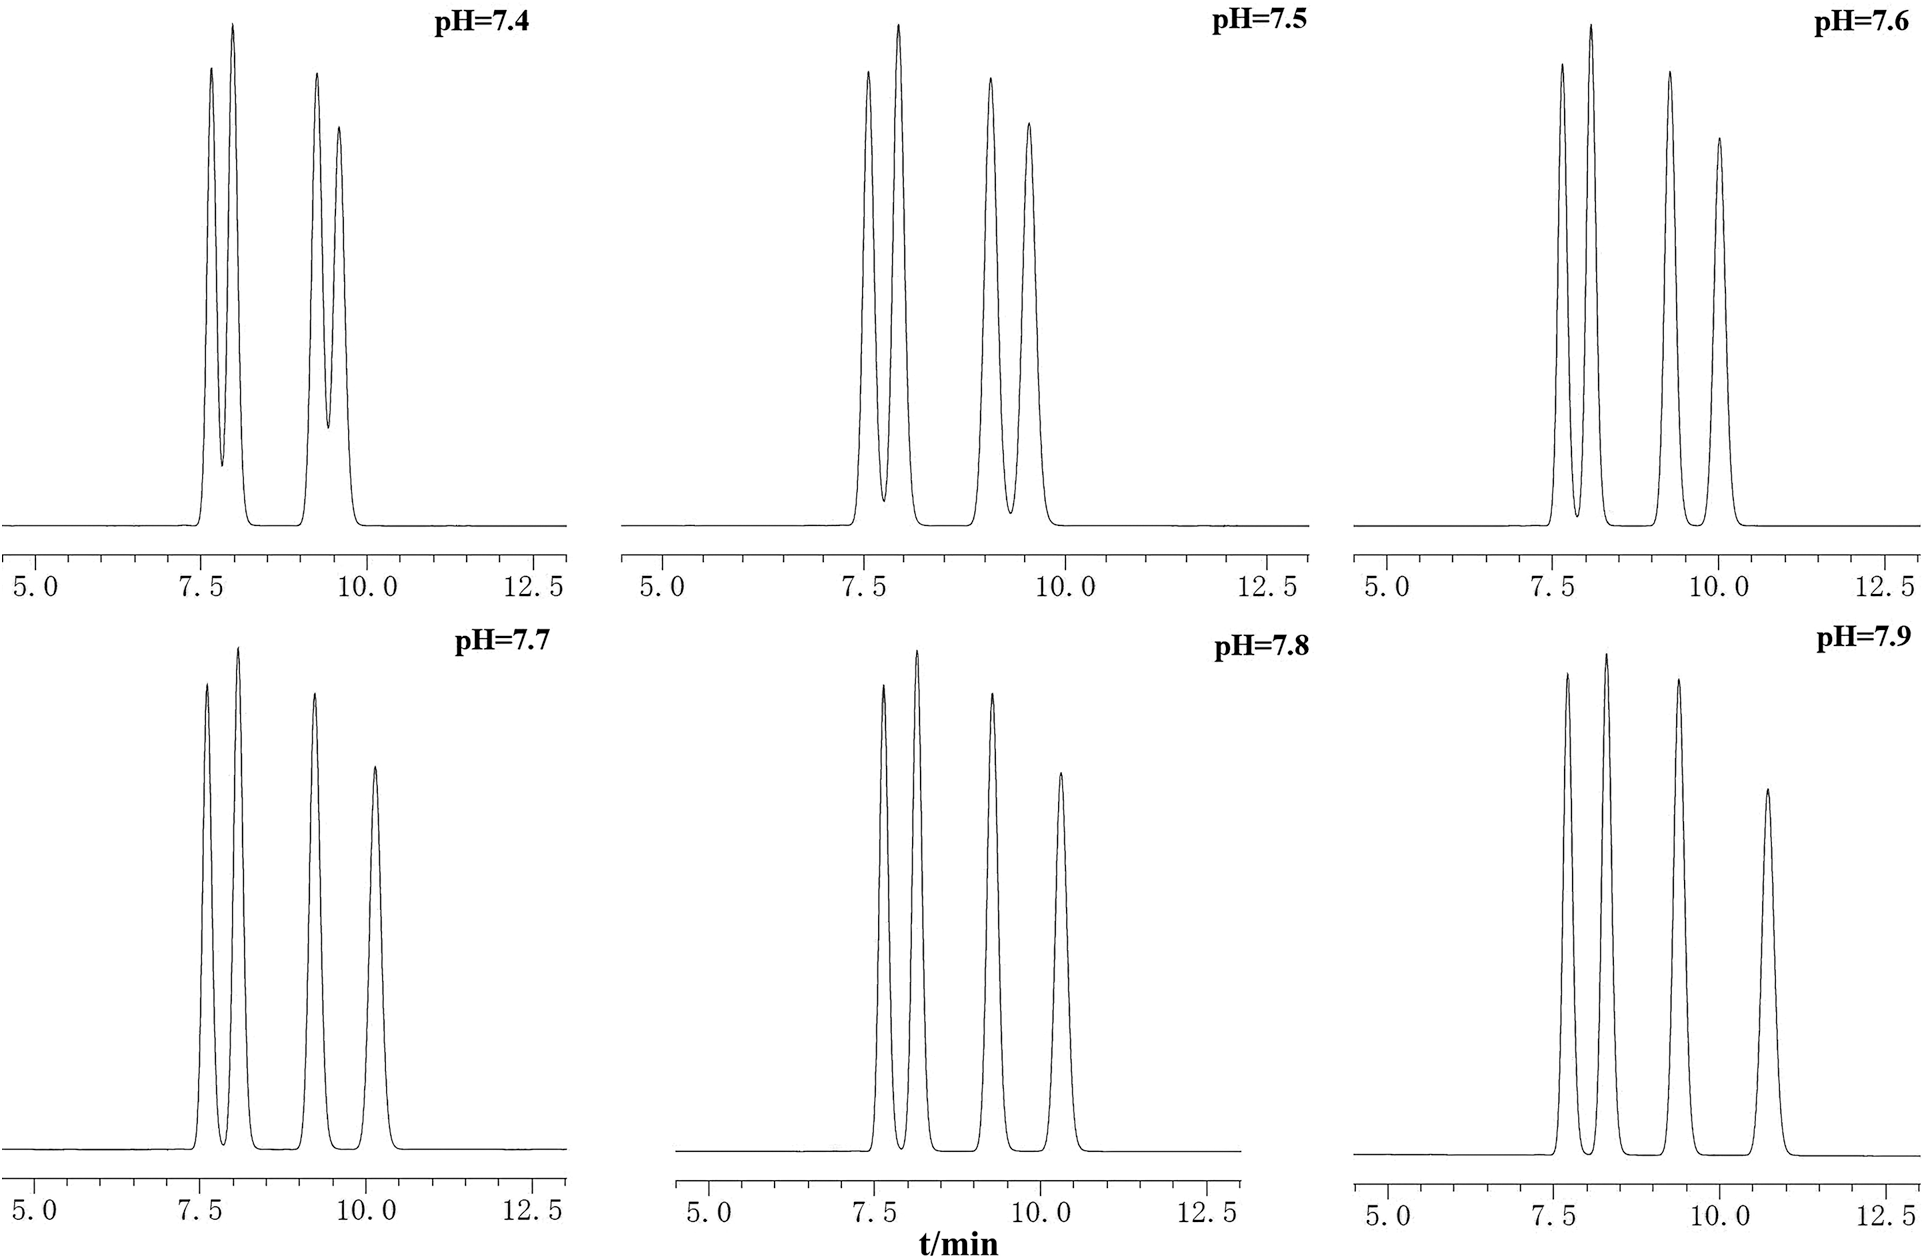
Figure 2: Chromatograms of mixed standard solution under the mobile phases with different pH
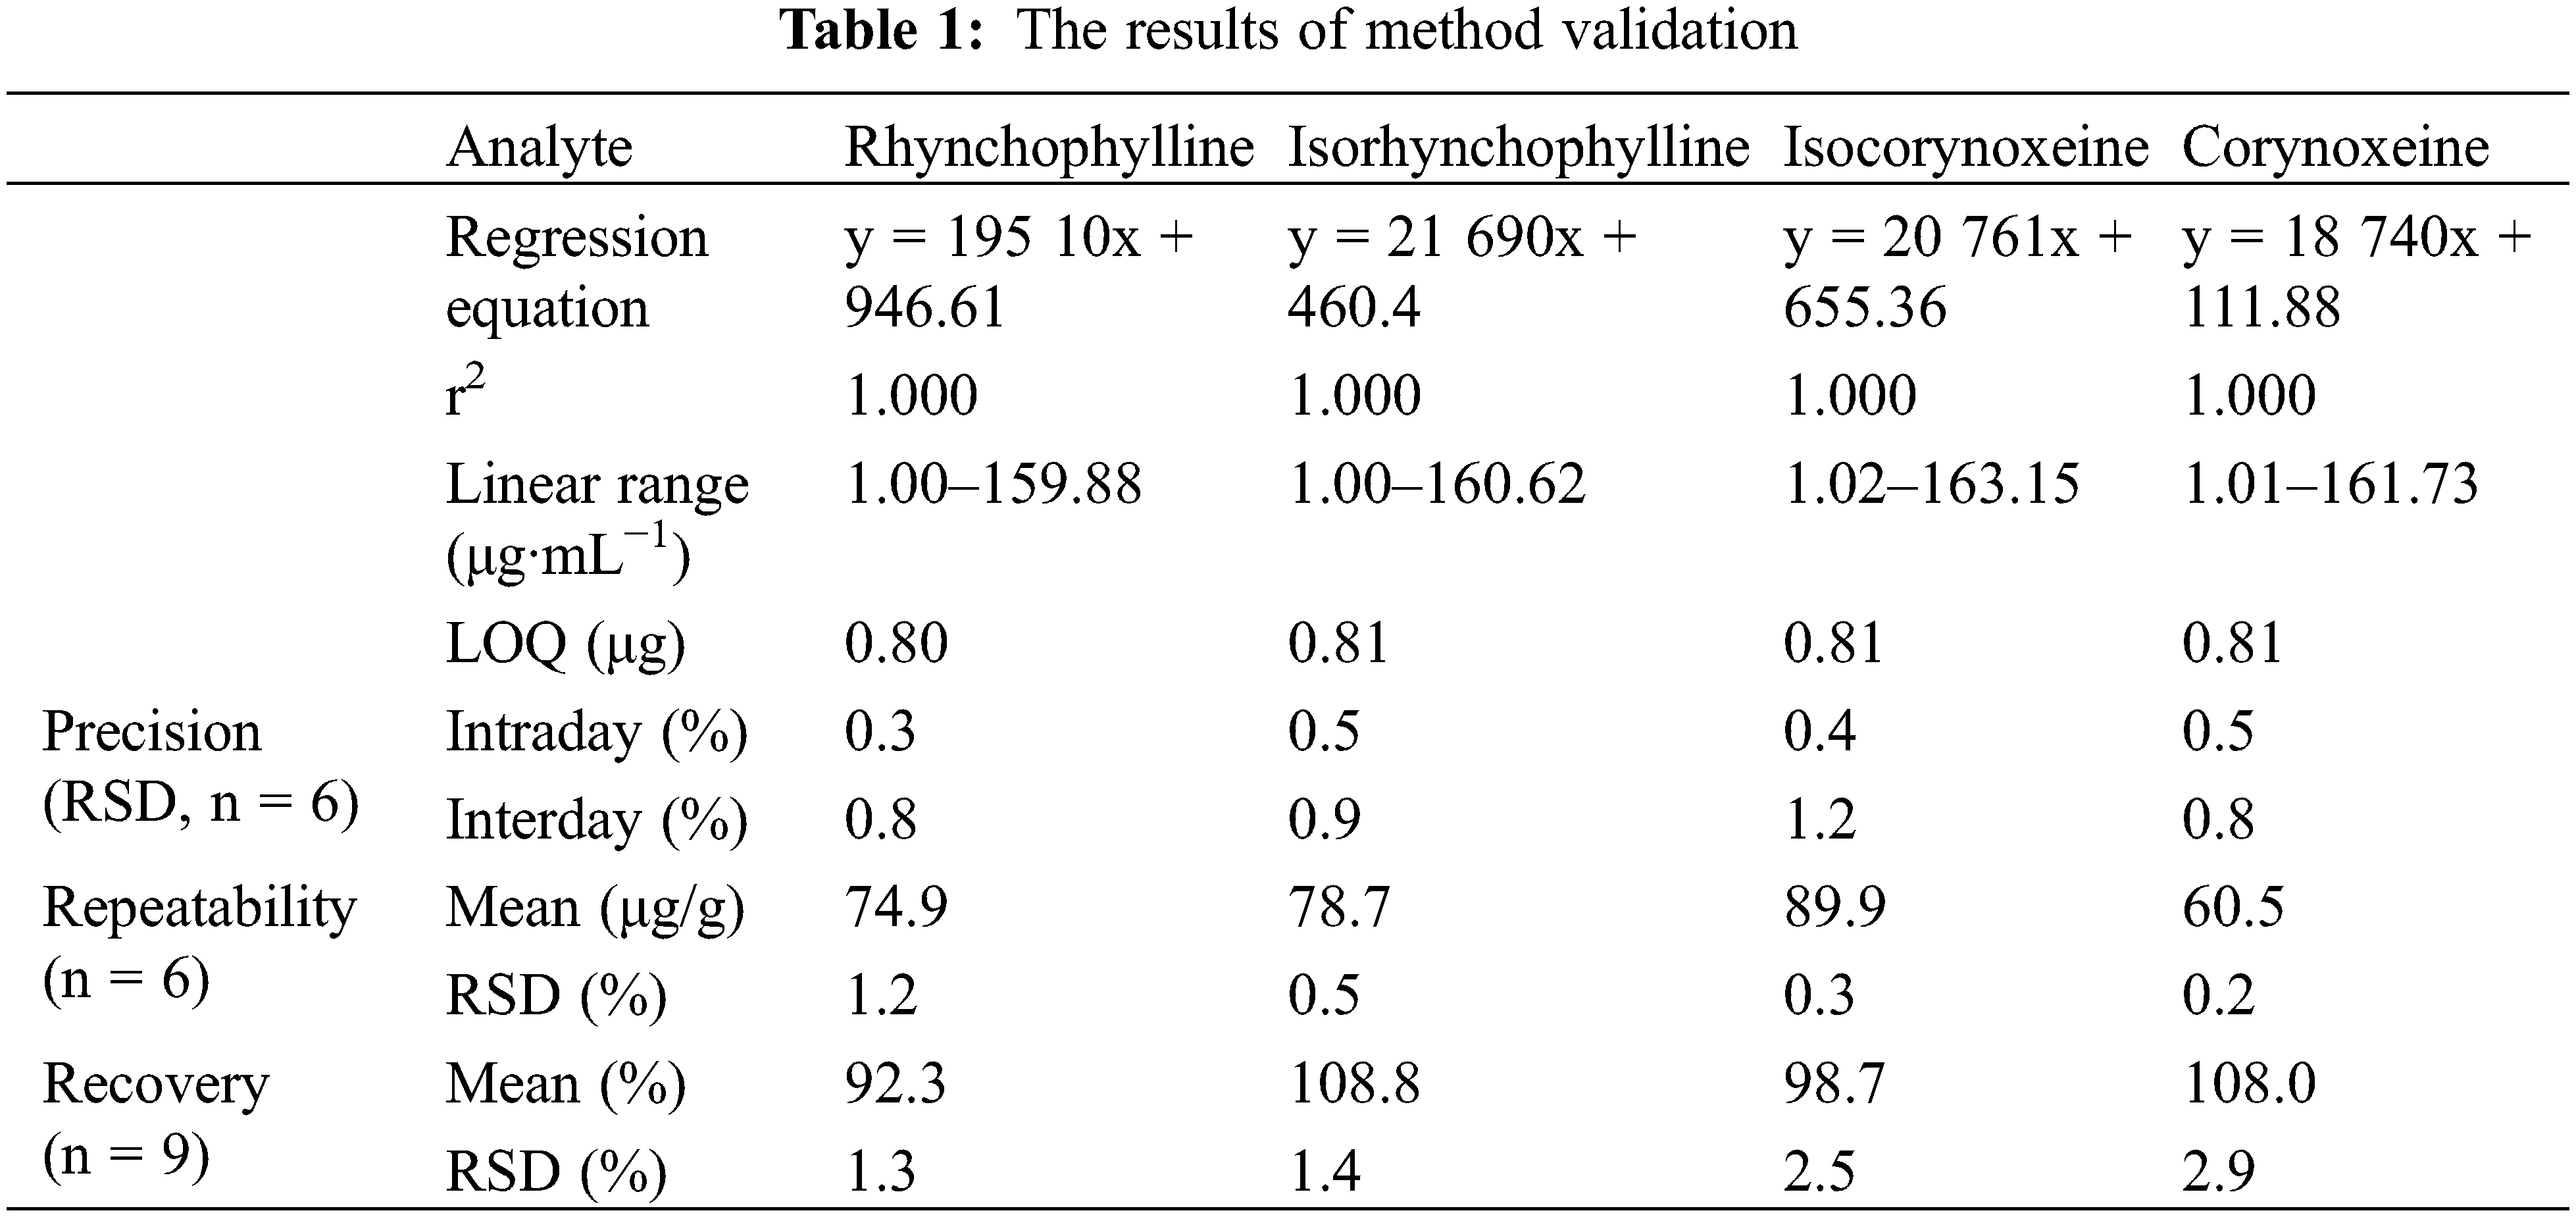
The established HPLC method was validated for the linearity, limits of quantification, precision, repeatability, stability and accuracy.
The standard stock solution was diluted 2, 4, 8, 16, 32 and 160 times with methanol to obtain 6 mixed standard working solutions I–VI. The linearity of four alkaloids were evaluated by plotting the calibration curves with the six levels of concentration of the solution listed above and the corresponding peak areas. The correlation coefficient values (r2 > 0.9999) indicated that the four alkaloid components had a good linear relationship within the concentration range of the design.
3.3.2 Limits of Quantification
The standard solution containing four alkaloid components was diluted constantly with methanol, injected and analyzed according to the chromatographic conditions under Section 2.2. A signal-to-noise ratio (S/N) of 10 was used to determine the limit of quantification (LOQ).
3.3.3 Precision, Repeatability and Stability
The method precision was conducted by injecting the standard solution for six consecutive times and the repeatability was assessed by injecting six independently prepared samples according to the approach described in Section 2.3.1. Moreover, the stability of the sample solution was evaluated by the determination of the same sample solution (S1) stored at room temperature (25°C ± 2°C) at different time points (0, 3, 6, 9, 12 and 24 h). The results demonstrated that the sample solutions were relatively stable within 24 h.
The accuracy of the method was assessed by recovery. The investigated components were spiked at three distinct concentrations (50%, 100% and 150%) to a certain amount (1.0 g) of sample. Extraction and analysis of the mixture were repeated three times according to the method described in Sections 2.2 and 2.3.1. The average recovery and RSD% of each alkaloid components were calculated.
All the above methodological test information was summarized in Table 1. The results showed that the analytical method was accurate and reliable.
3.4 Quantitative Analysis of Multi-Components by Single Marker
3.4.1 Selection of the Internal Reference Substance
The selection of the internal reference substance must take into account the characteristics of easy availability, high stability, low cost, and low difficulty in preparation [10]. Compared with the other three components to be analyzed, the chromatographic peak of isorhynchophylline is in the middle of the chromatogram, with high response value and a low price. Therefore, isorhynchophylline was selected as the internal reference substance.
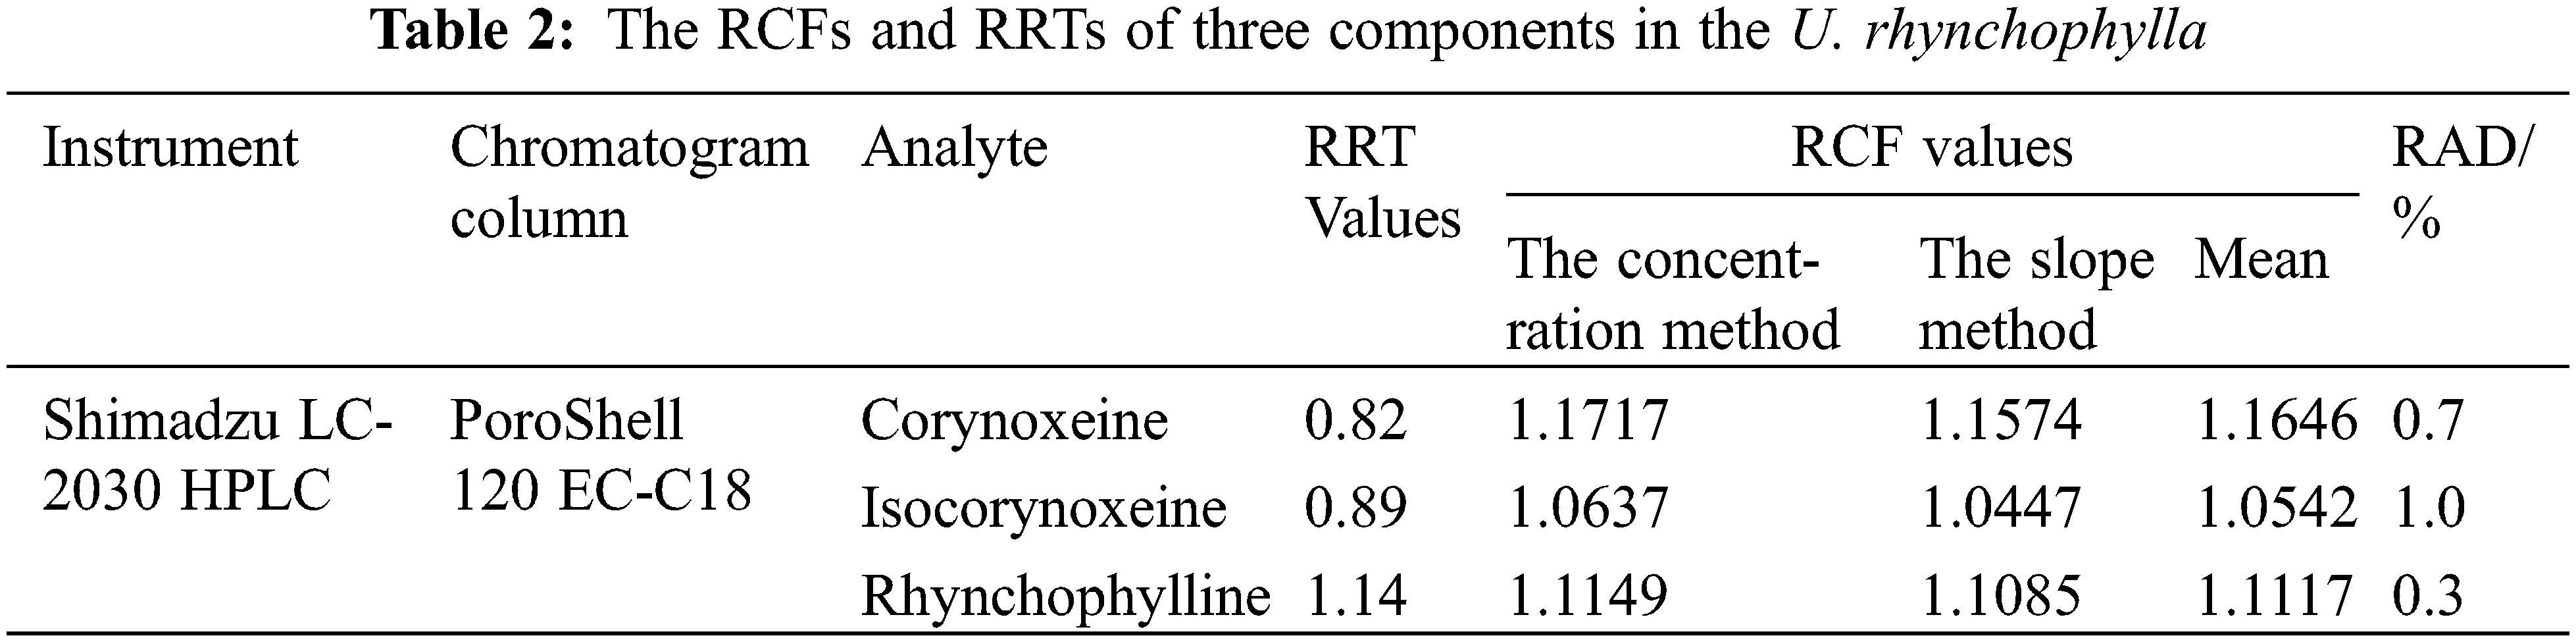
3.4.2 Calculation of RCFs and RRTs
This study evaluated two calculation methods of the RCFs which had been previously reported [14,15]. On one hand, we calculated the ratios of the slopes of the calibration equations for the three alkaloid components relative to the isorhynchophylline; on the other hand, the RCFs of the three alkaloid components were calculated by six gradient concentrations. The experiment results demonstrated that there was no significant distinction in the results calculated by the two methods, and the relative mean deviations (RAD) was less than 2%.
We calculated the results of RCFs and RRTs according to Eqs. (1)–(3). The results of the three components were displayed in Table 2.
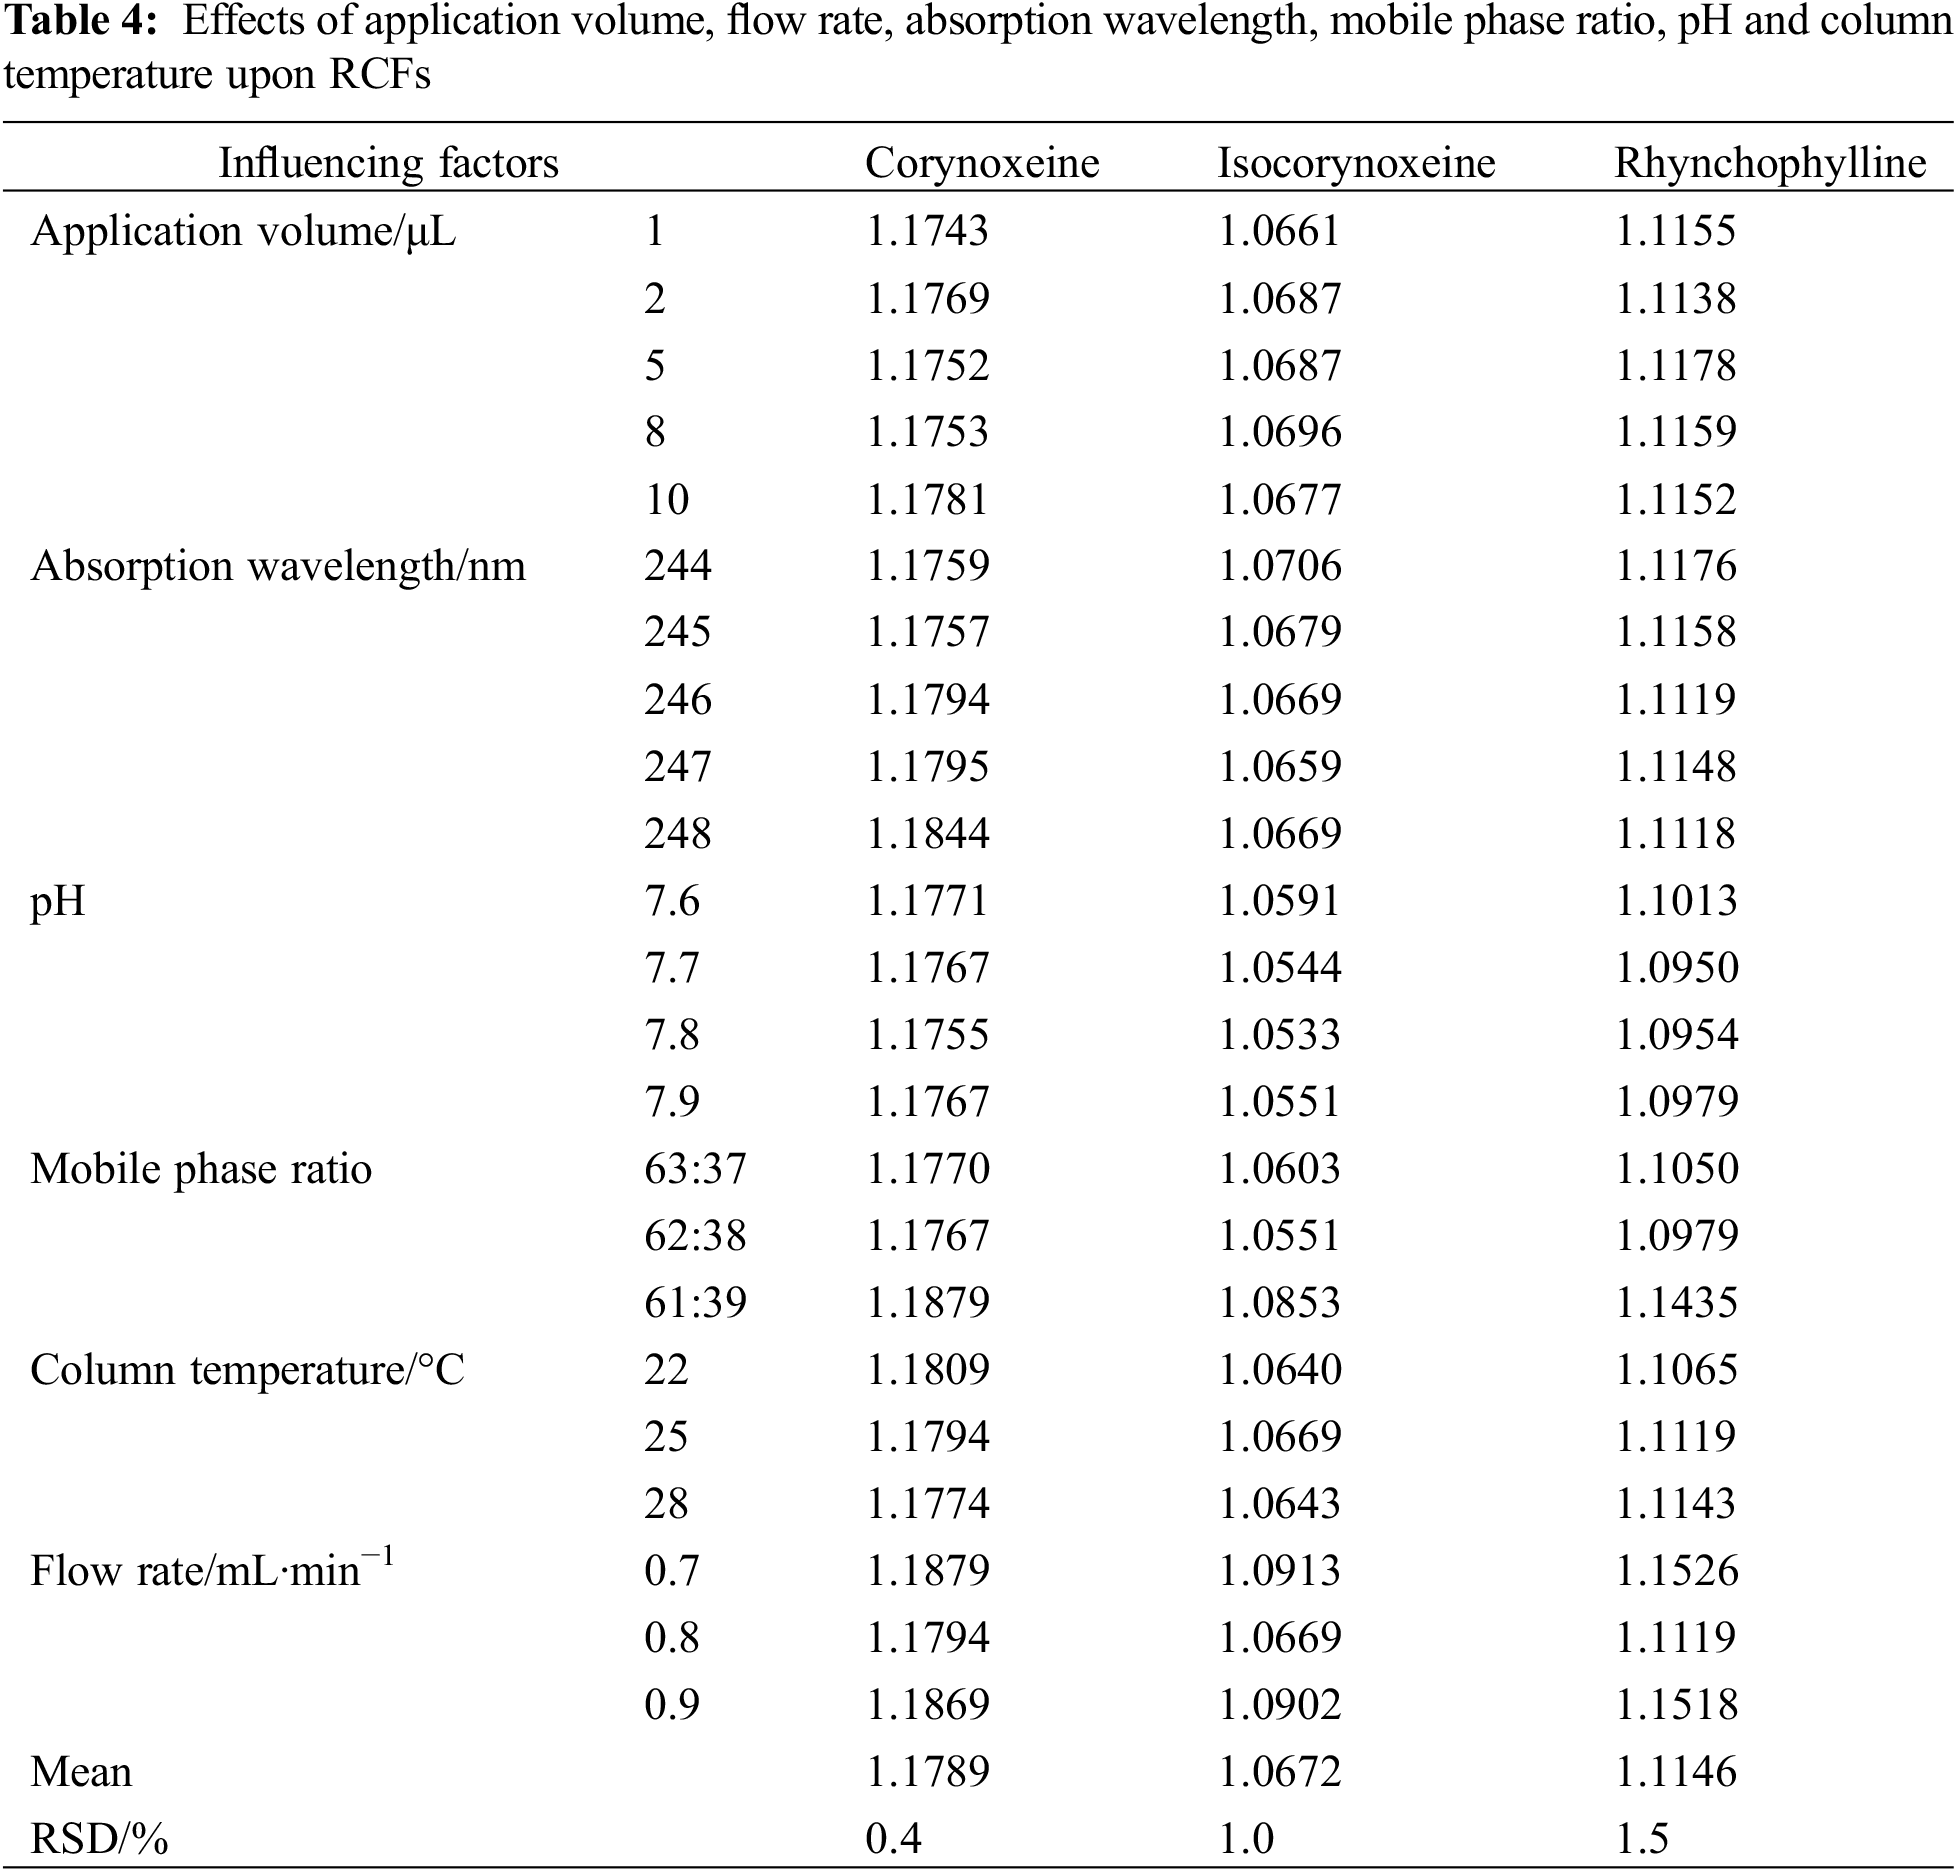
As shown in Tables 3 and 4, this work investigated the variation of RCFs in different applied volumes, flow rates, column temperatures and instruments. The impact of various chromatographic conditions on the robustness of RCFs in the QAMS method was evaluated.
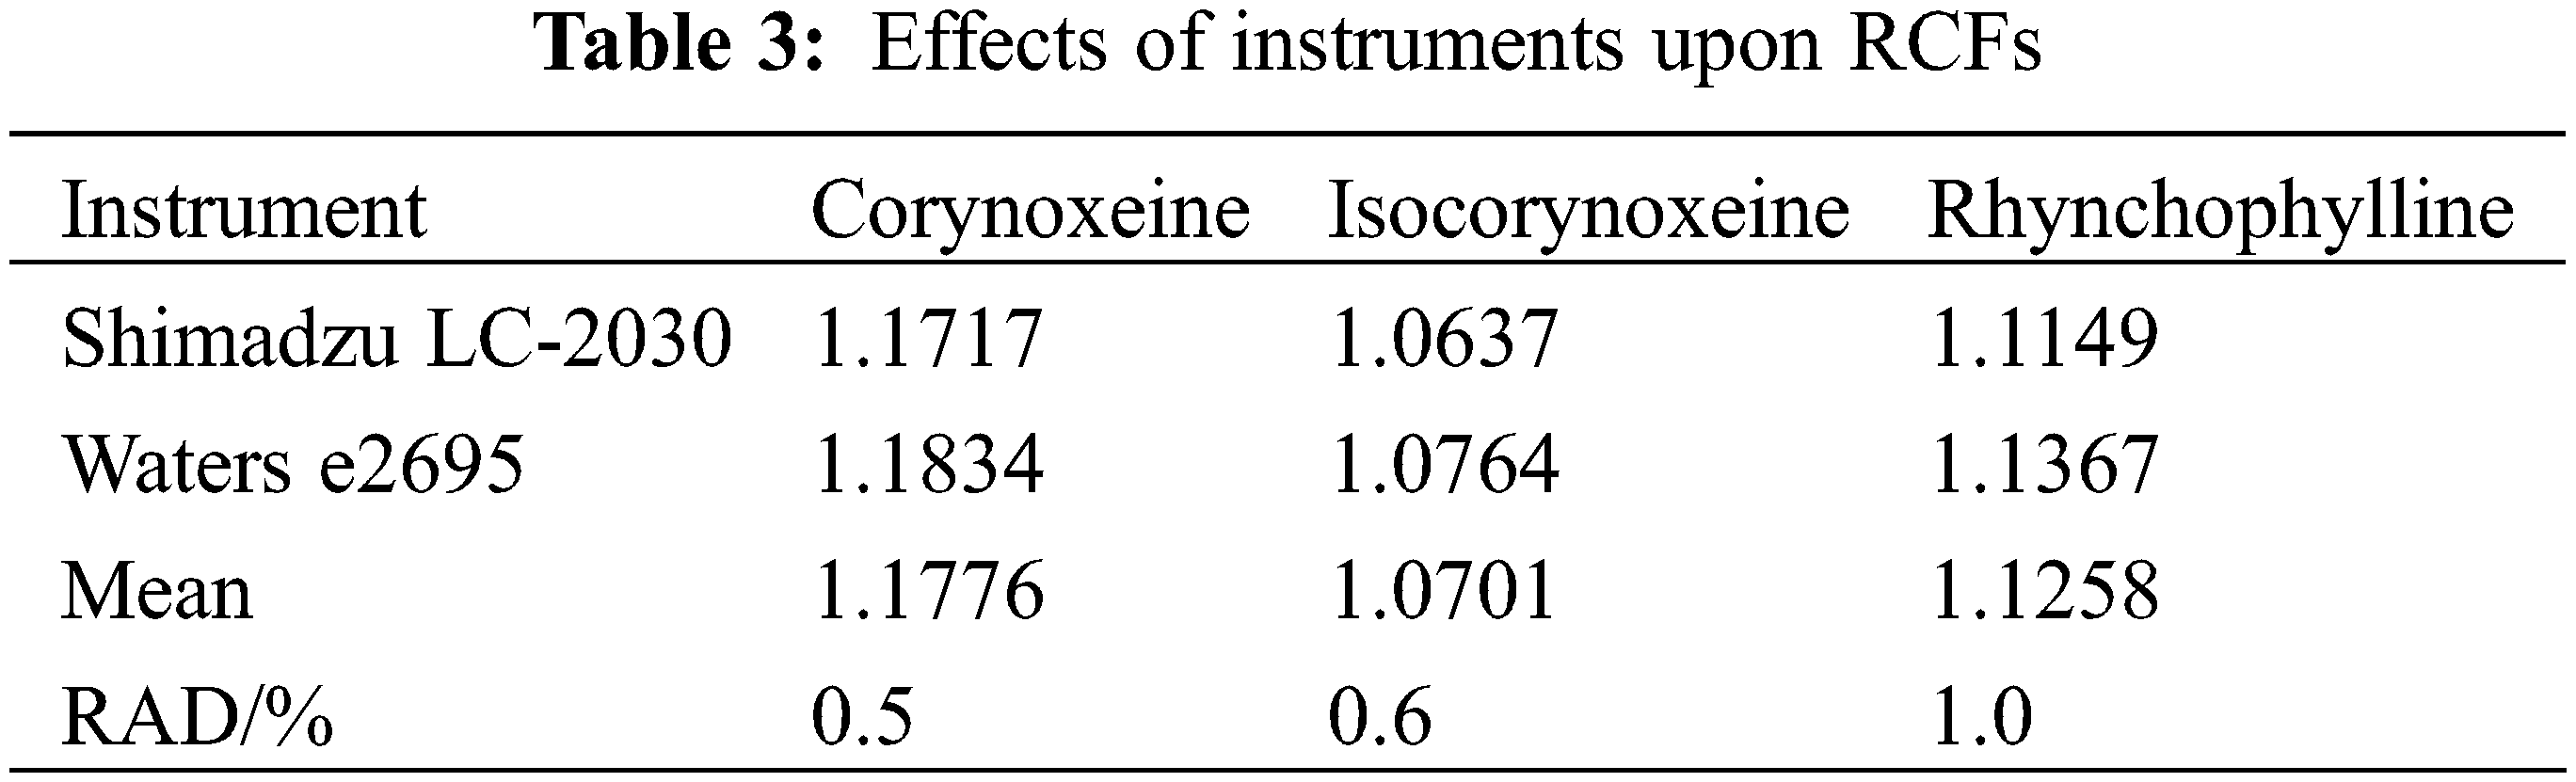
The data in Table 3 exhibited that all RAD values was less than 2%, which indicated that the deviations caused by distinct HPLC instruments had little effect on the RCFs. It showed that the QSM method was also highly feasible to be applied to different HPLC instruments.
As illustrated in Table 4, all RSD values were less than 2%. The RSDs of all the six influencing factors were <3.0%, all of these deviations caused by the above parameters were small and the RCFs of these alkaloids were fairly steady. The above results verified the robustness of the method to a certain extent.
3.4.4 Consistency Assessment of QAMS and ESM Results
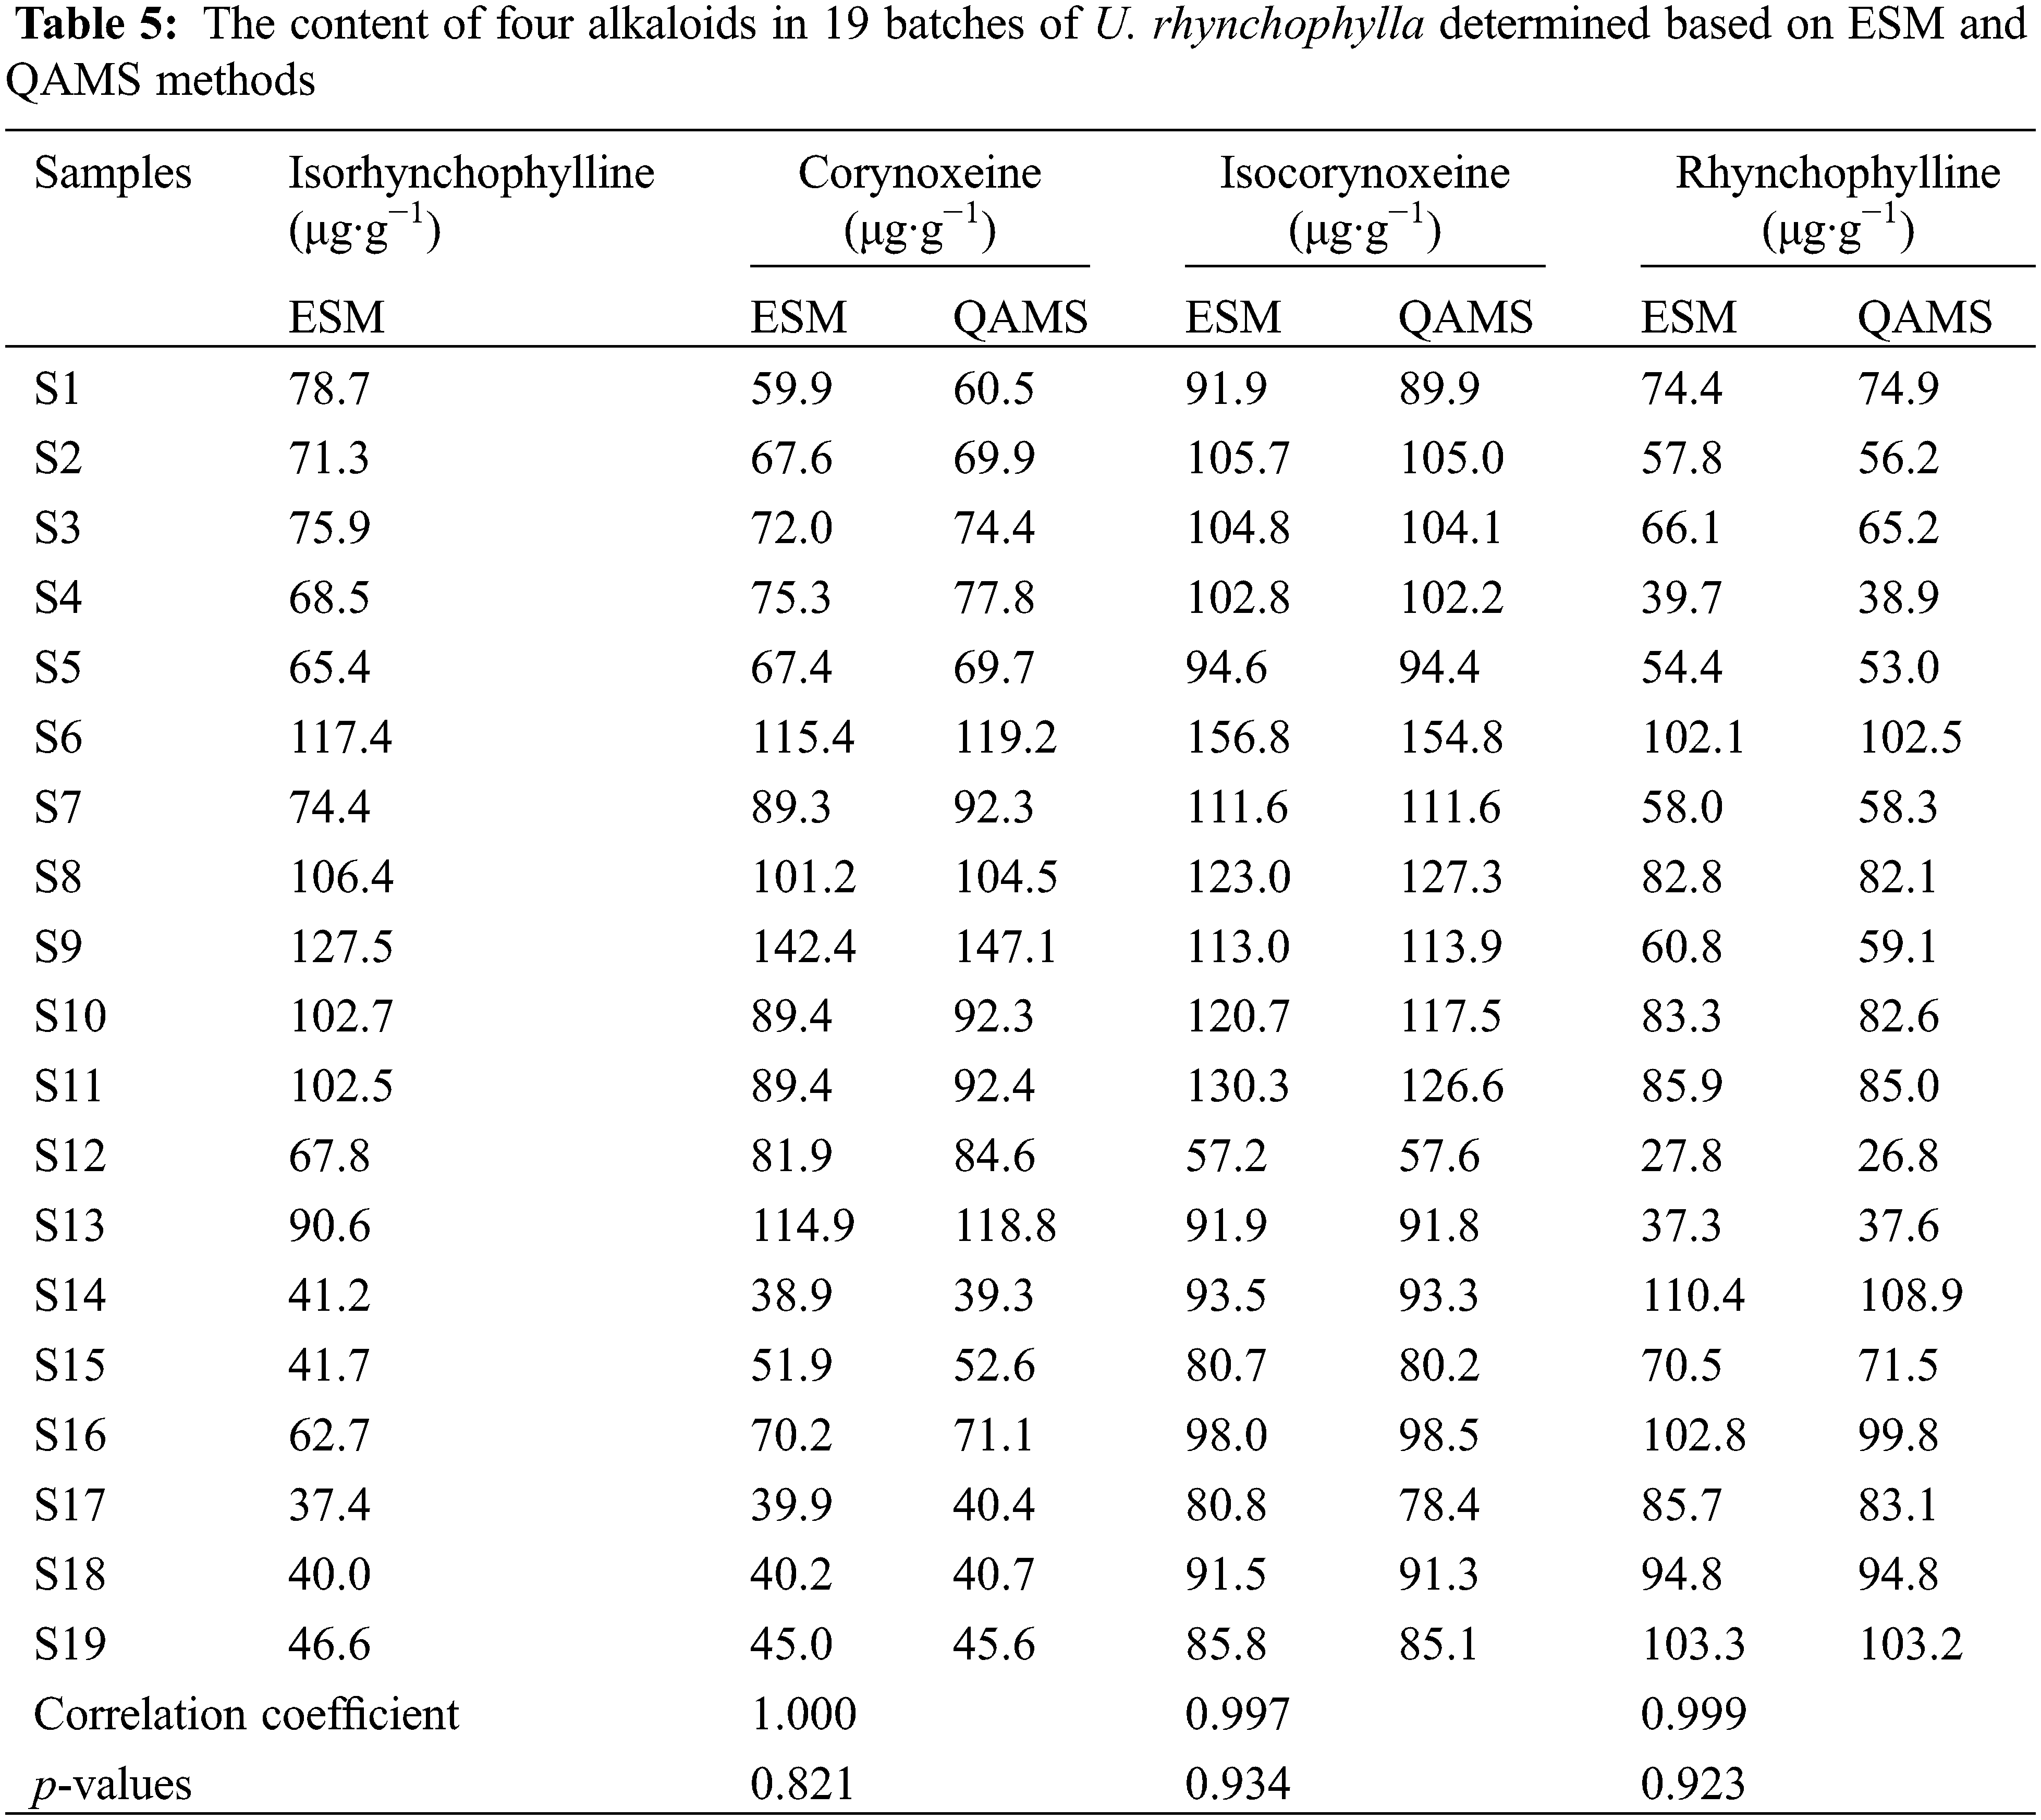
To assess and validate the practicability of QAMS method, the contents of the four alkaloids in 19 typical samples from six regions were calculated by ESM and the QAMS method based on RCFs. After 19 batches of samples were verified, the relative errors of these two methods were within 2%. Afterward, a t-test was performed for the QAMS and ESM results, p-values of corynoxeine, isocorynoxeine, and rhynchophylline, were all > 0.05. The correlation coefficients were all greater than 0.99. The nearer the correlation coefficient value got to 1, the more alike the target sample was. The above result indicating that there was no significant difference between the calculation results of the ESM and the QAMS methods. The calculation results of the QSM and ESM methods of the three components were displayed in Table 5, respectively.
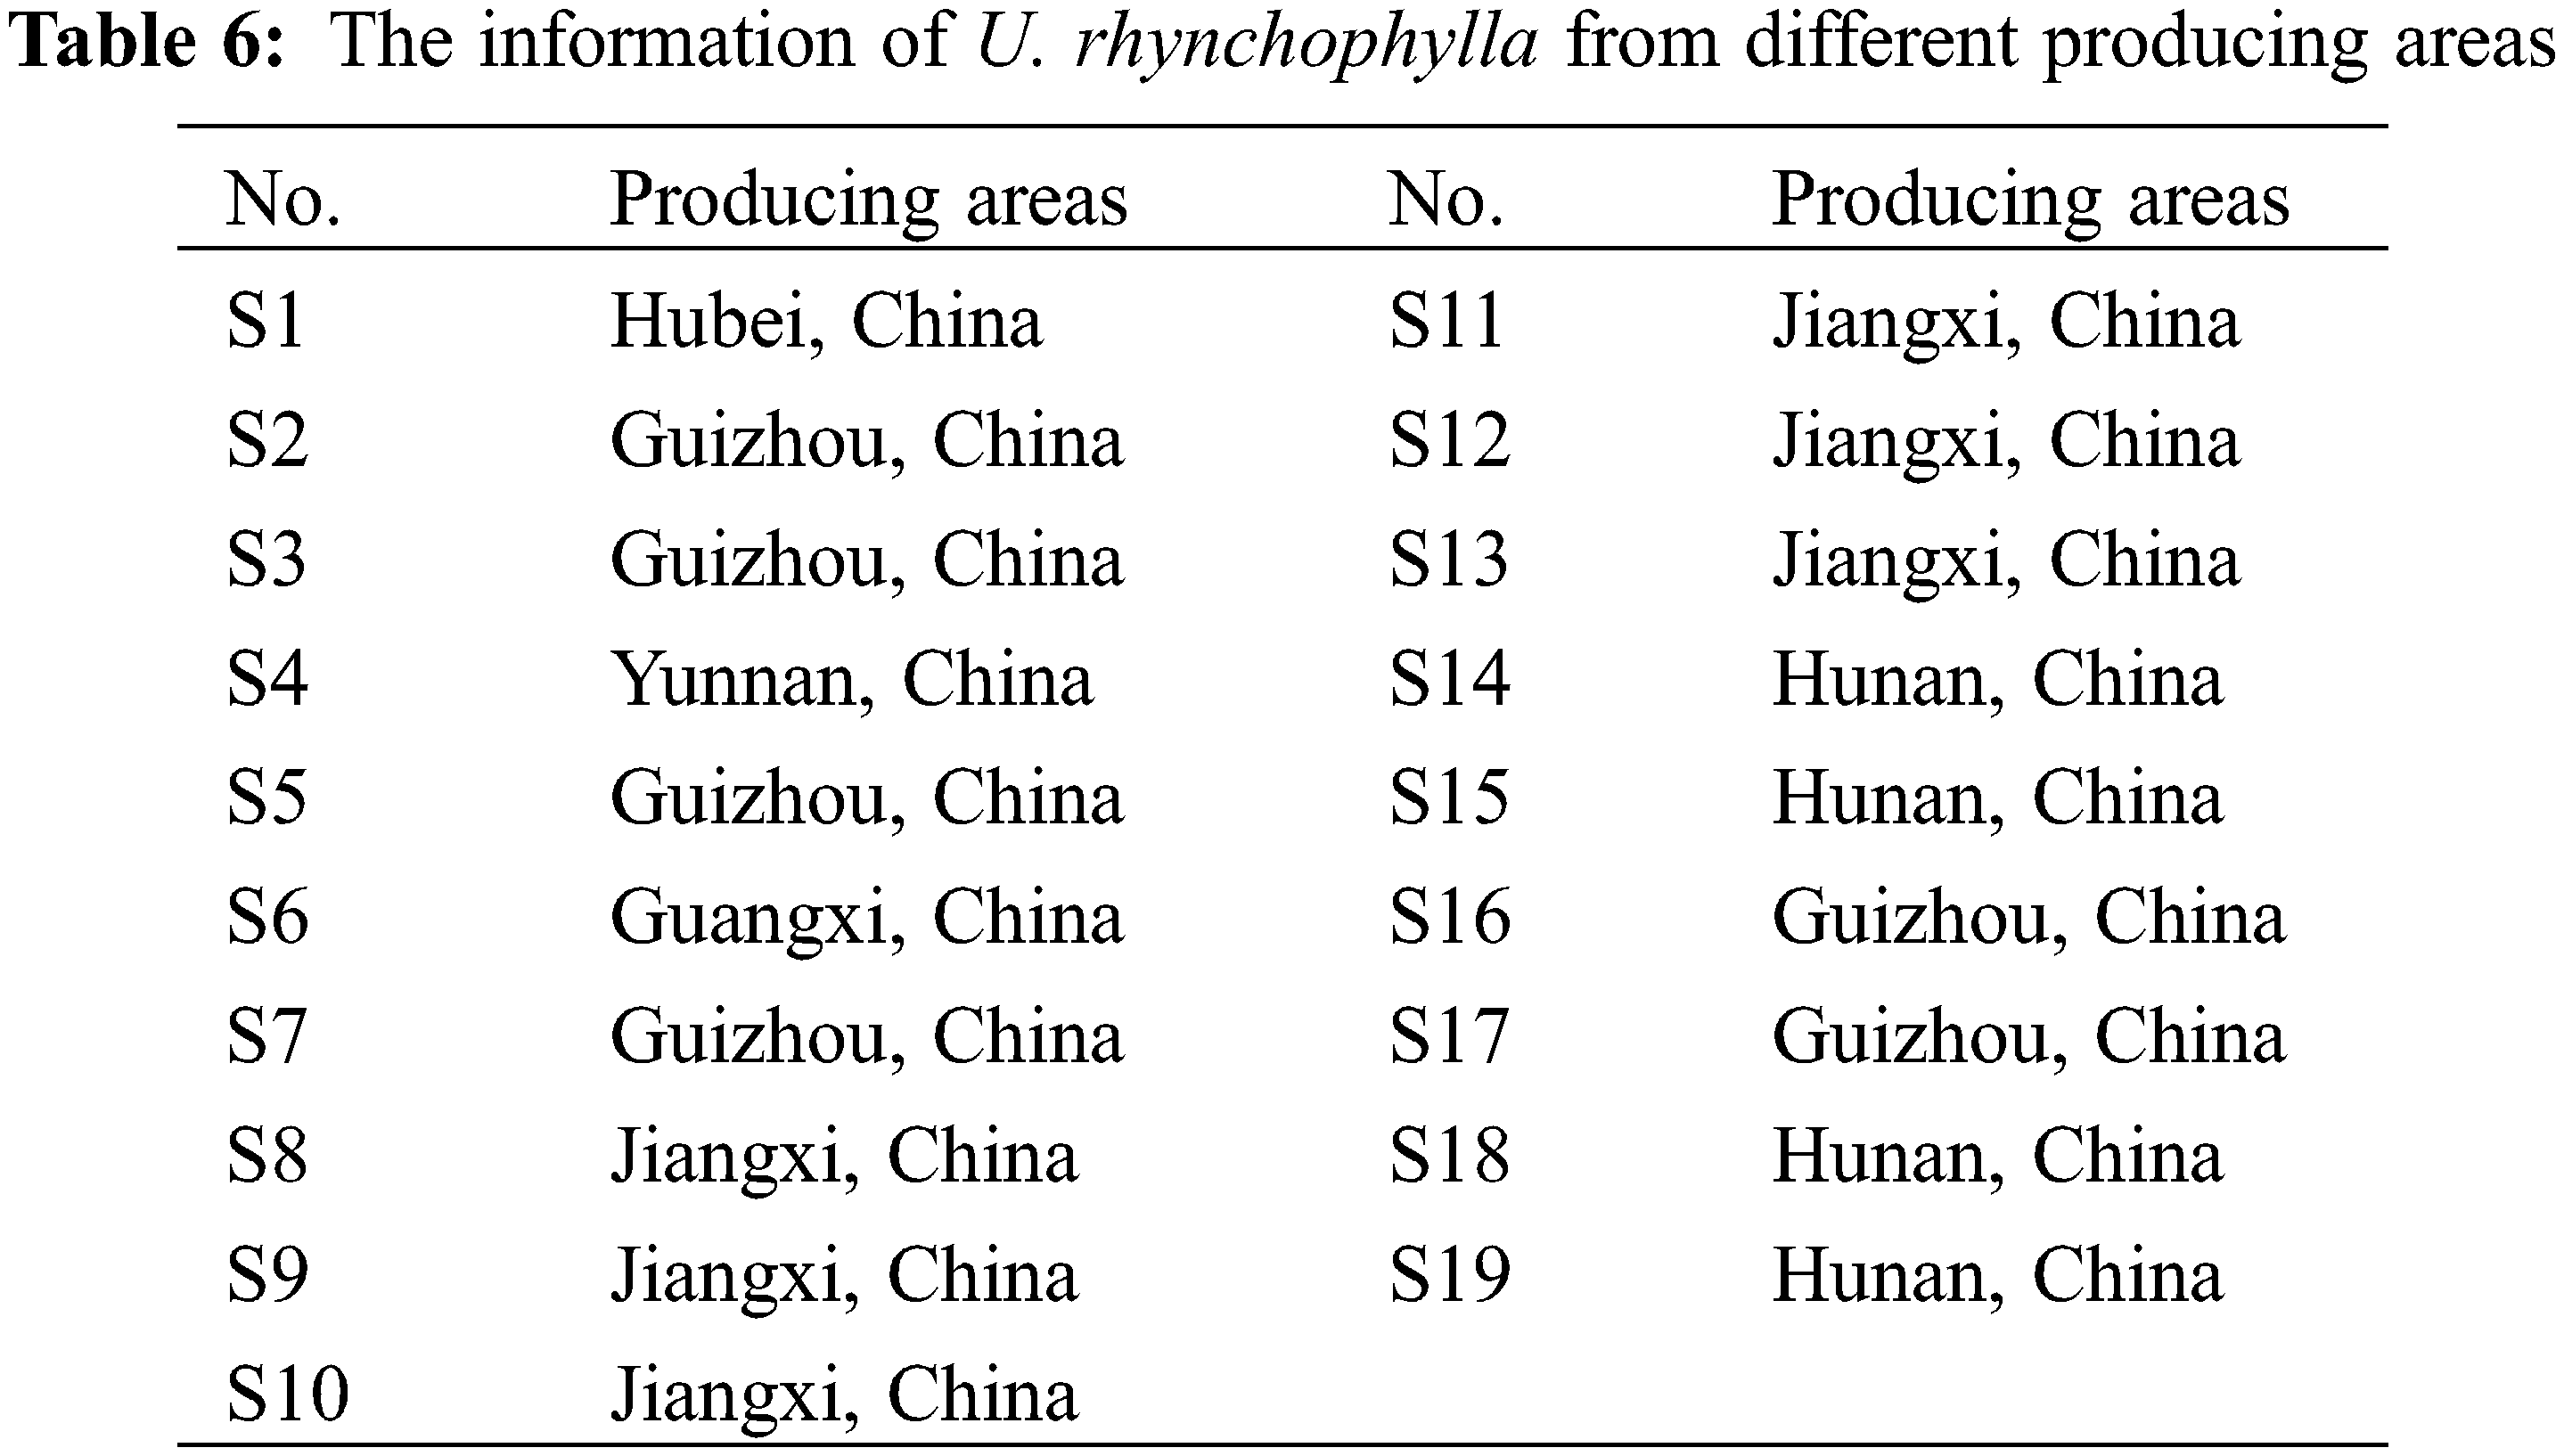
This newly established HPLC method was applied to the determination of the four alkaloids in U. rhynchophylla. The analysis time of this new method was 20 min, while more than 50 min was usually taken in the previous reports [22]. The established QSM method was also applicable to conventional columns but was not recommended due to its chromatographic analysis time exceeding 75 min. The core-shell column chromatograms of reference compounds and U. rhynchophylla were shown in Fig. 3. The contents of the four alkaloids in 16 batches of U. rhynchophylla samples were selected as a variable to obtain ANOVA results (Eliminated S1, S4 and S6 data) so that we could acquire an objective quantitative analysis of U. rhynchophylla of various origins. The results demonstrated that there were significant differences in the isorhynchophylline and corynoxeine contents in U. rhynchophylla from different origins. The p-values of isorhynchophylline and corynoxeine were 0.001 and 0.002, which were all <0.05. The overall average values of isorhynchophylline and corynoxeine of U. rhynchophylla in Jiangxi province were the highest, which presumably were induced by the different growing conditions of U. rhynchophylla in Jiangxi province. The possible influencing factors included soil type, climate, humidity, and temperature etc. The sample information of U. rhynchophylla from different origins were shown in Table 6.
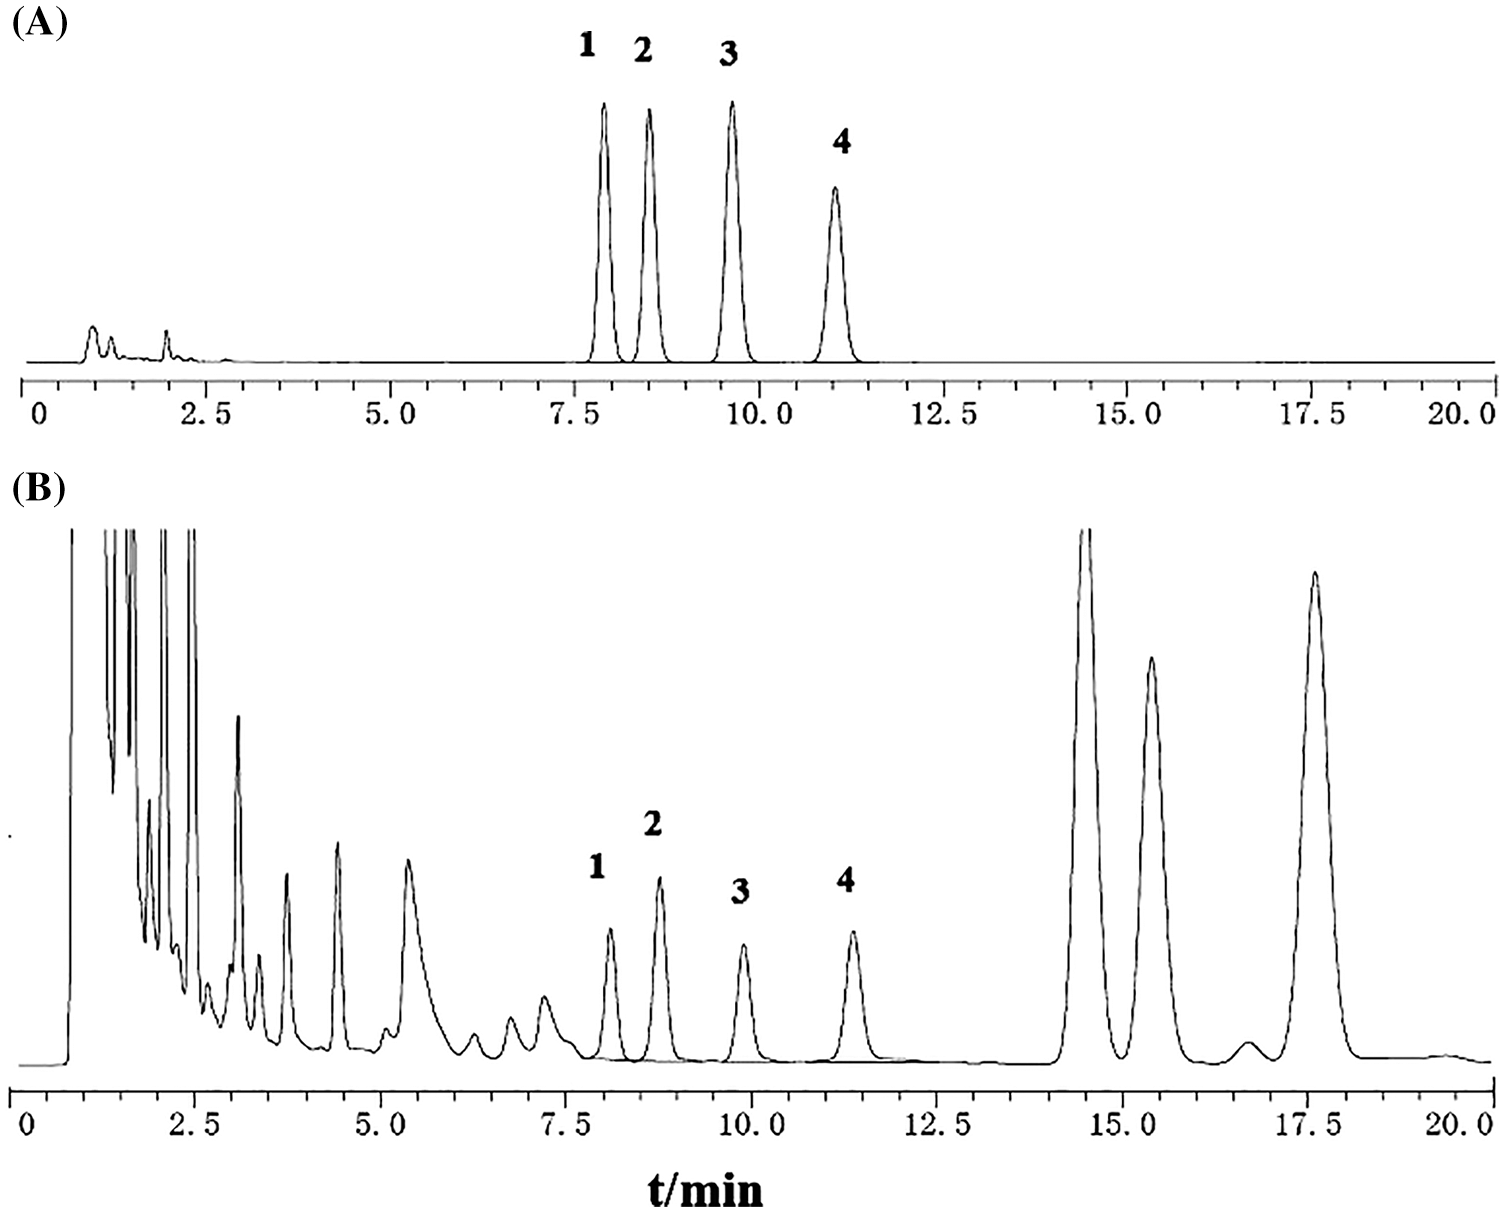
Figure 3: HPLC of core-shell column chromatogram (A) and test products (B) 1: corynoxeine; 2: isocorynoxeine; 3: isorhynchophylline; 4: rhynchophylline
In this study, a rapid method for the simultaneous determination of four alkaloids in U. rhynchophylla by core-shell column HPLC and QAMS was established. The quantitative analysis method has good linear relationship, precision, repeatability, durability, sample recovery rate and stability. No significant difference was observed between the results by QAMS and EMS. The QAMS method could be employed as a rapid, effective technique for the quality control of U. rhynchophylla. This study provided an example for the quality evaluation of TCM by using a combination of core-shell column HPLC and QAMS.
Authorship: Kesheng Lin and Jiawen Zhou performed the experiment. Kesheng Lin analysed the experimental data and wrote the manuscript. Ning Li and Lijuan Han designed the research.
Acknowledgement: We thank the anonymous reviewers for their helpful comments.
Conflicts of Interest: The authors declare that they have no conflicts of interest to report regarding the present study.
References
1. Andre, N., Wang, X. M., Pan, G. X., Zhang, F., Feng, H. et al. (2013). A review on indole alkaloids Isolated from Uncaria rhynchophylla and their pharmacological studies. Fitoterapia, 86, 35–47. DOI 10.1016/j.fitote.2013.01.018. [Google Scholar] [CrossRef]
2. Chinese Pharmacopoeia Commission (2020). Pharmacopoeia of the PeopIe’s RepubIic of China, pp. 268–269. China: China Medical Science Press. [Google Scholar]
3. Laus, G. (2004). Advances in chemistry and bioactivity of the genus Uncaria. Phytotherapy Research, 18(4), 259–274. DOI 10.1002/ptr.1469. [Google Scholar] [CrossRef]
4. Zhang, Y. W., Xu, J. Q., Tian, Z. H., Chen, Z. S. (2022). Chemical constituents of Uncaria rhynchophylla. Chemistry of Natural Compounds, 58(1), 129–131. DOI 10.1007/S10600-022-03638-5. [Google Scholar] [CrossRef]
5. Li, Y., Yu, R. X., Zhang, D., Yang, W. Q., Hou, Q. Q. et al. (2020). Deciphering the mechanism of the anti-hypertensive effect of isorhynchophylline by targeting neurotransmitters metabolism of hypothalamus in spontaneously hypertensive rats. ACS chemical neuroscience, 11(11), 1563–1572. DOI 10.1021/acschemneuro.9b00699. [Google Scholar] [CrossRef]
6. Tian, Z. H., Zhang, S. M., Wang, H. J., Chen, Z. S., Sun, M. J. et al. (2010). Intervention of Uncaria and its components on liver lipid metabolism in spontaneously hypertensive rats. Frontiers in pharmacology, 11, 910. DOI 10.3389/fphar.2020.00910. [Google Scholar] [CrossRef]
7. Zhang, J. G., Chen, J. J., Geng, C. A. (2019). Advances in indole alkaloids from traditional Chinese medicine of Uncariae Ramulus Cum Uncis documented in Chinese Pharmacopoeia. China Journal of Chinese Materia Medica, 44, 685–695. DOI 10.19540/j.cnki.cjcmm.20181121.006. [Google Scholar] [CrossRef]
8. Yin, T. P., Lu, J. G., Liu, Q. H., Zhu, G. Y., Zhang, W. et al. (2021). Validated quantitative 1H NMR method for simultaneous quantification of indole alkaloids in Uncaria rhynchophylla. ACS Omega, 6(47), 31810–31817. DOI 10.1021/ACSOMEGA.1C04464. [Google Scholar] [CrossRef]
9. Chen, L. G., Ma, J. S., Wang, X. Q., Zhang, M. L., Maxim, P. E. (2020). Simultaneous determination of six Uncaria alkaloids in mouse blood by UPLC-MS/MS and its application in pharmacokinetics and bioavailability. BioMed Research International, 2020, 1–11. DOI 10.1155/2020/1030269. 2020. [Google Scholar]
10. González-Ruiz, V., Olives, A. I., Antonia Martín, M. (2015). Core-shell particles lead the way to renewing high-performance liquid chromatography. TrAC Trends in Analytical Chemistry, 64, 17–28. DOI 10.1016/j.trac.2014.08.008. [Google Scholar] [CrossRef]
11. Tanaka, N., Mccalley, D. V. (2016). Core-shell, ultrasmall particles, monoliths, and other support materials in high-performance liquid chromatography. Analytical Chemistry, 88(1), 279–298. DOI 10.1021/acs.analchem.5b04093. [Google Scholar] [CrossRef]
12. Hayes, R., Ahmed, A., Edge, T., Zhang, H. (2014). Core-shell particles: Preparation, fundamentals and applications in high performance liquid chromatography. Journal of Chromatography A, 1357, 36–52. DOI 10.1016/j.chroma.2014.05.010. [Google Scholar] [CrossRef]
13. Li, W. Q., Li, W. J., Qian, Z. M., Chen, S. L., Xiang, L. et al. (2014). Rapid analysis of polar components in Ophiocordyceps sinensis by conventional liquid chromatography system. Chinese Herbal Medicines, 6(3), 217–221. [Google Scholar]
14. Tang, D., Cao, D. M., Tan, L. F., Xu, Y. H., Duan, T. T. et al. (2019). Simultaneous determination of 8 bioactive isoflavonoids in Astragali Radix by UHPLC equipped with core-shell column. China Journal of Chinese Materia Medica, 44(7), 1410–1415. DOI 10.19540/j.cnki.cjcmm.20190118.006. [Google Scholar] [CrossRef]
15. Yan, C. P., Wu, Y., Weng, Z.B., Gao, Q. Q., Yang, G. M. et al. (2015). Development of an HPLC method for absolute quantification and QAMS of flavonoids components in Psoralea corylifolia L. Journal of Analytical Methods in Chemistry, 2015, 23, 1–7. DOI 10.1155/2015/792637. [Google Scholar] [CrossRef]
16. Wang, S. H., Gan, Y. S., Kan, H., Mao, X. X., Wang, Y. S. et al. (2021). Exploitation of HPLC analytical method for simultaneous determination of six principal unsaturated fatty acids in Oviductus Ranae based on quantitative analysis of multi-components by single-marker (QAMS). Molecules, 26(2), 479. DOI 10.3390/MOLECULES26020479. [Google Scholar] [CrossRef]
17. Huang, J., Yin, L., Don, L., Quan, H. F., Chen, R. et al. (2018). Quality evaluation for Radix Astragali based on fingerprint, indicative components selection and QAMS. Biomedical Chromatography, 32(11), e4343. DOI 10.1002/bmc.4343. [Google Scholar] [CrossRef]
18. Cui, K. K., Cao, Y. T., Shao, J. F., Lu, Z. Y., Wang, L. H. et al. (2019). Quantitative analysis of multicomponents by a single marker and quality evaluation of Venenum Bufonis from different geographical origins. Biomedical Chromatography, 33(9), e4555. DOI 10.1002/bmc.4555. [Google Scholar] [CrossRef]
19. Hou, J. J., Wu, W. Y., Da, J., Yao, S., Long, H. L. et al. (2011). Ruggedness and robustness of conversion factors in method of simultaneous determination of multi-components with single reference standard. Journal of Chromatography A, 1218(33), 5618–5627. DOI 10.1016/j.chroma.2011.06.058. [Google Scholar] [CrossRef]
20. Gao, X. Y., Jiang, Y., Lu, J. Q., Tu, P. F. (2009). One single standard substance for the determination of multiple anthraquinone derivatives in rhubarb using high-performance liquid chromatography-diode array detection. Journal of Chromatography A, 1216(11), 2118–2123. DOI 10.1016/j.chroma.2008.11.104. [Google Scholar] [CrossRef]
21. Shi, X. P., Wang, H. T., Yu, F., Chen, C. (2013). Determination of total alkaloids in bitter gourd by potentiometric titration. Food and Fermentation Industries, 39(5), 190–193. DOI 10.13995/j.cnki.11-1802/ts.2013.05.014. [Google Scholar] [CrossRef]
22. Hou, J. J., Feng, R. H., Zhang, Y. B., Pan, H. Q., Yao, S. et al. (2018). Characteristic chromatogram: A method of discriminate and quantitative analysis for quality evaluation of Uncaria stem with hooks. Planta Medica, 84(6–7), 449–456. DOI 10.1055/s-0043-123827. [Google Scholar] [CrossRef]
Cite This Article
 Copyright © 2023 The Author(s). Published by Tech Science Press.
This work is licensed under a Creative Commons Attribution 4.0 International License , which permits unrestricted use, distribution, and reproduction in any medium, provided the original work is properly cited.
 Downloads
 Citation Tools