
 Submit a Paper
 Propose a Special lssue
 Open Access
ARTICLE

Salt Stress Affects the Growth and Yield of Wheat (Triticum aestivum L.) by Altering the Antioxidant Machinery and Expression of Hormones and Stress-Specific Genes
1 Jiangsu Key Laboratory of Crop Genetics and Physiology, Jiangsu Key Laboratory of Crop Cultivation and Physiology, Jiangsu Co-innovation Center for Modern Production Technology of Grain Crops, Research Institute of Rice Industrial Engineering Technology, Key Laboratory of Saline-Alkali Soil Improvement and Utilization (Coastal Saline-Alkali Lands), Ministry of Agriculture and Rural Affairs, Yangzhou University, Yangzhou, 225000, China
2 Joint International Research Laboratory of Agriculture and Agri-Product Safety of the Ministry of Education of China, Yangzhou University, Yangzhou, 225009, China
3 Yibang Agriculture Technology Development Co., Ltd., Dongying, 257000, China
* Corresponding Author: Qigen Dai. Email:
Phyton-International Journal of Experimental Botany 2023, 92(3), 861-881. https://doi.org/10.32604/phyton.2023.025487
Received 15 July 2022; Accepted 09 September 2022; Issue published 29 November 2022
 View Full Text
 Download PDF
Abstract
Understanding physiological responses in saline agriculture may facilitate wheat breeding programs. Based on a screening test, the Ningmai-14 (NM-14) and Yangmai-23 (YM-23) wheat cultivars were selected for further experiments to understand the underlying salinity tolerance mechanism. This study investigated the effects of five salinity levels such as Control (CK) = 0 (without NaCl stress), S1 = 0.20%, S2 = 0.25%, S3 = 0.30% and S4 = 0.35% of NaCl concentrations of soil on wheat plants. The results showed that increased salinity concentration reduced the growth and yield of wheat cultivars (NM-14 and YM-23). However, YM-23 (12.7%) yielded more than NM-14 at maximum salinity stress. The higher salinity (S4) increased the concentration of Na+ (4.3 to 5.8-fold) and P contents (2.5 to 2.2-fold), while reducing the average concentrations of K+, Cu, and K+/Na+ ratio. The higher salinity (S4) reduced the spikelet length by 21.35% (followed by grain spike−1), and the starch content by 18.81%. In the YM-23 cultivar, higher salinity increased superoxide dismutase (SOD), total antioxidant capacity (TAC), and amylase. Compared to NM-14, induced expression of TaYUC2, 6, and TaGA13ox, 20ox genes were recorded in YM-23. Similarly, in YM-23 the stress-specific genes such as TaHSP70, 90 were enhanced whereas, TaSOS1, 2 were suppressed. Overall, our study revealed that salt tolerant cultivars modulate hormonal and antioxidant activities, thus maintaining high growth.
Keywords
Salinity is considered on the top list of environmental stimuli; which directly affect plant growth and development and ultimately yield production [1,2]. Wheat (Triticum aestivum L.) is the most widely grown staple food and ranks first worldwide [3]. Compared to other grains crops, wheat is more vulnerable to salinity stress [4]. The availability of a higher concentration of NaCl triggers Na+ uptake by plants, which alters morpho-physiological and biochemical activity in wheat crops [5,6]. In addition, salinity stress affects the number of leaves, leaf growth, root/shoot ratios, and biomass yield in wheat [7,8]. Previous studies have revealed that a considerable amount of soluble salt in soil affects cell turgor and expansion [9,10], ultra-structural cell components, water uptake, transpiration rate, water retention, and water use efficiency in crops [11,12]. Salt stresses disrupt the ion balance by Na+ influx and K+ efflux while decreasing essential nutrients, especially K+ uptake [13].
The higher concentration of Na+ (>100 mM) effectively inhibits antioxidant enzyme activities [14]. Previous studies showed that about fifty enzymes require K+ as a mediator due to their higher vulnerable capacity to Na+ and Na+/K+ ratio [14,15]. However, the higher concentration of K+ salts inhibits plant enzyme activity [15]. Ion toxicity occurs due to the substitution of Na+ for K+ in biochemical reactions and the conformational changes in proteins caused by Na+ and Cl− [16,17]. Moreover, K+ acts as a cofactor for numerous enzymes and cannot be replaced by Na+ [18]. Increased K+, suppression of Na+, or adjusting the ratios of Na+ and K+ ions promote crop growth and development under salinity by enhancing the transpiration efficiency, potential osmotic management, plant’s antioxidant and immune systems [19,20]. On the other hand, salinity disturbs ion homeostasis by altering the composition of the soil solution with excessive salt ions (e.g., Na+, Cl, Mg2+, and SO42−). In addition, excessive Na+ and Cl− impair nutrient absorption by interfering with the uptake of anions, causing a decrease in K+ absorption and reduced plant growth [21,22].
In cereal crops, salt stress significantly impacts starch synthesis and accumulation. Starch is the most abundant polysaccharide in cereal grains, and development is primarily dependent on photosynthetic bioproducts [23]. Studies represent that salinity increased the gluten content in wheat crops [19,24]. Salinity also significantly increased wet and dry gluten levels [24]. Besides, salinity has a negative impact on wheat yield components, including grain length, fresh weight, grain yield, and nutritional quality, i.e., moisture content, fat content, ash content, fiber, gluten content, and nutrient contents (K+, Fe, P, Zn, and Mg) [25]. Furthermore, salinity also affects the reproductive stage by affecting ion homeostasis, water status and assimilation distribution [26,27].
In plant chlorophylls, high salinity also stimulates the production of ROS, and its excessive accumulation causes oxidative damage to membrane lipids, proteins, and nucleic acids [28,29]. An effective system of non-enzymatic and enzymatic antioxidants is engaged in removing excessive reactive oxygen species (ROS) levels [29]. The enzymatic antioxidants, including superoxide dismutase (SOD), are the initial line of defense against ROS toxicity [30]. SODs convert O2− to H2O2, which is a strong nucleophilic oxidizing agent that can oxidize sulfhydryl groups (SH-groups). Catalase (CAT) and other peroxidases (POD) scavenge the H2O2 produced [31,32]. It also impairs antioxidant efficacy by altering antioxidant enzyme activity such as SOD, ascorbate peroxide (APX), glutathione reductase (GR) as well as non-enzyme antioxidant action [33]. This causes an increase in ROS, Malondialdehyde (MDA), lipid peroxidation, ion leakage, membrane stability, and finally, a deterioration of the antioxidant system [31,34]. The irregular electron transport chain (ETC) generates oxidative stress, which causes lipid peroxidation, protein oxidation, nucleic acid damage, enzyme inhibition, and activation of the programmed cell death pathway, thus causing cell death [35]. Auxin and gibberellic acid (GA) are generally considered growth hormones. Their involvement in plant stress response is not reported extensively. Recent studies showed that auxin plays a central role in the trade-off between plant growth and variable environments via an energy balancing process [36]. Induction in endogenous GA and indole acetic acid (IAA) levels and the expression of auxin and GA biosynthesis genes augmented plant tolerance against environmental stress [37].
To ensure long-term food security, plant biologists must design acceptable frameworks for advancing salt-tolerant wheat cultivars capable of providing a significant yield under saline conditions [38]. To the best of our knowledge, this is the first study that reported salinity stress on highly productive NM-14 and YM-23. We have done a screening test of 87 wheat cultivars under salinity stress. NM-14 displayed better resistance, while YM-23 indicated moderate resistance to salt stress. Therefore, we selected them for further experiments. The main purpose of this experiment was to investigate the underlying salinity tolerance mechanism of NM-14 and YM-23. These two cultivars performed best in Jiangsu province, China and, could be useful for future wheat breeding programs.
2.1 Location, Design, Treatments, and Their Management
The experiment was carried out at the experimental farm of Yangzhou University (33°57′N, 124°24′E), Jiangsu province, China. These areas have an annual average temperature of 15°C, precipitation of 978.4 mm, and average sunlight length of 2177 h. The wheat was sown in the last week of Nov and harvested in the month of May. The experiment was arranged in a randomized complete block design with two factors (salinity and cultivar) and three replications. Four NaCl concentrations, i.e., control (CK) = 0, S1 = 0.20%, S2 = 0.25%, S3 = 0.30%, and S4 = 0.35% of NaCl were used. The two wheat cultivars, Ningmai-14 (NM-14 = moderate-tolerant) and Yangmai-23 (YM-23 = salt-tolerant), were planted in 5.9 square meter plots; each plot was split into two subplots and treated equally. Fertilizers N, P, and K were applied twice (60, 30 and 30 kg ha−1) in each plot using the hand broadcasting method during the sowing and tillering period. The seeds were placed in lines where the row-to-row distance was 20 cm; sown seeds were manually covered with soil. A plastic sheet was installed as a rain shelter to prevent rainfall from altering salt (NaCl) concentrations.
2.2 Agronomic Traits Determinations
Plant growth was measured at wheat maturity stages. Plants from each plot were harvested at the soil level. Four uniform plants were randomly collected to determine plant height (PH) (cm). The PH was measured from the plant base up to the flag leaf tip using a meter rod. The area of a flag leaf was computed using the formula: leaf width (cm) × length (cm) × 0.75 [39]. These plants were then weighed for the total fresh weight (TFW) (g); first, followed by oven drying at 105°C for 30 min and then kept in an oven at 65°C for 48 h to remove the maximum moisture for the total dry weight (TDW) (g). At the harvest stage, the yield components, namely spike length (SpL), single spike weight (SSpW), spikelets per spike (SSp−1), grain per spike (GNSp−1), grain weight spike−1 (GWSp−1), thousand-grain weight (ThGW), and Yield per hectare, (kg) (Y/ha) were determined. Three samples of each treatment were dried in the oven at 65°C for 48 h, then grounded with a grinder and stored for chemical analysis.
2.3 Chlorophyll Contents Determinations
The flag leaves of six plants in each pot were used for chlorophyll contents determination (SPAD values) with a chlorophyll meter (chlorophyll meter SPAD-502 plus, Konica Minolta, Inc., Japan). The SPAD reading was measured at each leaf tip, middle, and base and then averaged [40].
2.4 Wheat Grains Starch and Gluten Determinations
The gluten and starch contents of dry grains were determined. Whole grain was analyzed using a near-infrared spectrophotometer (Infratec 1241 Grain Analyzer; FOSS Tecator AB, Hoganas, Sweden), as described previously [41].
2.5 Wheat Leaf Biochemical Activity Determinations
The activities of SOD, TAC, and MDA, total soluble sugar, and protein in wheat flag leaves were determined using particular measurement kits and following the manufacturer’s recommendations (Suzhou Keming Biotechnology Co., Ltd., Jiangsu, China). From each sample, 0.15–0.2 (g) of wheat fresh leaves were taken, and 1 mL of the required extraction solution was added to the mortar. The leaves were homogenized by grinding them using liquid nitrogen. The supernatant was obtained after centrifugation, and its enzymatic activity was analyzed in line with the instructions of the relevant enzyme kit [42]. At the maturity stage, the concentration of amylase in dried seeds from each treatment was determined [43].
2.6 Leaves and Grains Na+, K +, P, and Cu Contents Determinations
At the harvest stage, dried leaves and grain samples were grounded into a fine powder and then digested with HNO3 and HClO4 (4:1, v/v) in a microwave oven (Mars, CEM Inc., New York, USA). For soil analysis, samples moisture was removed at room temperature, soil was grounded and then sieved with 10-mm mesh and digested with HCl and HNO3 (3:1, v/v) in a microwave oven (Mars, CEM Inc., New York, USA). Finally, sodium (Na+), potassium (K+), phosphorous (P), and copper (Cu) contents were analyzed using inductively coupled plasma atomic emission-spectrometry (Model iCAP 6300, Thermo Fisher Scientific, ICP Spectrometer USA) [44].
2.7 RNA Isolation and cDNA Synthesis
The 28-day-old wheat seedlings were subjected to salinity stress of 0.35%. Samples were collected at 0 (control), 2, 6, and 12 h for total RNA extraction. RNA was extracted using the RNeasy plant mini kit (Qiagen, USA) per the manufacturer’s instructions. The quantity and quality of isolated RNA were determined by spectrophotometry (Nanodrop 2,000, Thermo Fisher Scientific, Waltham, MA, USA) and formaldehyde-based gel electrophoresis. For cDNA synthesis, 1 µg of total RNA was reverse transcribed in 20 µL using Revert Aid First Strand cDNA Synthesis Kit (Fermentas Life Sciences, USA) using oligo (dT) primers as per the manufacturer’s instructions.
2.8 Expression Analysis of Different Genes
To examine the temporal expression patterns of selected genes, qRT-PCR was performed for the samples collected at 0, 6, 24 and 48 h. The qRT-PCR was performed in CFX-96 Real-time PCR Detection System (Bio-Rad, USA). Reactions were conducted in a total volume of 20 μL using 50 ng of cDNA, 10 pmol of forward and reverse primers, and 10 µL of 2x Sso Fast Eva Green qPCR Supermix (Bio-Rad, USA). The cycling conditions were as per the manufacturer’s protocol with a primer-specific annealing temperature. The threshold cycle (Ct) was automatically determined for each reaction using the system set with default parameters. The transcript levels were normalized to Actin transcript and the fold differences of each amplified product in the samples were calculated using the 2−ΔΔCt method. In this study, all primer sequences were designed using the NCBI-Primer blast online tool (https://www.ncbi.nlm.nih.gov/tools/primer-blast/); these sequences are listed in Table 1.
The data collected were arranged and analyzed using Microsoft Excel 2020. Completely randomized design data thus obtained were statistically analyzed for differences between treatment means using IBM SPSS (statistic 25.0). Treatment means were compared using LSD. All figures were prepared by using GraphPad Prism 7.0. Origin Lab (2020, USA) analyzed the scatter matrix plot and Pearson correlation.
3.1 Growth Parameters and Yield Components under Salinity Stress
There were significant differences in growth parameters (P ≤ 0.05) determined among the salinity stresses and cultivars. At higher salinity stress (0.35%) significantly reduced (P ≤ 0.05) the PH (cm), LA (cm2), AGFW (g), and AGDW (g) as compared with their respective control (CK) (Fig. 1). The salinity level (S4) reduced PH by 44.2% and 19.1%, LA by 68.7% and 45.3%, AGFW by 31.0% and 20.5%, AGDW by 39.9% and 37.2%, respectively, in YM-23 and NM-14 cultivars as compared to CK. As compared to CK, the grain per spike (GS−1) and thousand-grain weight (TGW) of NM-14 and YM-23 cultivars were reduced by 62.9% and 45.60%, respectively (Fig. 2). Higher salinity treatment resulted in lower SPL (4.95%), SSpW (23.64%), SS−1 (6.03%), GS−1 (0.12%), GWS (32.27%), TGW (9.86%), and Y/ha (kg) (11.09%) values in the NM-14 cultivar than in the YM-23 cultivar (Fig. 2).
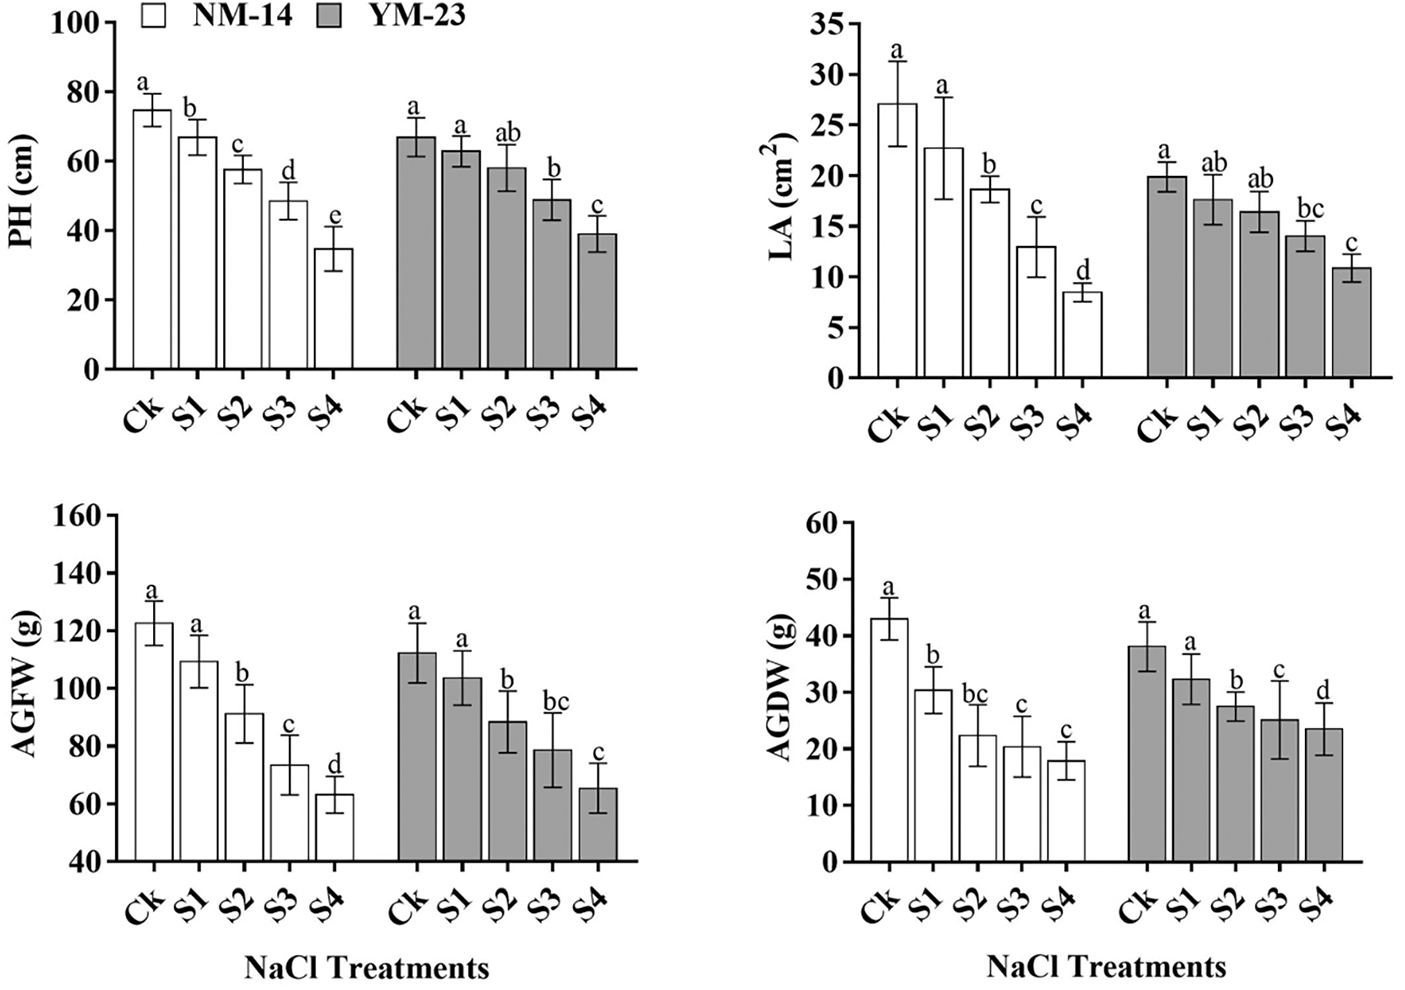
Figure 1: Influence of different salinity levels on plant height (PH), leaf area (LA), above-ground fresh weight, and above ground dry weight. Salinity stresses, i.e., CK, 0.20%, 0.25%, 0.30% and 0.35%. Bars represent means ± SD of three replications (n = 3), Treatments were significantly different at P ≤ 0.05 according to the LSD test. Each group of bars with similar letters represents a non-significant difference
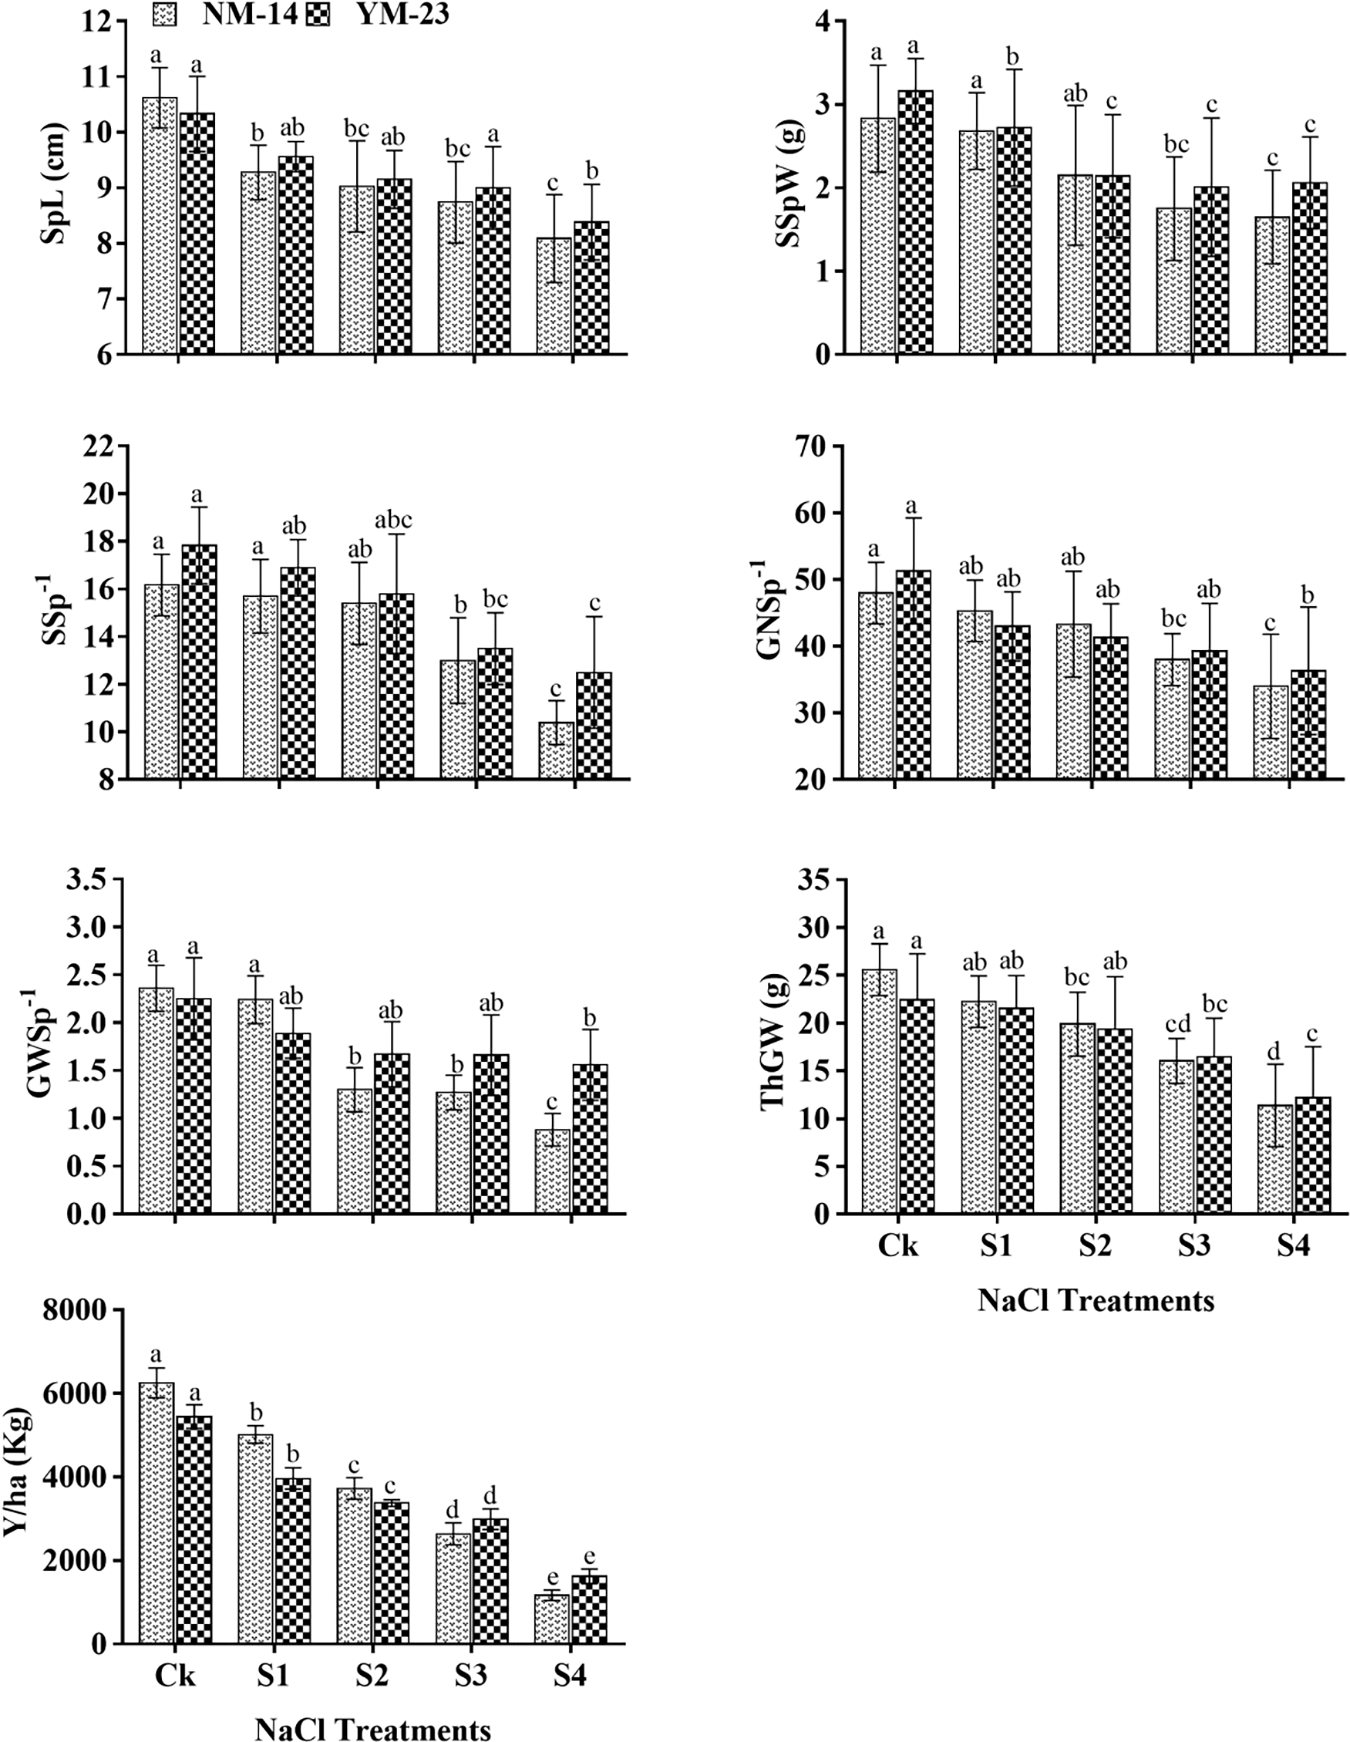
Figure 2: Influence of different salinity levels on spike length (SpL), single spike weight (SSpW), spikelets per spike (SSp−1), grain number per spike (GNSp−1), grain weight spike−1 (GWSp−1), thousand-grain weight (ThGW), and Yield per ha (Y/ha). Salinity stresses, i.e., CK, 0.20%, 0.25%, 0.30% and 0.35%. Bars represent means ± SD of three replications (n = 3); different lower case letters showed a significant difference at P ≤ 0.05 in the same cultivar according to the LSD test
Higher salinity (0.35%) reduced (P ≤ 0.05) the grain per spike (GS−1), although GS−1 was persistent in S2 and S3 treatments. Compared to NM-14, the GS−1 significantly increased in the YM-23 cultivar under the highest salinity level (S4). The increased salinity levels reduced the TGW and yield value in NM-14 and YM-23 cultivars compared to CK (Fig. 2). In CK, the yield of the NM-14 and YM-23 cultivars increased by 2531 and 2205 kg/ha, respectively, when compared to the highest salinity treatment. Furthermore, at S1 and S2 treatments, NM-14 showed maximum yield but at treatments S3 and S4, YM23 showed more reduction in Y/ha than NM-14 cultivar. The yield was significantly reduced by 27.9% at the highest salinity stress (S4) than the control treatment (CK).
3.2 Chlorophyll Contents (SPAD Values)
Salinity stress significantly affected the chlorophyll contents of both cultivars at the flowering stage (FS), anthesis stage (AS) and grain filling stage (GFS), than of the CK (Fig. 3). The chlorophyll contents in the NM-14 cultivar decreased slightly with salinity during the three stages. For instance, chlorophyll contents significantly decreased by 28.7% and 23.52% at FS, 28.73% and 23.9% at AS, and 24.5% and 24.1% in YM-23 and NM-14 cultivars at the highest salinity levels compared with the CK treatments, respectively (Fig. 3). The effect of salinity stress on chlorophyll contents in the YM-23 was greater than in the NM-14 cultivar.
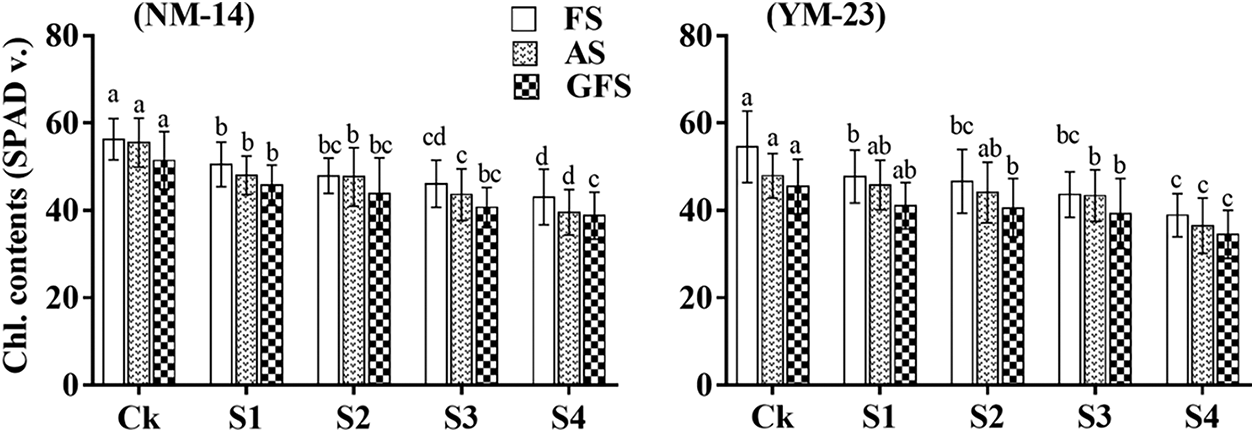
Figure 3: The effects of salt stress on chlorophyll contents of wheat NM-14, YM-23, during flowering stage (FS), anthesis stage (AS) and grain filling stage (GFS). Bars indicate the standard deviation of the three replicates’ mean. The letters represent the significance between different stages and treatments at P ≤ 0.05
3.3 Nutrients Uptake of Na+, K +, P, and Cu in Wheat Leaves and Grains
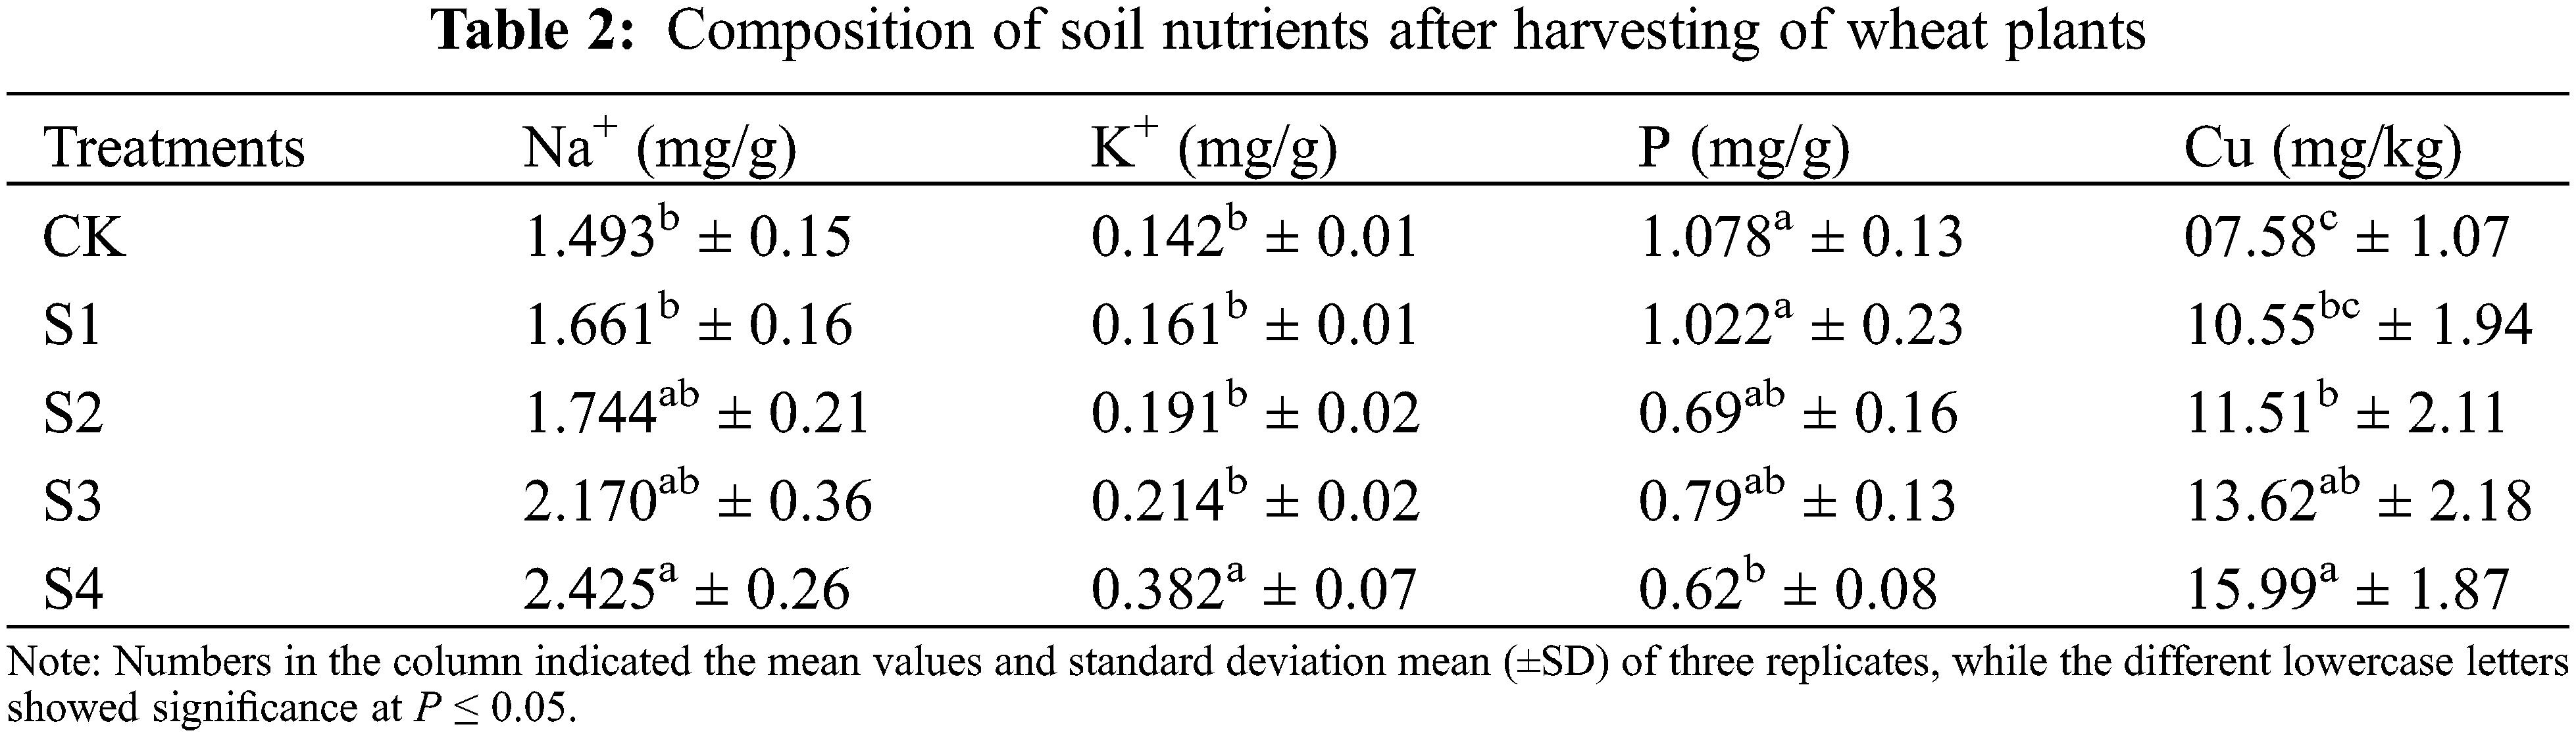
The soil chemical properties of the experimental site are presented in Table 2. At higher salinity stress, soil increased the Na+, K+, and Cu (S4 > S3 > S2 > S1 > CK) contents; moreover the Na+, K+, and Cu had significant difference (P < 0.05), when compared to the CK treatment. At CK, the P content was found significantly higher than S4, but there is non-significant changes among all treatments. Furthermore, the lower P content was found in S4 (P < 0.05), compared to other treatments (Table 2).
The salinity stress significantly (P ≤ 0.05) affected the nutrient absorption, such as Na+, K+, P, and Cu in both wheat cultivars (Fig. 4). The plants under salinity treatments accumulated higher Na+ content as compared to control (CK) treatment. In leaves, the Na+ content increased in the NM-14 cultivar compared to YM-23. However, in grains the Na+ content non-significantly increases in YM-23 compared to the NM-14 cultivar in high salinity stresses (S3 and S4).
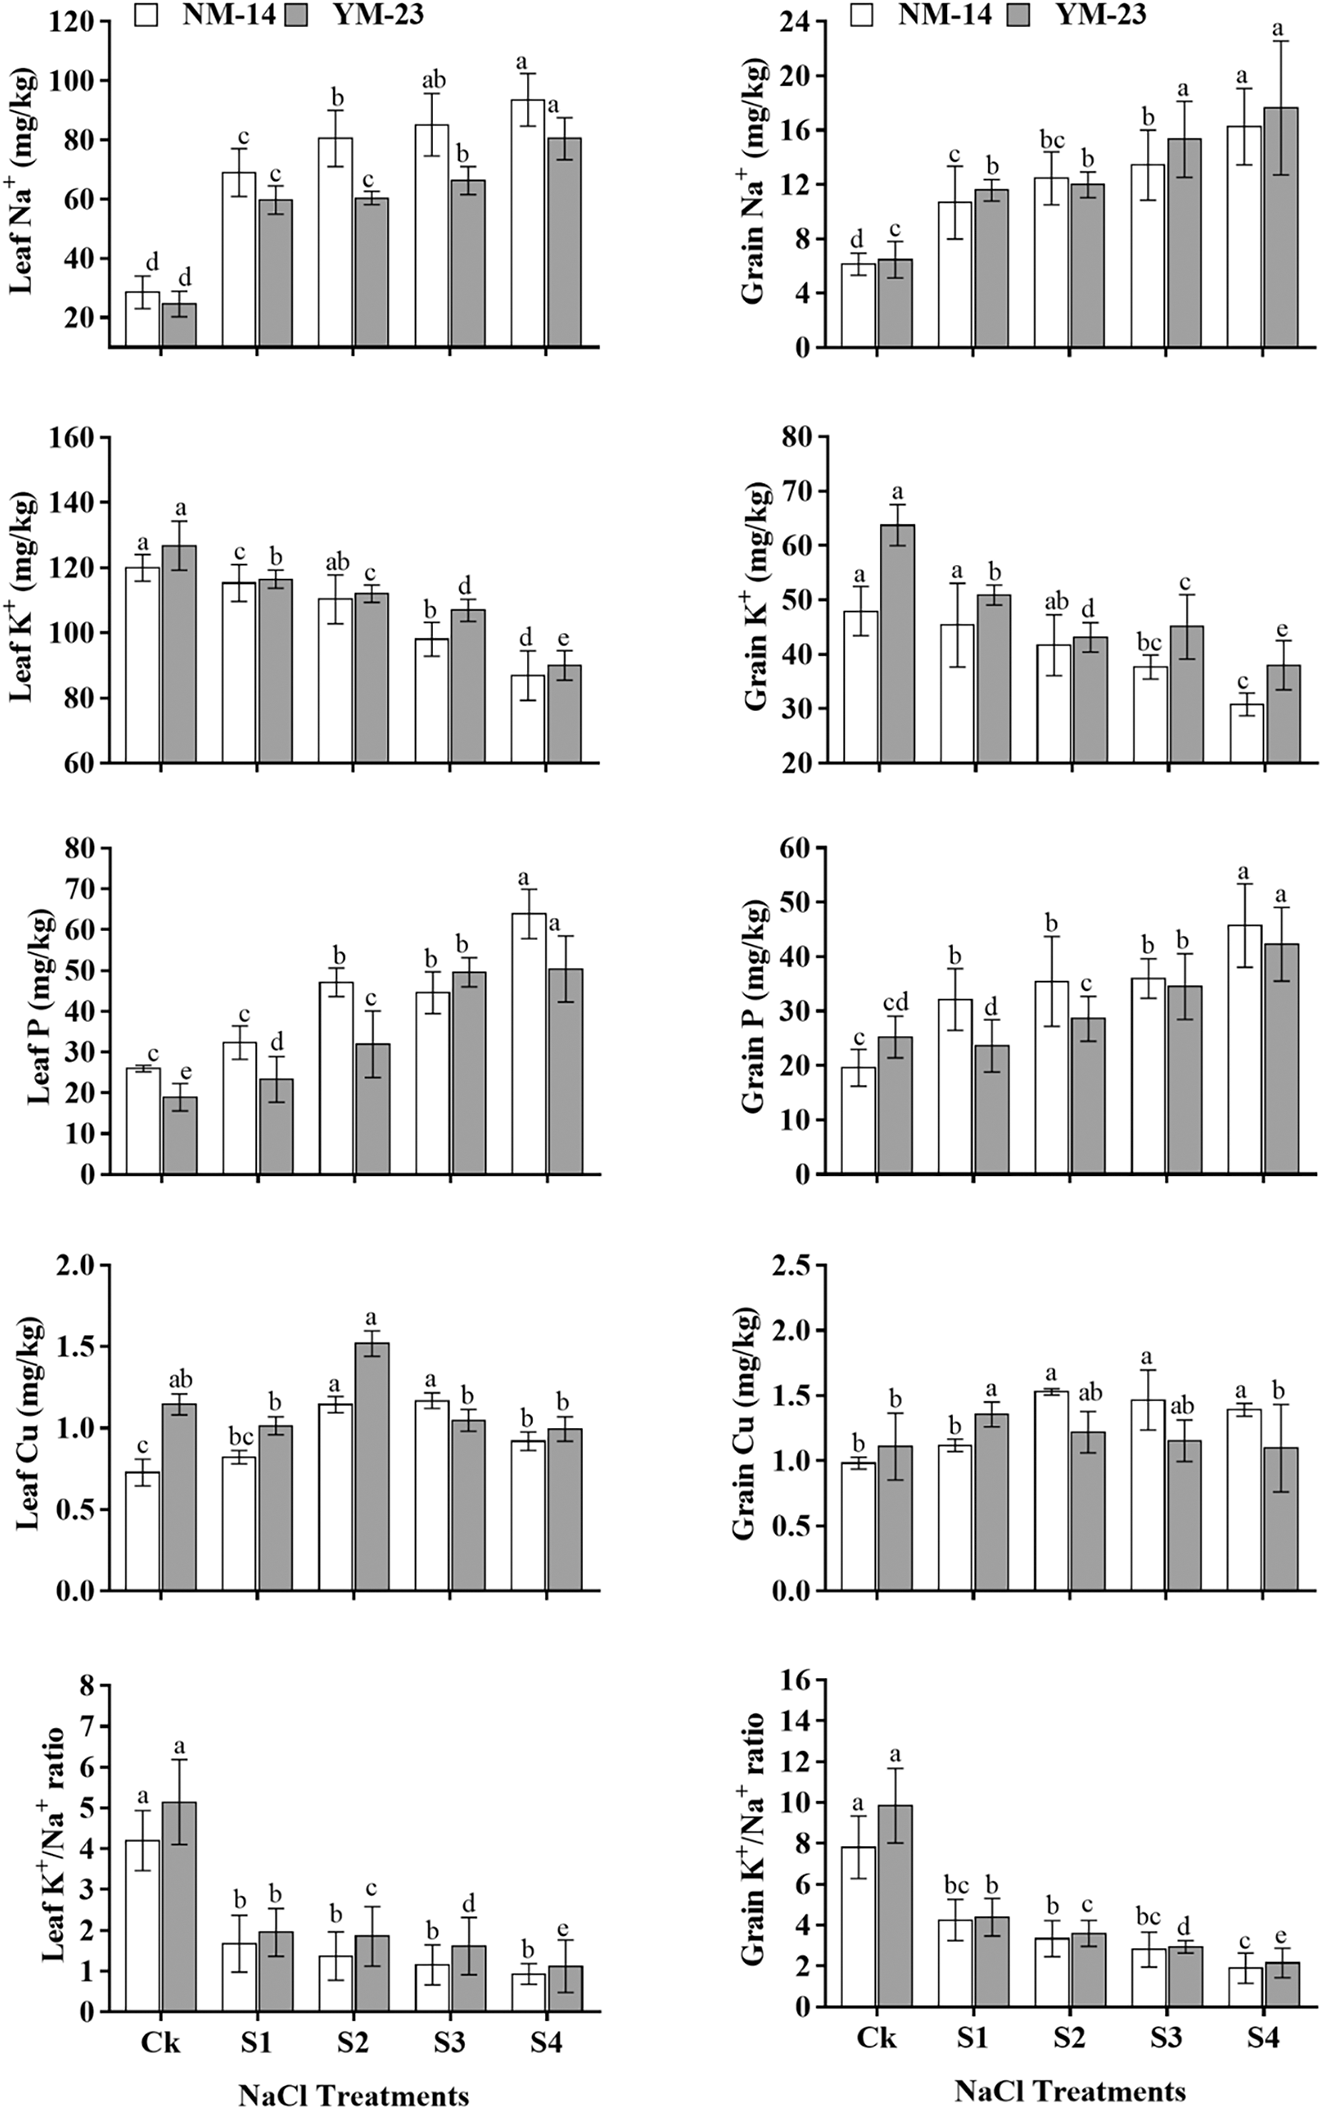
Figure 4: Influence of different salinity stress on Na+, K+, P, Cu concentrations and K+/Na+ ratio in the leaf and grains of two wheat cultivars NM-14 represent = NINGMAI-14 and YM-23 represent = YANGMAI-23, Salinity stresses, i.e., CK, 0.20%, 0.25%, 0.30% and 0.35%. Bars represent means ± SD of three replications (n = 3); lower case showed a significant difference at P ≤ 0.05 in the same cultivar according to the LSD test
Both cultivars accumulated significantly higher K+ content in lower salinity levels, while in higher salinity, K+ content was significantly lowered in both parts of the wheat (Fig. 4). The cultivar YM-23 has the highest contents of grain K+ in S1, followed by the S2 and S3, while the S4 has the lowest content. In NM-14 the grain K+ contents range as: S4 > S3 > S2 > S1 > CK (Fig. 4). In contrast to the accumulation of Na+, the ratio of K+/Na+ in leaves in both cultivars increased in CK (Fig. 4). Under higher salinity (S4), the P content was significantly higher in NM-14 leaf, followed by the S3, as compared with CK. The P content in S4 treatment significantly increased in grain, than of the CK.
At higher salinity stress (T4), the YM23 significantly increased the P content compared to NM-14 but was found non-significant in S3 and S4 treatments in the leaves and grain compared to the CK. As shown in Fig. 4, the maximum Cu content was found in the treatment S2 of the cultivar NM-14, while in YM-23, Cu content in the leaf significantly increased at S2 and S3 compared to CK, S1 and S4 (see Fig. 4). Under higher salinity stress (S4), Cu accumulation in both cultivars was significantly affected in the leaf, but the grain of YM-23 was non-significant compared to CK. Under salinity stresses, the K+/Na+ ratio significantly decreased in the leaf and grain of both cultivars compared to CK. However, the K+/Na+ ratio was reduced in NM-14 and YM-23 cultivars significantly with salinity treatments, compared to control.
3.4 Starch and Gluten Content in Wheat Grains under Salinity Stress
In NM-14 and YM-23 cultivars, the starch and gluten contents increased non-significantly (P ≤ 0.05) at the same salinity stress. However, the gluten was significantly increased, but the starch content was significantly reduced, at higher salinity stress (HSS) (T4), compared to CK. A substantial reduction in grain starch was detected as the concentration of NaCl increased from low (0.20%) to high (0.35%). In NM-14 and YM-23 cultivars, the starch content was reduced by 14.8% and 24.3%, respectively, compared with the CK. As shown in Fig. 5, as salinity increased, the gluten content in NM-14 and YM-23 increased by 32.07% and 36.56%, respectively (under HSS treatment).
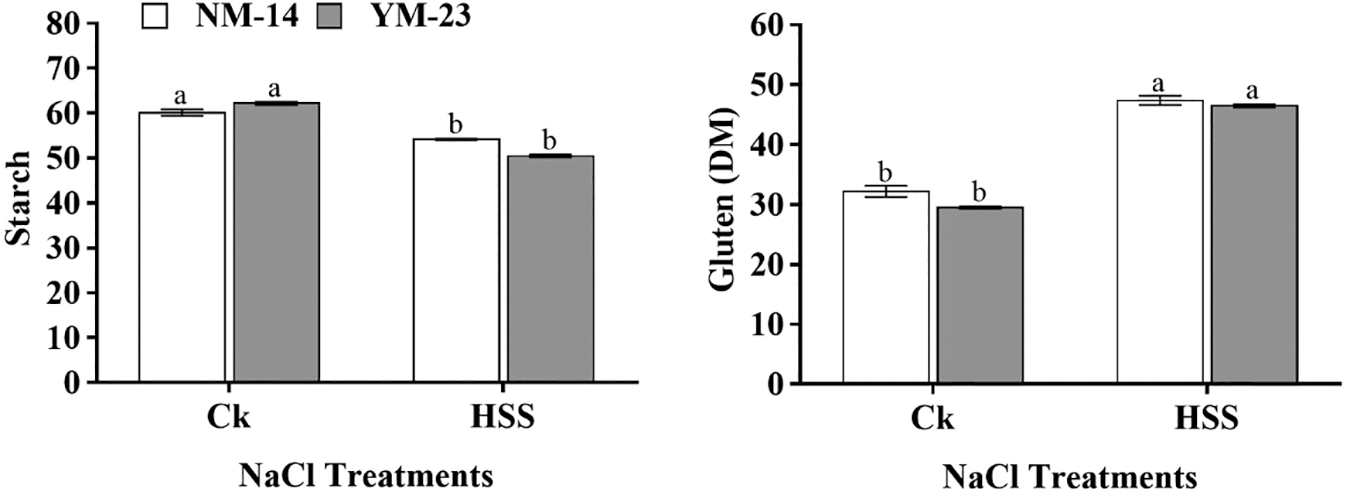
Figure 5: Influence of different salinity levels (CK = control and HSS = High salinity stress) on starch and gluten content of mature wheat grains. Bars represent the means ± SD of three replications (n = 3). Treatments were significantly different at P ≤ 0.05 according to the LSD test. Different lower cases showed significant differences at P ≤ 0.05 in the same cultivar according to the LSD test
3.5 Influence of Salinity Stress on Biochemical Activities
At all salinity stresses, the SOD activity was found higher in YM-23 than in NM-14 (declined by 64.5%) cultivar (Fig. 6). The cultivar NM-14 revealed more TAC activities under all imposed salinity stresses. At higher salinity stress (S4), TAC activity significantly increased compared to CK. As the salt stress increased, the TAC activity increased from 10.42 to 14.20 in NJ9108 and 7.68 to 11.79 in the XD22 cultivar. On the other hand, with salinity stress (S3), MDA level decreased significantly (by 54.7%) in the YM-23 cultivar as compared to CK. However, in NM-14, the MDA levels were found non-significant, while in YM-23 were significantly decreased at S3 salinity stress (Fig. 6).
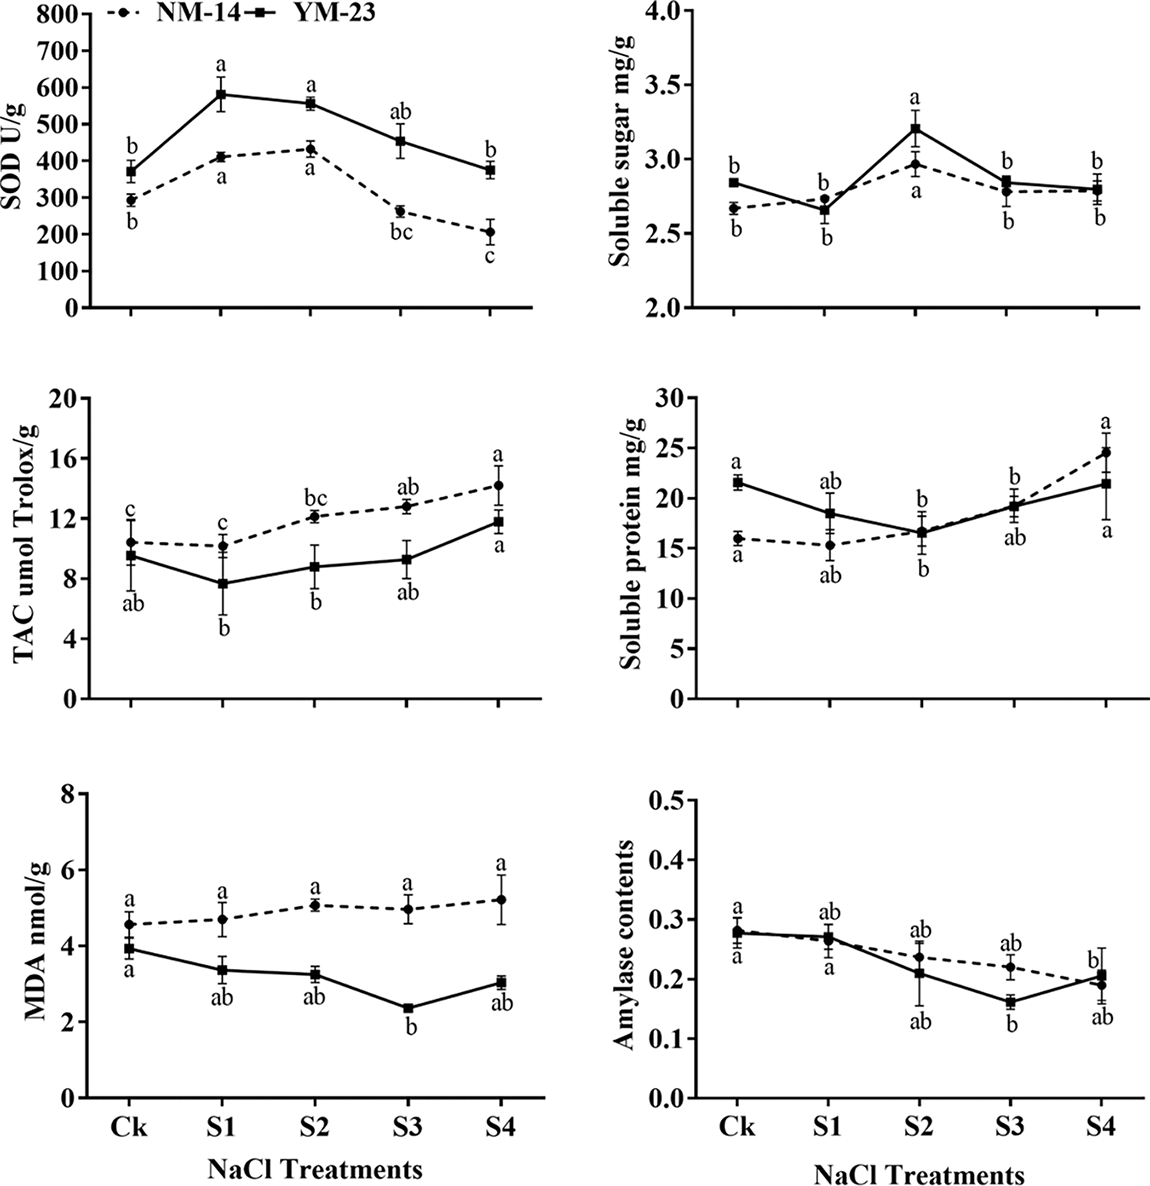
Figure 6: Influence of NaCl on malondialdehyde (MDA), superoxide dismutase (SOD), total antioxidant capacity (TAC), soluble sugar, protein and amylase content of leaves of NM-14 and YM-23. The result is the means of three replicates. Lines indicated the mean, and the lower case showed a significant difference at P ≤ 0.05 within each cultivar according to the LSD test
At lower salinity (S1) treatment, soluble sugar contents in both cultivars decreased compared to CK. However, at the S2 treatment, the sugar level increased significantly but again decreased with increasing the salinity stress in both cultivars. The soluble protein content was significantly reduced in both cultivars only under the S2 treatment compared to other treatments, in both cultivars. In CK and S4 treatments, a non-significantly (P ≤ 0.05) increase was found, while only showed a significant sugar content in the S2 treatment, in both cultivars, compared to other treatments (Fig. 6). The lower amylase content was found in YM-23 at all treatments than NM-14 cultivar, except in S4 treatment. Furthermore, the highest amylase contents were determined in NM-14 and YM-23 under control conditions, while in NM-14 and YM-23a significant reduction was found in the S3 and S4 treatments (Fig. 6).
3.6 Expression Analysis of Hormonal Genes
Gene expression analysis of auxin and gibberellic acid (GA) biosynthesis genes was performed. Leaf samples were taken from the wheat plants cultivars (NM-14 and YM-23) subjected to salinity stress. Compared to the NM-14, the TaYUC2 gene induced relatively higher at all the time points except 48 h in the YM-23. The TaYUC6 gene triggered significantly in the YM-23. At 24 and 48 h, the expression of TaYUC6 increased more than 30 folds in the YM-23 than NM-14.
Similarly, the GA biosynthesis genes showed varied expression responses in both cultivars under salinity stress. The gene TaGA13ox displayed enhanced transcriptional activity in YM-23 than NM-14. The highest expression of TaGA13ox was recorded at 24 h where it peaked at 9 folds in YM-23. Similarly, the TaGA20ox gene showed dominant expression in YM-23. The mRNA level of TaGA20ox rose to its maximum (6 folds) at 48 h in YM-23. The lowest expression of TaGA20ox was observed at 24 h in the NM-14 (Fig. 7).
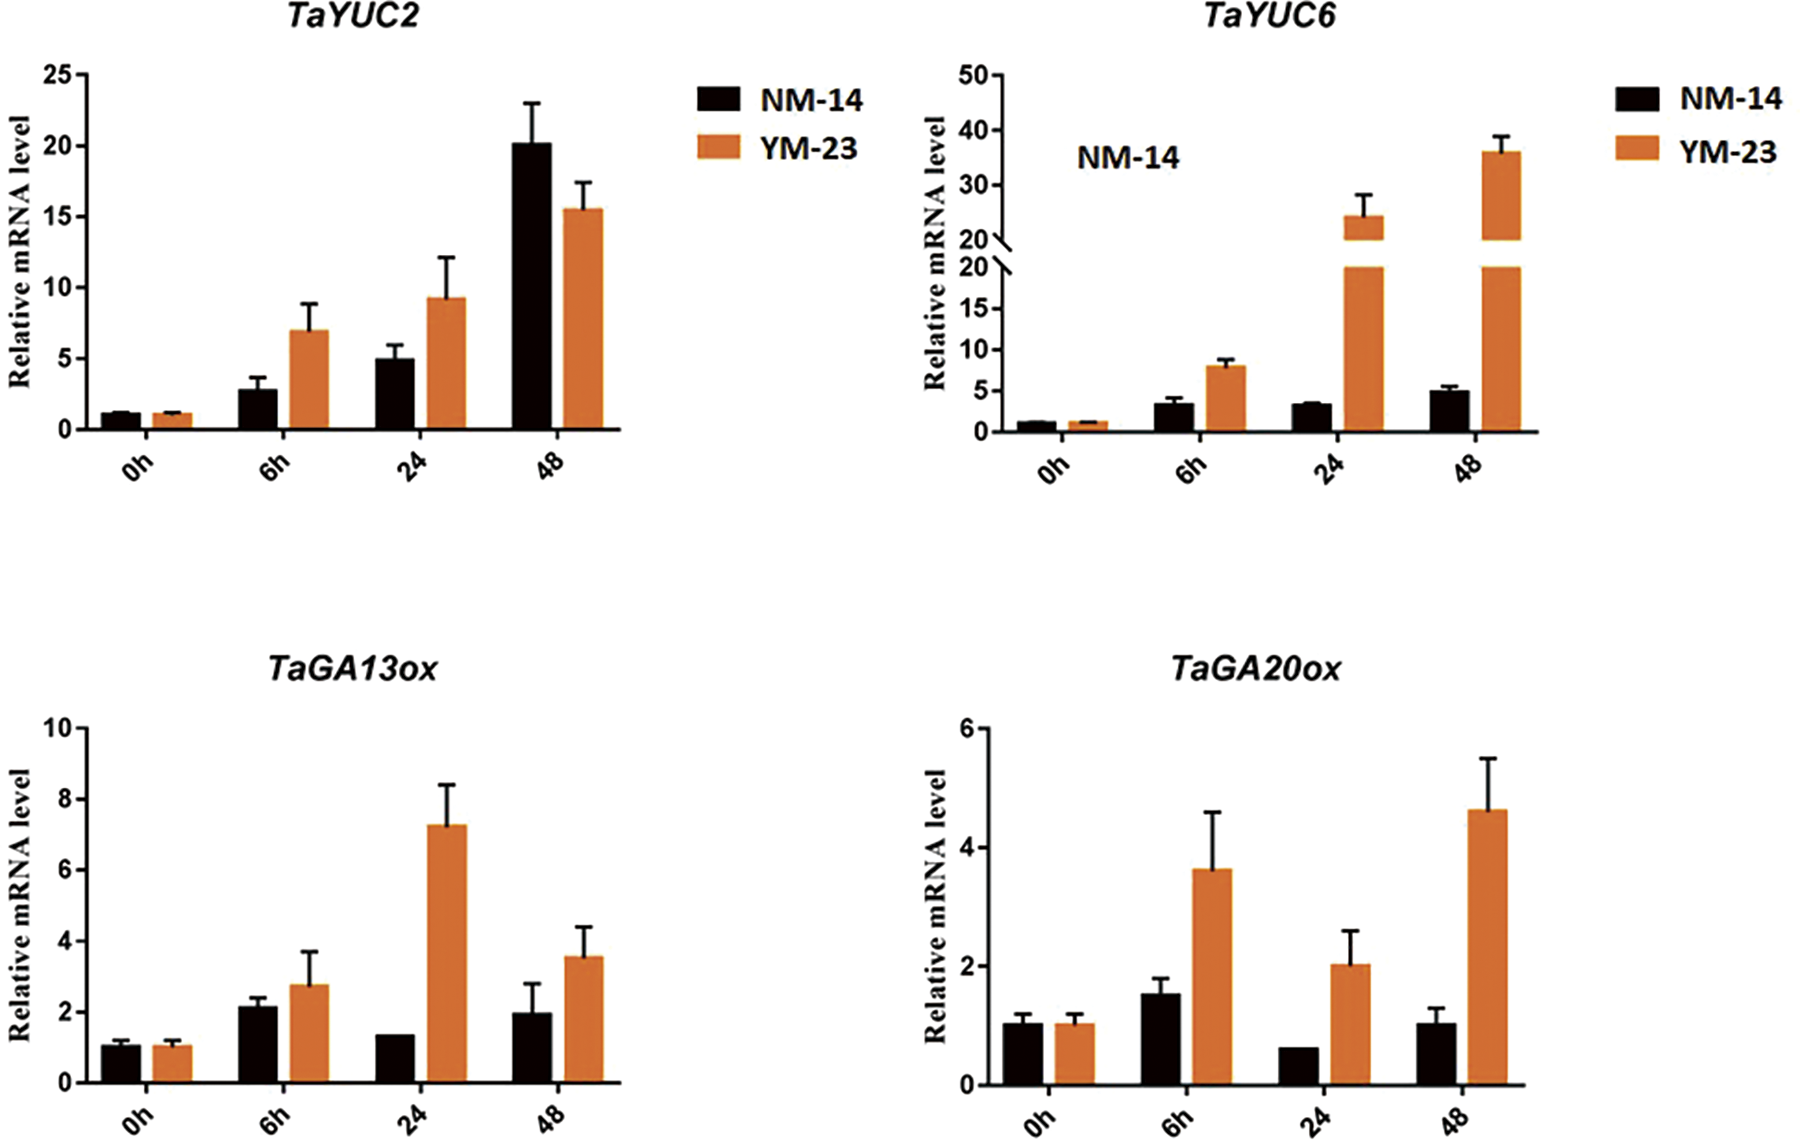
Figure 7: Expression analysis of TaYUC2, 6 and TaGA12ox, 20ox in the NM-14 and YM-23 cultivars under salinity stress
3.7 Expression Analysis of Stress-Specific Genes
The expression of stress-specific genes was analyzed to further understand the response of NM-14 and YM-23 wheat cultivars to salinity stress. The gene TaHSP70 increased 5 folds at 6 h in NM-14 and YM-23. The sharp increase in the expression of TaHSP70 was only observed at 48 h in the YM-23 where it reached a maximum of 73 folds. The TaHSP90 displayed a dominant expression pattern at 24 h in the YM-23 than NM-14. The lowest transcriptional activity of TaHSP90 was recorded at 6 h in the NM-14 cultivar.
The salt overly sensitive (SOS) genes are specific salt stress-responsive genes and therefore it is important to analyze their expression. Herein, the gene expression of TaSOS1 was analyzed. The highest expression of TaSOS1 was noted at 48 h (8 folds) in the NM-14 cultivar. The lowest transcription activity of TaSOS1 was observed in the YM-23 at 24 h. Similarly, an increased expression pattern of TaSOS2 was observed at 6, 24, and 48 h in the NM-14 than YM-23. The mRNA level reached a maximum of 30 folds at 48 h in the NM-14 (Fig. 8).
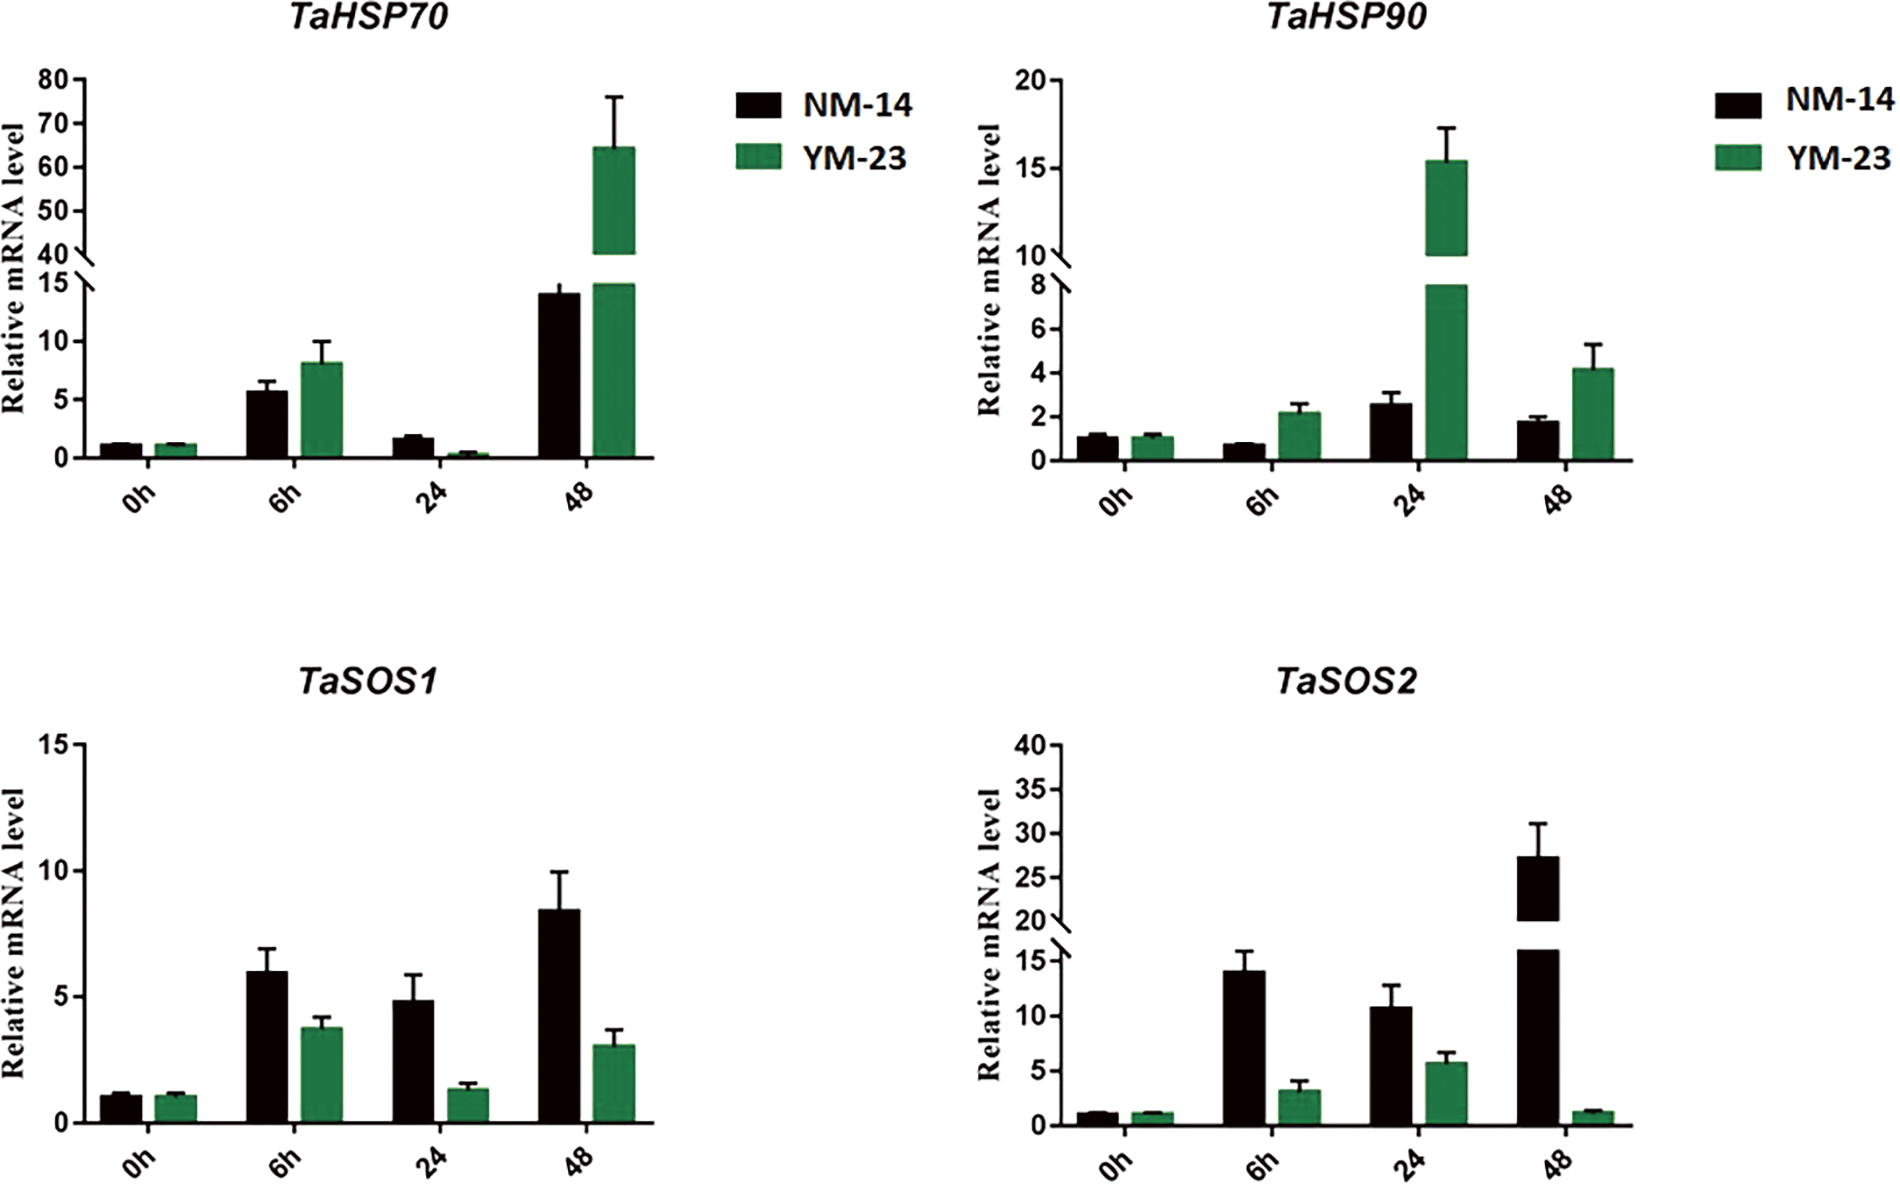
Figure 8: Expression analysis of TaHSP70, 90 and TaSOS1, 2 in the NM-14 and YM-23 cultivars under salinity stress
Wheat yield is the result of combining yield components that depend on the production capacity of photosynthetic materials, the functioning and distribution of chlorophyll content, nutrient uptake, and biochemical changes in the wheat crop [45–47]. Our study also showed a strong negative correlation between the salinity and Na+ content in leaves and grains tissue, which leads to a reduction in plant height, leaf area, and fresh and dry weight in both wheat cultivars (Figs. S1 and S2). The adverse effects of salt stress on dry shoot weight may be attributed to the adverse impact on photosynthesis [48,49].
The physiological and metabolic changes are the primary cause of grain yield reductions [50]. For instance, salinity stress at various stages, i.e., anthesis, booting and filling causes a reduction in grain yield by 39.1%, 24.4% and 13.4%, respectively [7]. In our study, salinity caused a significant (P ≤ 0.05) reduction in yield components in both wheat cultivars (Fig. 2). Accordingly, pre- and post-anthesis at 200 mM NaCl stress reduced biomass yield, ear plant−1, ear weight, and grain plant−1 [51]. Salinity also negatively influenced the spike growth and their developments, leading to yield reduction [52,53]. Similarly, our results supported previously [54,55], showed a diminishing in the numbers and length of spikes and grains per spike under salinity treatments, ultimately leading to a notable reduction in wheat yield. Additionally, our study agrees with multiple results [18,52,55], they stated that salinity is toxic to plant development and can significantly hamper the overall yield by negatively impacting the reproductive stage.
Salinity stress subjugates the number of productive tillers [33], spikelet numbers, grain yield per plant, and total grain yield [8,56]. In addition, grain dry matter and K+/Na+ ratios under salt stress showed a significant correlation, the same correlation as our present study (Figs. S2 and S3), and regulation of grain filling rate and duration [57]. Our findings show that high salinity declined the yield by 81.27% and 70.17%, respectively, than CK (Fig. 2). Our findings align with [58], who discovered that increasing salt stress reduced wheat yield by up to 45% more than non-stress conditions.
Our results indicated, Figs. S1 and S3, that the NaCl treatments are negatively correlated to K+ and K+/Na+ ratio in both parts of wheat (leaves and grain). Furthermore, previous results demonstrated that the nutritional quality traits of the nutrient content, i.e., K+, Ca, Fe, P, Zn, and Mg, and also the gluten content, moisture, fat, ash, and fiber of the wheat crop have been affected by higher salinity stress [25]. Under stress condition (200 mM NaCl), the contents of Na+, K+, and Ca increased by 15.5%, 10%, and 20% in wheat, respectively [53]. Our results also confirmed that an increase in the salinity stress might exploit Na+ contents and decline the K+ and Na+/K+ ratios. The significant correlation between salinity and Na+/K+ contents confirms that salinity affects the Na, P, and Na+/K+ ratio in both cultivars in leaf and grains (Fig. 4, and Fig. S1). The current results are inconsistent with other researchers [59,60], who reported that the NaCl compartmentalization enriches the Na+ contents in the growth medium compared to non-salinity, at hydroponic as well as in soil medium. In conclusion, an imbalance in nutrient flows eventually disrupts the physiological and biochemical activities, negating the assumed growth and yield per unit area [49,61,62].
Salinity stress reduces yield and quality, impairs ion homeostasis, alters water status, and interferes with zoning during the reproductive phase. Salt stress alters cellular ion homeostasis by raising Na+ and reducing Cu and K+. High-affinity K+ transporter (HKT) has recently been involved in excluding Na+ from leaf blades during the reproductive stage, persuading sodium ion homeostasis under salt stress [63,64]. Our research shows that P and Cu play an essential role in plant growth and development, and the content of P increases with the increase of salinity. Additionally, with increasing salinity stress inconsistent uptake of Cu content was observed in both cultivars and both parts of wheat. The above statement agrees with the previous findings [60,65], which observed that the salinity increments significantly enhanced the Cu contents at 4 dS/m (S4) compared to the control treatment. Similarly, Florence et al. [66] previous results found that the increase of salinity increases the Cu content in macroalga. Furthermore, salinity can affect nutrient intake, specifically P, Cu, and Zn, by reducing water and nutrient uptake while enhancing Na+ and Cl absorption [67].
Under high salinity conditions (S4), the SOD and TAC activities were influenced, where these activities founded to be higher in YM-23 than NM-14 cultivar, as indicated in Fig. 5. Correspondingly, it is concluded that, in root tissues, SOD activity was exceeded with severe salinity stress [68]. Moreover, SOD activity in the upper four leaves was not significantly affected than other leaves by salinity stress. It has also been reported that the SOD activity within salinity-tolerant rice cultivars was more significant in the leaves than in salt-sensitive cultivars [69]. On the other hand, Calendula officinalis leaves exhibited SOD activity when exposed to salt than control [69].
However, we also noticed a similar decreasing trend in the SOD activities in the moderate cultivars as in the sensitive cultivars. Our findings agree with those results [69] found that increasing salinity caused a concentration-dependent increase in the TAC of leaves 1 and 2. Under severe salinity stress, root and samples from the 3rd and 4th leaf were less responsive, with only a slight increase in TAC. Furthermore, our findings reveal that TAC increases in response to salt stress and depends on varying cultivars, even when subjected to the same treatment, such as CK. The present study revealed that salt stress and MDA levels were positively correlated in cultivar NM-14 but not in YM-23 cultivars; YM-23 had the lowest MDA level (54.73%) compared to CK (Fig. 6). Higher salt (NaCl) concentration increased the MDA level significantly (P ≤ 0.05) in the root and 1st and 2nd leaf and reached the maximum value at 150 mM NaCl of leaves 3, 4 [70]. Likewise, Mansour et al. [71] have demonstrated that salinity could significantly increase the MDA level in salt-tolerant genotypes compared to salt-sensitive genotypes.
Auxin and GA are generally considered growth hormones. Their involvement in plant stress response is not reported extensively. Recent studies showed that auxin plays a central role in the trade-off between plant growth and variable environments via an energy balancing process [36]. Induced endogenous GA and IAA levels and the expression of auxin and GA biosynthesis genes augmented plant tolerance against environmental stress [37,72]. Our study achieved similar results as we observed high expression of auxin and GA biosynthesis genes in the NM-14 and YM-23. Compared to NM-14, the expression of TaYUC2,6 and TaGA13,20ox were increased many folds. We speculate that the higher yield of YM-23 compared to NM-14 is because of the increased expression of auxin and GA biosynthesis genes. The HSP genes have been reported for providing a response to multiple stresses, including salt stress [73]. We observed relatively high expression of TaHSP70,90 genes in the YM-23 compared to NM-14. The SOS genes negatively regulate plant immunity to salt stress [74,75]. A bit higher expression of TaSOS1,2 genes was observed in the NM-14 cultivar. The higher and lower expression of TaHSP and TaSOS genes in the YM-23 cultivar could be the reasons behind its better tolerance level to salt stress.
In this study, increased salinity significantly reduced all determined growth and yield components, but increased SOD, MDA, Na+, and gluten contents, respectively. In addition, salinity stress markedly increased the Na+ and P ratio but reduced the K+ and K+/Na+ ratio in leaf and grain in both cultivars. The YM-23 (salt-tolerant) cultivar was more efficient against salinity stress by protecting itself from ion toxicity via augmented SOD levels. Additionally, under salt stress, the NM-14 (moderately sensitive) cultivar retains its higher protein, starch, gluten, K+/Na+ ratio, and thousand-grain yield. The expression of auxin and GA biosynthesis genes displayed higher expression in YM-23 than NM-14. The stress-specific genes also had a more dominant transcriptional level in YM-23 than NM-14. Our study suggests that wheat cultivar YM-23 showed better performance in most assessed attributes in salt-induced stress than the NM-14 cultivar.
Supplementary Materials: The Pearson correlations between salinity levels, leaf and grains nutrients contents (Fig. S1). The Network correlation plot of nutrients and yield traits (Fig. S2), Scatter matrix plots of yield traits (Fig. S3).
Authorship: Participated in experiment design and resources: Q.D and Y.C; supervision and funding acquisition: S.H; Y.C; conceived and designed the study: S.H; wrote the manuscript: S.H; S.L; collected plant and soil samples: S.H and R.Z, analyzed the soil properties and analyzed other samples: Y.W; I.A; resources: S.H; H.H; writing the review and editing: All authors have read and agreed to the published version of the manuscript.
Funding Statement: Authors are gratified to the National Natural Science Foundation of China (32101817), Jiangsu Agriculture Science and this work was funded by the National Natural Science Foundation of China (32101817), Jiangsu Agriculture Science and Technology Innovation Fund (CX(21)3111), the Natural Science Foundation of the Jiangsu Higher Education Institutions (21KJD210001), the Scientific and Technological Innovation Fund of Carbon Emissions Peak and Neutrality of Jiangsu Provincial Department of Science and Technology (BE2022304), and the project funded by the Priority Academic Program Development of Jiangsu Higher Education Institutions (PAPD) for their financial support.
Conflicts of Interest: The authors declare that they have no conflicts of interest to report regarding the present study.
References
1. Fita, A., Rodríguez-Burruezo, A., Boscaiu, M., Prohens, J., Vicente, O. (2015). Breeding and domesticating crops adapted to drought and salinity: A new paradigm for increasing food production. Frontiers in Plant Science, 6, 978. [Google Scholar]
2. Huang, M., Chai, L., Jiang, D., Zhang, M., Zhao, Y. et al. (2019). Increasing aridity affects soil archaeal communities by mediating soil niches in semi-arid regions. Science of the Total Environment, 647, 699–707. [Google Scholar]
3. Giraldo, P., Benavente, E., Manzano-Agugliaro, F., Gimenez, E. (2019). Worldwide research trends on wheat and barley: A bibliometric comparative analysis. Agronomy, 9(7), 352. [Google Scholar]
4. Liu, X., Chen, D., Yang, T., Huang, F., Fu, S. et al. (2020). Changes in soil labile and recalcitrant carbon pools after land-use change in a semi-arid agro-pastoral ecotone in Central Asia. Ecological Indicators, 110, 105925. [Google Scholar]
5. Kundu, P., Gill, R., Ahlawat, S., Anjum, N. A., Sharma, K. K. et al. (2018). Targeting the redox regulatory mechanisms for abiotic stress tolerance in crops. In: Wani, S. H. (Ed.Biochemical, physiological and molecular avenues for combating abiotic stress tolerance in plants, pp. 151–220. Switzerland, Cham: Elsevier Academic Press. [Google Scholar]
6. Nath, M., Bhatt, D., Jain, A., Saxena, S. C., Saifi, S. K. et al. (2019). Salt stress triggers augmented levels of Na+, Ca2+ and ROS and alter stress-responsive gene expression in roots of CBL9 and CIPK23 knockout mutants of Arabidopsis thaliana. Environmental and Experimental Botany, 161, 265–276. [Google Scholar]
7. EL-Sabagh, A., Islam, M. S., Skalicky, M., Ali Raza, M., Singh, K. et al. (2021). Salinity stress in wheat (Triticum aestivum L.) in the changing climate: Adaptation and management strategies. Frontiers in Agronomy, 3, 661932. [Google Scholar]
8. Sorour, S. G. R., Aiad, M. A., Ahmed, A. A., Henash, M. I. A., Metwaly, E. M. et al. (2019). Yield of wheat is increased through improving the chemical properties, nutrient availability and water productivity of salt affected soils in the North Delta of Egypt. Applied Ecology and Environmental Research, 17, 8291–8306. [Google Scholar]
9. EL-Hendawy, S. E., Hu, Y., Schmidhalter, U. (2005). Growth, ion content, gas exchange, and water relations of wheat genotypes differing in salt tolerances. Journal of Agricultural Research, 56(2), 123–134. [Google Scholar]
10. Parihar, P., Singh, S., Singh, R., Singh, V. P., Prasad, S. M. (2015). Effect of salinity stress on plants and its tolerance strategies: A review. Environmental Science and Pollution Research International, 22(6), 4056–4075. [Google Scholar]
11. Arif, Y., Singh, P., Siddiqui, H., Bajguz, A., Hayat, S. (2020). Salinity induced physiological and biochemical changes in plants: An omic approach towards salt stress tolerance. Plant Physiology and Biochemistry, 156, 64–77. [Google Scholar]
12. Hasanuzzaman, M., Alam, M., Rahman, A., Hasanuzzaman, M., Nahar, K. et al. (2014). Exogenous proline and glycine betaine mediated upregulation of antioxidant defense and glyoxalase systems provides better protection against salt-induced oxidative stress in two rice (Oryza sativa L.) varieties. BioMed Research International, 2014, 757219. [Google Scholar]
13. Rahman, A., Nahar, K., Hasanuzzaman, M., Fujita, M. (2016). Calcium supplementation improves Na+/K+ ratio, antioxidant defense and glyoxalase systems in salt-stressed rice seedlings. Frontiers in Plant Science, 7, 609. [Google Scholar]
14. Munns, R. (2006). Approaches to increasing the salt tolerance of wheat and other cereals. Journal of Experimental Botany, 57(5), 1025–1043. [Google Scholar]
15. Greenway, H., Osmond, C. B. (1972). Salt responses of enzymes from species differing in salt tolerance. Plant Physiology, 49(2), 256–259. [Google Scholar]
16. Assaha, D. V., Ueda, A., Saneoka, H., Al-Yahyai, R., Yaish, M. W. (2017). The role of Na+ and K+ transporters in salt stress adaptation in glycophytes. Frontiers in Physiology, 8, 509. [Google Scholar]
17. Benito, B., Haro, R., Amtmann, A., Cuin, T. A., Dreyer, I. (2014). The twins K+ and Na+ in plants. Journal of Plant Physiology, 171(9), 723–731. [Google Scholar]
18. Shrivastava, P., Kumar, R. (2015). Soil salinity: A serious environmental issue and plant growth promoting bacteria as one of the tools for its alleviation. Saudi Journal of Biological Sciences, 22(2), 123–131. [Google Scholar]
19. Rahman, M. A., Chikushi, J., Yoshida, S., Yahata, H., Yasunaga, E. (2005). Effect of high air temperature on grain growth and yields of wheat genotypes differing in heat tolerance. Journal of Agricultural Meteorology, 60(5), 605–608. [Google Scholar]
20. Zhang, X., Shi, Z., Tian, Y., Zhou, Q., Cai, J. et al. (2016). Salt stress increases content and size of glutenin macropolymers in wheat grain. Food Chemistry, 197, 516–521. [Google Scholar]
21. Geilfus, C. M. (2018). Chloride from nutrient to toxicant. Plant and Cell Physiology, 59(5), 877–886. [Google Scholar]
22. Geilfus, C. M. (2018). Review on the significance of chlorine for crop yield and quality. Plant Science, 270, 114–122. [Google Scholar]
23. He, J. F., Goyal, R., Laroche, A., Zhao, M. L., Lu, Z. X. (2013). Effects of salinity stress on starch morphology, composition and thermal properties during grain development in triticale. Canadian Journal of Plant Science, 93(5), 765–771. [Google Scholar]
24. Houshmand, S., Arzani, A., Mirmohammadi-Maibody, S. A. M. (2014). Effects of salinity and drought stress on grain quality of durum wheat. Communications in Soil Science and Plant Analysis, 45(3), 297–308. [Google Scholar]
25. Nadeem, M., Tariq, M. N., Amjad, M., Sajjad, M., Akram, M. et al. (2020). Salinity-induced changes in the nutritional quality of bread wheat (Triticum aestivum L.) genotypes. AGRIVITA, Journal of Agricultural Science, 42(1), 1–12. [Google Scholar]
26. Hasegawa, P. M. (2013). Sodium (Na+) homeostasis and salt tolerance of plants. Environmental and Experimental Botany, 92, 19–31. [Google Scholar]
27. Gardner, W. K. (2016). Sodium, calcium and magnesium ratios in soils of NW Victoria, Australia may restrict root growth and crop production. Journal of Plant Nutrition, 39(9), 1205–1215. [Google Scholar]
28. Kusvuran, S., Kiran, S., Ellialtioglu, S. S. (2016). Antioxidant enzyme activities and abiotic stress tolerance relationship in vegetable crops. In: Abiotic and biotic stress in plants—Recent advances and future perspectives, pp. 481–506. [Google Scholar]
29. Ahmad, I., Zhou, G., Zhu, G., Ahmad, Z., Song, X. et al. (2019). Response of boll development to macronutrients application in different cotton genotypes. Agronomy, 9(6), 322. [Google Scholar]
30. Das, K., Roychoudhury, A. (2014). Reactive oxygen species (ROS) and response of antioxidants as ROS-scavengers during environmental stress in plants. Frontiers in Environmental Science, 2, 53. [Google Scholar]
31. Gill, S. S., Tuteja, N. (2010). Reactive oxygen species and antioxidant machinery in abiotic stress tolerance in crop plants. Plant Physiology and Biochemistry, 48, 909–930. [Google Scholar]
32. Tarchoune, I., Sgherri, C., Izzo, R., Lachaal, M., Ouerghi, Z. et al. (2010). Antioxidative responses of Ocimum basilicum to sodium chloride or sodium sulphate salinization. Plant Physiology and Biochemistry, 48(9), 772–777. [Google Scholar]
33. Abbas, T., Balal, R. M., Shahid, M. A., Pervez, M. A., Ayyub, C. M. et al. (2015). Silicon-induced alleviation of NaCl toxicity in okra (Abelmoschus esculentus) is associated with enhanced photosynthesis, osmoprotectants and antioxidant metabolism. Acta Physiologiae Plantarum, 37(2), 1–15. [Google Scholar]
34. Sairam, R. K., Rao, K. V., Srivastava, G. C. (2002). Differential response of wheat genotypes to long term salinity stress in relation to oxidative stress, antioxidant activity and osmolyte concentration. Plant Science, 163(5), 1037–1046. [Google Scholar]
35. Hossain, M. A., Hoque, T. S., Zaid, A., Wani, S. H., Mostofa, M. G. et al. (2021). Targeting the ascorbate-glutathione pathway and the glyoxalase pathway for genetic engineering of abiotic stress-tolerance in rice. In: Hossain, A. M., Hassan, L., Ifterkharuddaula, K. M., Kumar, A., Henry, R. (Eds.Molecular breeding for rice abiotic stress tolerance and nutritional quality, pp. 398–427. USA, New York: John Wiley & Sons. [Google Scholar]
36. Sharif, R., Su, L., Chen, X., Qi, X. (2022). Hormonal interactions underlying parthenocarpic fruit formation in horticultural crops. Horticulture Research, 9, uhab024. [Google Scholar]
37. Kępczynska, E., Orlowska, A. (2021). Profiles of endogenous ABA, bioactive GAs, IAA and their metabolites in Medicago truncatula Gaertn. non-embryogenic and embryogenic tissues during induction phase in relation to somatic embryo formation. Planta, 253(3), 1–13. [Google Scholar]
38. Kaur, H., Bhardwaj, R. D., Grewal, S. K. (2017). Mitigation of salinity-induced oxidative damage in wheat (Triticum aestivum L.) seedlings by exogenous application of phenolic acids. Acta Physiologiae Plantarum, 39(10), 1–15. [Google Scholar]
39. Quarrie, S. A., Jones, H. G. (1979). Genotypic variation in leaf water potential, stomatal conductance and abscisic acid concentration in spring wheat subjected to artificial drought stress. Annals of Botany, 44(3), 323–332. DOI 10.1093/oxfordjournals.aob.a085736. [Google Scholar] [CrossRef]
40. Ibrahim, M. E., Zhu, X., Zhou, G., Ali, A. A., Ahmad, I. et al. (2018). Nitrogen fertilizer alleviated negative impacts of NaCl on some physiological parameters of wheat. Pakistan Journal of Botany, 50, 2097–2104. [Google Scholar]
41. Sanchez-Garcia, M., Álvaro, F., Peremarti, A., Martín-Sánchez, J. A., Royo, C. (2015). Changes in bread-making quality attributes of bread wheat varieties cultivated in Spain during the 20th century. European Journal of Agronomy, 63, 79–88. DOI 10.1016/j.eja.2014.11.006. [Google Scholar] [CrossRef]
42. Wei, L., Zhao, H., Wang, B., Wu, X., Lan, R. et al. (2021). Exogenous melatonin improves the growth of rice seedlings by regulating redox balance and ion homeostasis under salt stress. Journal of Plant Growth Regulation, 41(6), 2108–2121. [Google Scholar]
43. Wang, L. L., Chen, X. Y., Yang, Y., Wang, Z., Xiong, F. (2016). Effects of exogenous gibberellic acid and abscisic acid on germination, amylases, and endosperm structure of germinating wheat seeds. Seed Science and Technology, 44(1), 64–76. DOI 10.15258/sst.2016.44.1.09. [Google Scholar] [CrossRef]
44. Khan, S., Milham, P. J., Eltohamy, K. M., Jin, Y., Wang, Z. et al. (2022). Phytate exudation by the roots of Pteris vittata can dissolve colloidal FePO4. Environmental Science and Pollution Research, 29(9), 13142–13153. [Google Scholar]
45. Zhang, R., Hussain, S., Wang, Y., Liu, Y., Li, Q. et al. (2021). Comprehensive evaluation of salt tolerance in rice (Oryza sativa L.) germplasm at the germination stage. Agronomy, 11(8), 1569. [Google Scholar]
46. Parida, A. K., Das, A. B. (2005). Salt tolerance and salinity effects on plants: A review. Ecotoxicology and Environmental Safety, 60(3), 324–349. [Google Scholar]
47. Aşık, B. B., Turan, M. A., Çelik, H., Katkat, A. V. (2009). Uptake of wheat (Triticum durun cv. Salihli) under conditions of salinity. Asian Journal of Crop Science, 1, 87–95. [Google Scholar]
48. Borlu, H. O., Celiktas, V., Duzenli, S., Hossain, A., El Sabagh, A. (2018). Germination and early seedling growth of five durum wheat cultivars (Triticum durum Desf.) is affected by different levels of salinity. Fresenius Environmental Bulletin, 27(11), 7746–7757. [Google Scholar]
49. Ahmad, M., Shahzad, A., Iqbal, M., Asif, M., Hirani, A. H. (2013). Morphological and molecular genetic variation in wheat for salinity tolerance at germination and early seedling stage. Australian Journal of Crop Science, 7(1), 66–74. [Google Scholar]
50. Ashraf, M. A., Ashraf, M. (2016). Growth stage-based modulation in physiological and biochemical attributes of two genetically diverse wheat (Triticum aestivum L.) cultivars grown in salinized hydroponic culture. Environmental Science and Pollution Research, 23(7), 6227–6243. [Google Scholar]
51. Eroğlu, Ç.G., Cabral, C., Ravnskov, S., Bak Topbjerg, H., Wollenweber, B. (2020). Arbuscular mycorrhiza influences carbon-use efficiency and grain yield of wheat grown under pre- and post-anthesis salinity stress. Plant Biology, 22(5), 863–871. [Google Scholar]
52. Tareq, M. Z., Hossain, M. A., Mojakkir, A. M., Ahmed, R., Fakir, M. S. A. (2011). Effect of salinity on reproductive growth of wheat. Bangladesh Journal of Seed Science and Technology, 15, 111–116. [Google Scholar]
53. Hasan, A., Hafiz, H. R., Siddiqui, N., Khatun, M., Islam, R. et al. (2015). Evaluation of wheat genotypes for salt tolerance based on some physiological traits. Journal of Crop Science and Biotechnology, 18, 333–340. [Google Scholar]
54. Maas, E. V., Grieve, C. M. (1990). Spike and leaf development of sal-stressed wheat. Crop Science, 30(6), 1309–1313. DOI 10.2135/cropsci1990.0011183X003000060031x. [Google Scholar] [CrossRef]
55. Zhang, R., Wang, Y., Hussain, S., Yang, S., Li, R. et al. (2022). Study on the effect of salt stress on yield and grain quality among different rice varieties. Frontiers in Plant Science, 13, 918460. DOI 10.3389/fpls.2022.918460. [Google Scholar] [CrossRef]
56. Zheng, Y., Xu, X., Li, Z., Yang, X., Zhang, C. et al. (2009). Differential responses of rain yield and quality to salinity between contrasting winter wheat cultivars. Seed Science and Biotechnology, 3, 40–43. [Google Scholar]
57. Poustini, K., Siosemardeh, A. (2010). Ion distribution in wheat cultivars in response to salinity stress. Field Crops Research, 85(2–3), 125–133. DOI 10.1016/S0378-4290(03)00157-6. [Google Scholar] [CrossRef]
58. Ali, A., Basra, S. M. A., Ahmad, R., Wahid, A. (2009). Optimizing silicon application to improve salinity tolerance in wheat. Soil Environment, 28, 136–144. [Google Scholar]
59. Greenway, H., Munns, R. (1980). Mechanisms of salt tolerance in non-halophytes. Annual Review of Plant Physiology, 31, 149–190. [Google Scholar]
60. Lekshmy, S., Sairam, R. K., Kushwaha, S. R. (2013). Effect of long-term salinity stress on growth and nutrient uptake in contrasting wheat genotypes. Indian Journal of Plant Physiology, 18, 344–353. [Google Scholar]
61. Shaki, F., Maboud, H. E., Niknam, V. (2019). Effects of salicylic acid on hormonal cross talk, fatty acids profile, and ions homeostasis from salt-stressed safflower. Journal of Plant Interactions, 14, 340–346. [Google Scholar]
62. Zhou, Y., Tang, N., Huang, L., Zhao, Y., Tang, X. et al. (2018). Effects of salt stress on plant growth, antioxidant capacity, glandular trichome density, and volatile exudates of Schizonepeta tenuifolia Briq. International Journal of Molecular Sciences, 19, 252–267. [Google Scholar]
63. Suzuki, K., Yamaji, N., Costa, A., Okuma, E., Kobayashi, N. I. et al. (2016). OsHKT1;4-mediated Na+ transport in stems contributes to Na+ exclusion from leaf blades of rice at the reproductive growth stage upon salt stress. BMC Plant Biology, 16, 22. [Google Scholar]
64. Hussain, S., Zhang, R., Liu, S., Li, R., Zhou, Y. et al. (2022). Transcriptome-wide analysis revealed the potential of the high-affinity potassium transporter (HKT) gene family in rice salinity tolerance via ion homeostasis. Bioengineering, 9, 410. [Google Scholar]
65. Mardukhi, B., Rejali, F., Daei, G., Ardakani, M. R., Malakouti, M. J. et al. (2016). Mineral uptake of mycorrhizal wheat (Triticum aestivum L.) under salinity stress. Communications in Soil Science and Plant Analysis, 46, 343–357. [Google Scholar]
66. Florence, M., Thomas, J. L., Tommy, L., Mats, B. (2009). Influence of combined changes in salinity and copper modulation on growth and copper uptake in the tropical green macroalga Ulva reticulata. Estuarine, Coastal and Shelf Science, 84, 326–330. [Google Scholar]
67. Daei, G. M., Ardekani, F., Rejali, S., Teimuri, M. M. (2009). Alleviation of salinity stress on wheat yield, yield components, and nutrient uptake using arbuscular mycorrhizal fungi under field conditions. Journal of Plant Physiology, 166, 617–625. [Google Scholar]
68. Chawla, S., Jain, S., Jain, V. (2013). Salinity induced oxidative stress and antioxidant systeminsalt-tolerant and salt-sensitive cultivars of rice (Oryza sativa L.). Journal of Plant Biochemistry and Biotechnology, 22, 27–34. [Google Scholar]
69. Gerona, M. E. B., Deocampo, M. P., Egdane, J. A., Ismail, A. M., Dionisio-Sese, M. L. (2019). Physiological responses of contrasting rice genotypes to salt stress at reproductive stage. Rice Science, 26(4), 207–219. [Google Scholar]
70. AbdElgawad, H., Zinta, G., Hegab, M. M., Pandey, R., Asard, H. et al. (2016). High salinity induces different oxidative stress and antioxidant responses in maize seedlings organs. Frontiers in Plant Science, 7, 276. [Google Scholar]
71. Mansour, E., Moustafa, E. S. A., Desoky, E. S. M., Ali, M. M. A., Yasin, M. A. T. et al. (2020). Multidimensional evaluation for detecting salt tolerance of bread wheat genotypes under actual saline field growing conditions. Plants, 9, 1324. [Google Scholar]
72. Raza, A., Tabassum, J., Fakhar, A. Z., Sharif, R., Chen, H. et al. (2022). Smart reprograming of plants against salinity stress using modern biotechnological tools. Critical Reviews in Biotechnology, 15, 1–28. [Google Scholar]
73. Yer, E., Nurten, B., Mehmet, C., Ayan, S. (2018). Identification and expression profiling of all HSP family member genes under salinity stress in different poplar clones. Gentics, 678, 324–336. [Google Scholar]
74. Ahmad, S., Zhu, H., Chen, Y., Xi, C., Shah, A. Z. et al. (2022). Comprehensive bioinformatics and expression analysis of the tlp gene family revealed its role in regulating the response of Oryza sativa to Nilaparvata lugens, Laodelphax striatellus, and Jinggangmycin. Agronomy, 12, 1297. [Google Scholar]
75. Rolly, N. K., Imran, Q. M., Lee, I. J., Yun, B. W. (2020). Salinity stress-mediated suppression of expression of salt overly sensitive signaling pathway genes suggests negative regulation by Atbzip62 transcription factor in Arabidopsis thaliana. International Journal of Molecular Sciences, 21(5), 1726. [Google Scholar]
Appendix
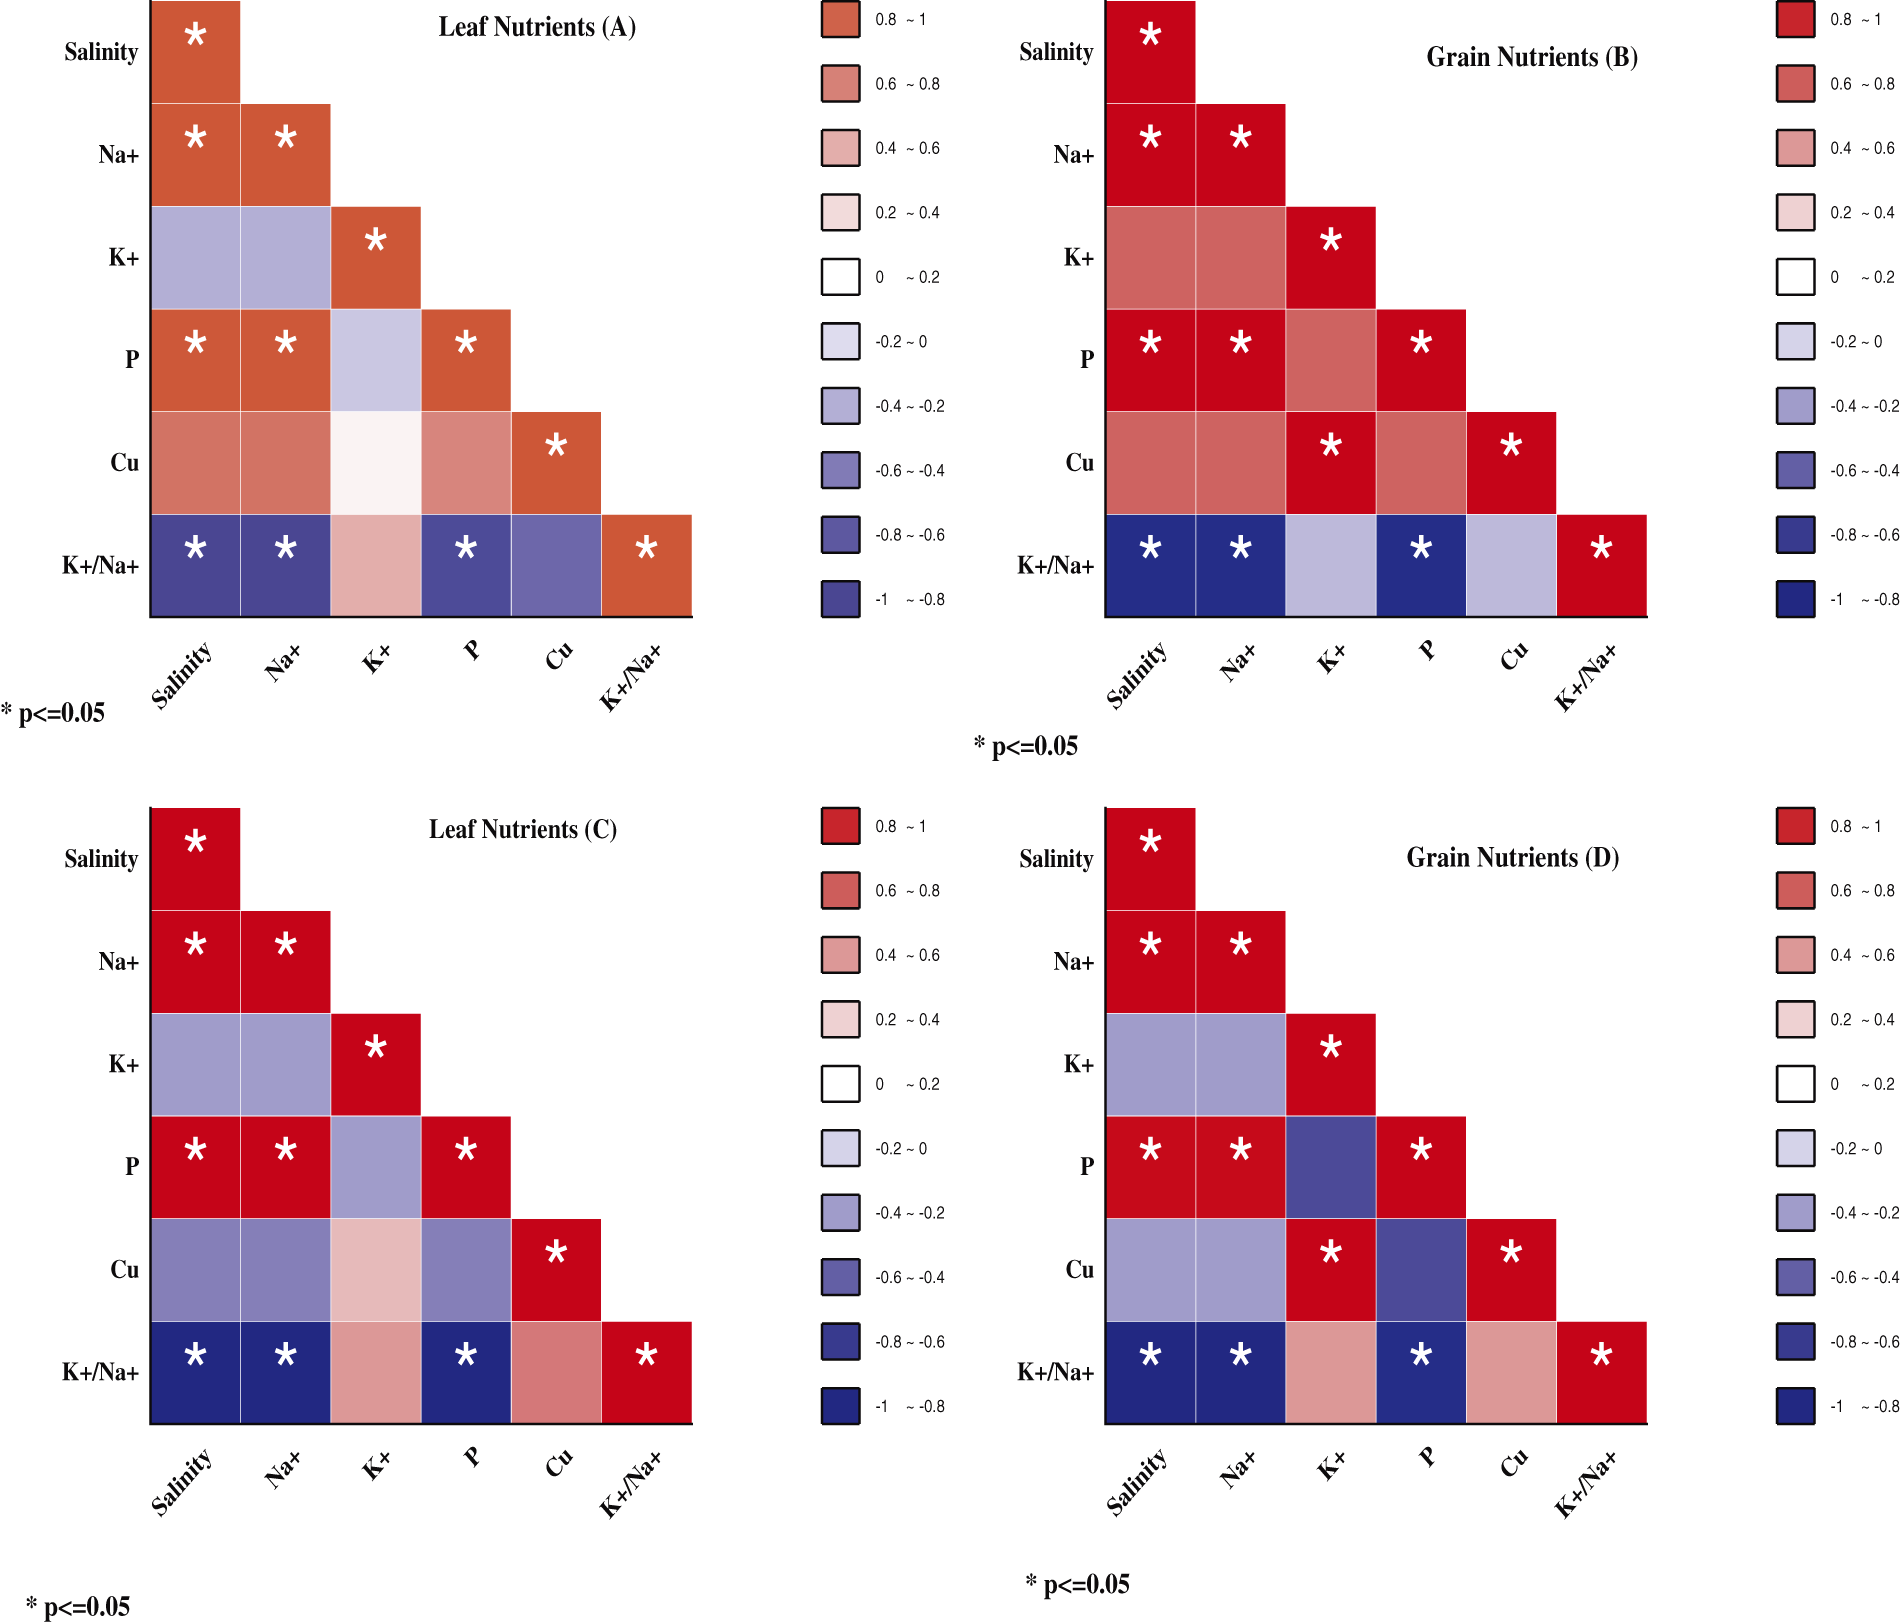
Figure S1: Pearson correlations between salinity levels, leaf and grains of nutrients in NM-14 represent by (A) and (B), whereas the leaves and grain nutrients in YM-23 represent by (C) and (D)
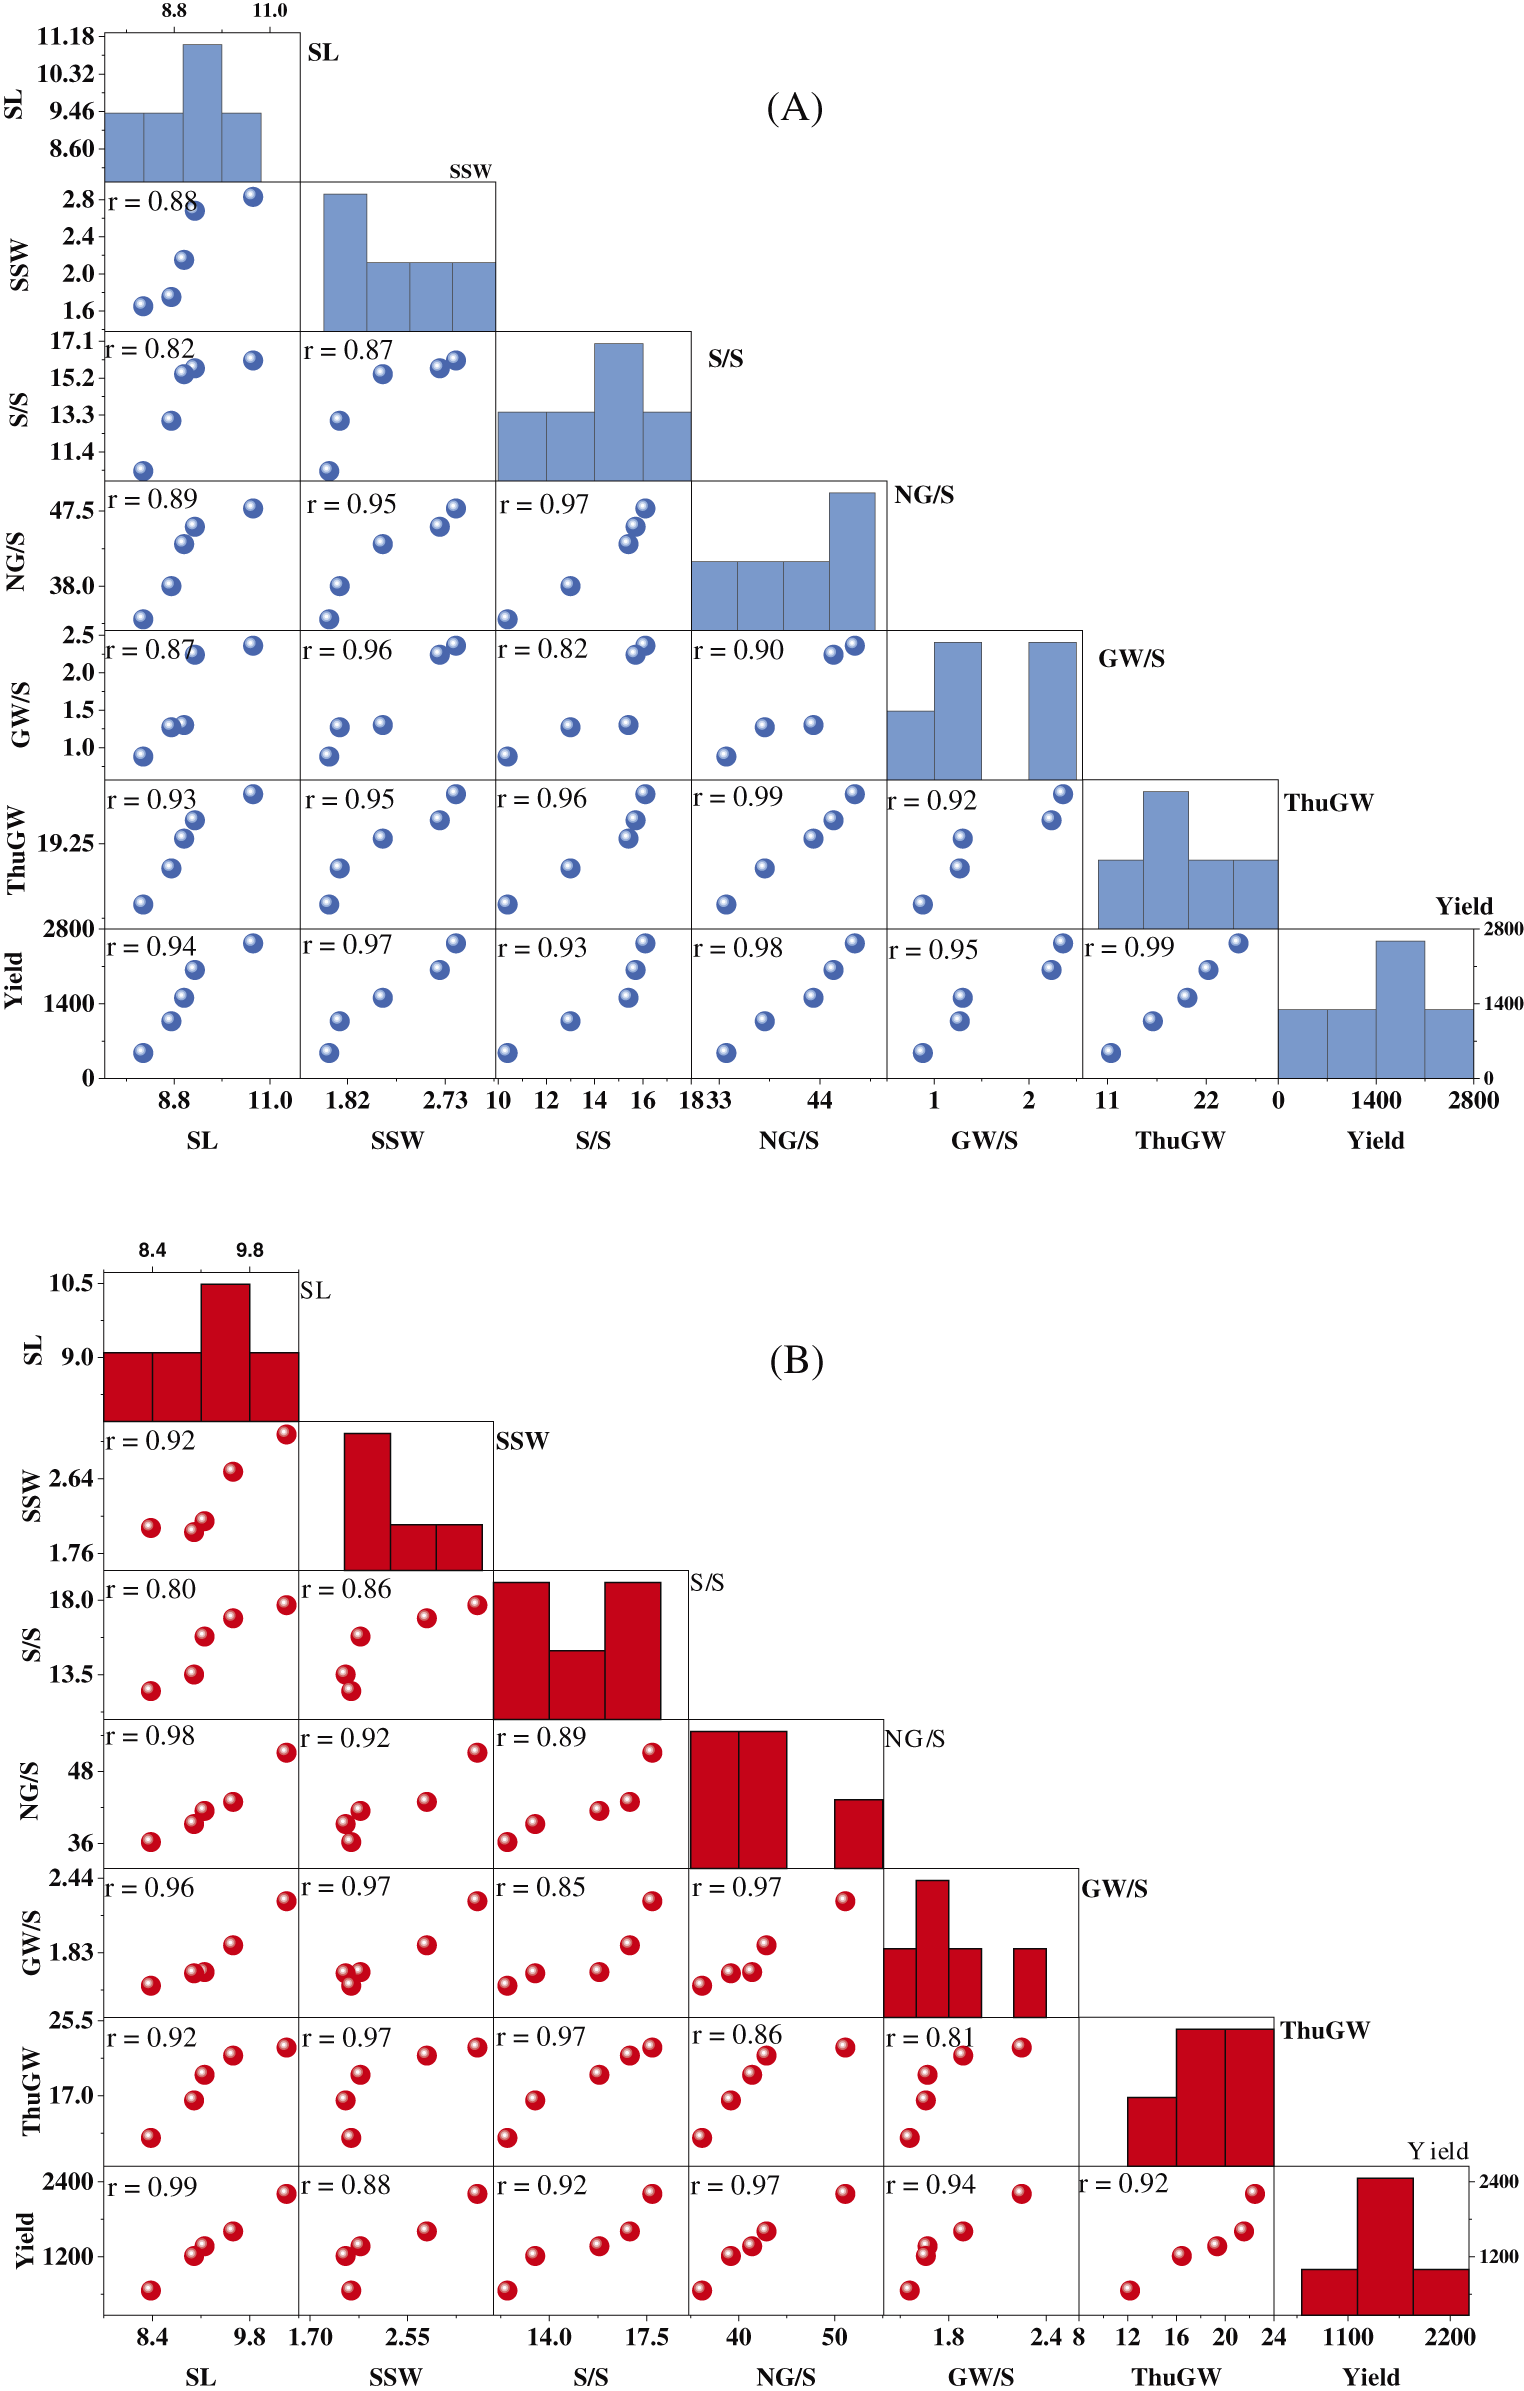
Figure S2: Scatter matrix plots of wheat yield traits under salinity stress, for two rice cultivars NM-14 (A) and YM-23 (B)
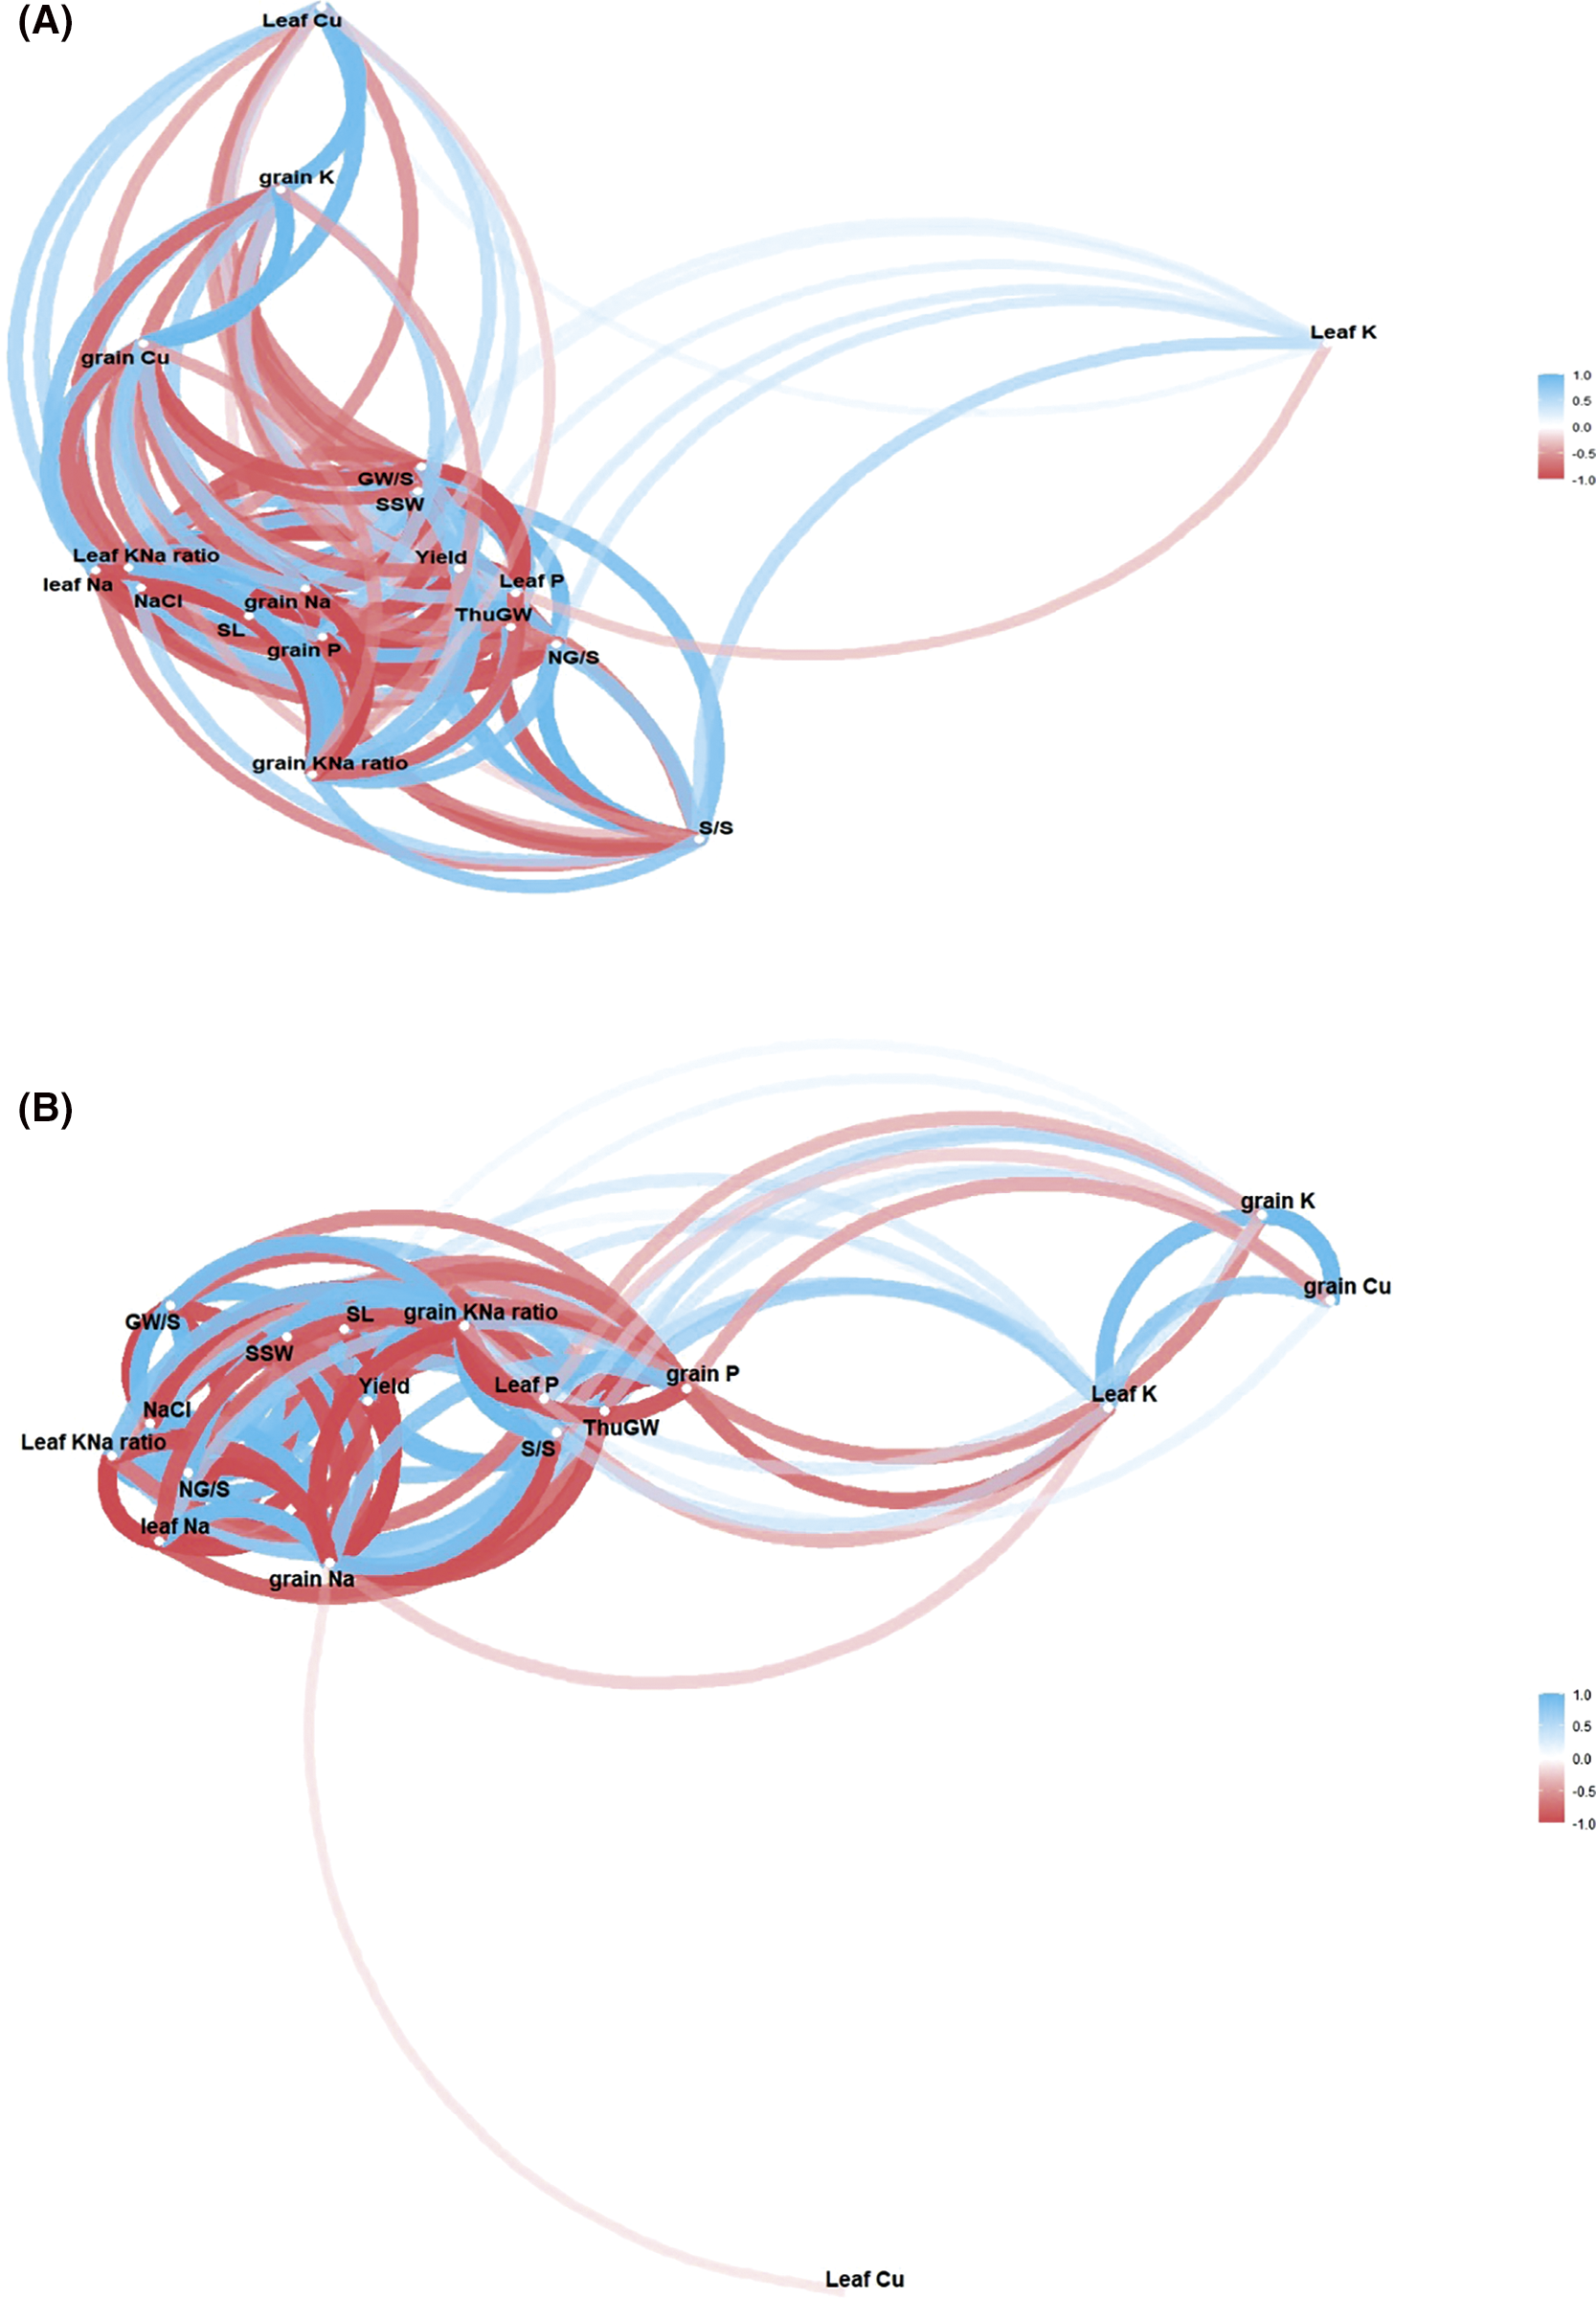
Figure S3: Network correlation plot (NCP) among salinity, nutrients, morphological and yield traits in leaves and grain of wheat two cultivars NM-14 (A) and YM-23 (B) The bold lines indicates strong correlation (NCP), while the light lines indicates weak correlation among salinity, nutrients and morphological and yield traits
Cite This Article
 Copyright © 2023 The Author(s). Published by Tech Science Press.
This work is licensed under a Creative Commons Attribution 4.0 International License , which permits unrestricted use, distribution, and reproduction in any medium, provided the original work is properly cited.
 Downloads
 Citation Tools