
 Submit a Paper
 Propose a Special lssue
 Open Access
ARTICLE

Simulation Analysis of New Energy Vehicle Engine Cooling System Based on K-E Turbulent Flow Mathematical Model
1 College of Power and Energy Engineering, Harbin Engineering University, Harbin, 150001, China
2 Extended Range Power System Research Institute, Harbin Dongan Auto Engine Co., Ltd., Harbin, 150000, China
* Corresponding Author: Hongyu Mu. Email:
Energy Engineering 2023, 120(10), 2325-2342. https://doi.org/10.32604/ee.2023.029360
Received 14 February 2023; Accepted 27 April 2023; Issue published 28 September 2023
 View Full Text
 Download PDF
Abstract
New energy vehicles have better clean and environmental protection characteristics than traditional fuel vehicles. The new energy engine cooling technology is critical in the design of new energy vehicles. This paper used one-and three-way joint simulation methods to simulate the refrigeration system of new energy vehicles. Firstly, a k-ε turbulent flow model for the cooling pump flow field is established based on the principle of computational fluid dynamics. Then, the CFD commercial fluid analysis software FLUENT is used to simulate the flow field of the cooling pump under different inlet flow conditions. This paper proposes an optimization scheme for new energy vehicle engines’ “boiling” phenomenon under high temperatures and long-time climbing conditions. The simulation results show that changing the radiator’s structure and adjusting the thermostat’s parameters can solve the problem of a “boiling pot.” The optimized new energy vehicle engine can maintain a better operating temperature range. The algorithm model can reference each cryogenic system component hardware selection and control strategy in the new energy vehicle’s engine.Graphic Abstract
Keywords
New energy vehicles have developed rapidly due to their safety, convenience, high efficiency, and environmental protection. Although there are essential differences between modern and traditional vehicles in power, the fundamental nature of new vehicles is still derived from the upgrading and transformation of conventional cars. The high-speed rotation of the motor and air-conditioning condensers are still the two significant cooling needs of new energy vehicles. In addition, the cooling part of the battery is also increased, so the new energy vehicle contains four discrete, independent cooling systems: power supply, motor, electric control, and air conditioning. The four parts are separate and do not interfere with each other. This brings many consumables, occupies space, causes energy consumption, and causes other problems. Limited by the current technology, the battery life, driving capacity, and vehicle performance of new energy vehicles must be improved by various means. Theoretically, the four cooling systems also have the optimization potential of saving material, energy, and space. Vehicle coordination, system integration, and humanized experience will be the future development direction of new energy vehicles.
Due to the limited space inside the new energy vehicle, the heat generated in the battery work accumulates. In this way, the temperature will be uneven, affecting the consistency of battery cells and reducing the efficiency of the battery charging and discharging cycle. In severe cases, it will also lead to thermal runaway, affecting the system’s safety and reliability. The battery’s charging performance and discharge power will be significantly reduced. Charge and discharge work cannot be carried out generally in severe cases. New energy vehicles must manage thermal engines and control the engine temperature within a reasonable range. At present, most thermal management systems are open-loop control. There is no pressure, flow, or temperature sensor to provide real-time feedback on specific working conditions. This method cannot effectively manage the system according to the actual working state of real-time control. The heat generated by the driving motor and controller in operating new energy vehicles has not been fully utilized. This causes energy waste and is not conducive to energy conservation and environmental protection.
The thermal management of new energy vehicle motors and its driver has been studied at home and abroad. Akal et al. [1] described the non-cooling mode of the motor. At the same time, how to choose the appropriate cooling mode and analysis method for different engines are described. Čekerevac et al. [2] described the composition and importance of thermal management for electric vehicles. Tongji University and the Technology Center of Shanghai Automotive Group Co., Ltd. (China), cooperated to study the cooling module of a pure electric car from the perspective of conceptual design. Through single-unit tests and one-dimensional simulations, it is quantitatively confirmed whether the cooling system can meet the requirements of the power drive unit for cooling temperatures below 65°C. Alshwawra et al. [3] quantitatively ensured whether the coolant flow rate met the needs of the power drive unit. Wang et al. [4] proposed the “motor and motor driver integration system” concept. The purpose is to improve the cooling effect of the motor and driver cooling system. Paula et al. [5] designed the cooling system of electric vehicles and proposed the control strategy of the optimal cooling temperature of the motor. Abdalla Elian et al. [6] used Fluent software to simulate a tank power compartment’s flow field and temperature field and analyzed the temperature distribution in a particular tank power compartment. Walter [7] also used Fluent to numerically simulate and analyze the airflow field in the engine compartment under different fan flow rates. He studied the influence of the position of the air inlet and the presence or absence of partitions on the temperature field inside the engine compartment. Falbo et al. [8] introduced a different cooling method for electric motors. At the same time, how to choose the appropriate cooling and analysis methods for different motors is described. Sharma et al. [9] explained the composition and importance of electric vehicle thermal management. For the same model, Guo et al. [10] first used CFD (computational fluid dynamics) to obtain the pressure loss curves of the power cabin under nine working conditions. Then they used KULI software to obtain the pressure loss curves of the power cabin under nine working conditions. Torregrosa et al. [11] used the wind tunnel to simulate the actual use of the car. The test was carried out at three different thermal function points, and each thermal function point was characterized by four quantities: wheel speed, wind speed, transmission ratio, and engine speed. Yildiz et al. [12] used thermocouples to measure the wall temperature of the outer surface of the engine, the wall temperature of the components’ outer surface, and the air temperature. A heat flow meter is used for heat flow measurements on small curved surfaces. Stanivuk et al. [13] proposed a method to predict the maximum temperature and time constant inside different power cabins. Hoang et al. [14] quantitatively confirmed whether the cooling system could meet the requirements of the power drive unit for the cooling temperature to be lower than 65°C through unit tests and one-dimensional simulation. Quantitatively confirm whether the coolant flow rate meets the requirements of the power drive unit. To improve the cooling effect of the motor and driver cooling system, Shinde et al. [15] proposed the concept of a “motor and motor driver integrated system”.
The series cooling circuit is designed according to the temperature characteristics of the engine and controller, and the simulation model is built in AMESim. The optimal cooling temperature of the cooling system is found according to the minimum total power standard, and the optimal cooling temperature control is developed. Compared with the brake pump’s fixed displacement control, the former’s system efficiency is significantly improved.
For the research on the cooling system of pure electric vehicle motors and drive, this paper will carry out the following work: (1) Build a radiator performance test bench and study the heat dissipation performance of the radiator. (2) Establish a three-dimensional calculation model of the new energy vehicle power cabin and conduct a three-dimensional numerical analysis of the airflow and temperature fields. (3) Establish a one-dimensional calculation model of the motor and drive cooling system to analyze the cooling capacity of the cooling system. The CFD commercial fluid analysis software FLUENT was used to simulate the flow field of the cooling water pump under different inlet flow conditions. (4) This paper proposes an optimization scheme for the “boiling” new energy vehicle engines under high temperatures and long-term climbing conditions.
2 Thermal Cycle Mode of New Energy Vehicle Engine
This paper adopts an ideal simplified model based on the adiabatic model. This paper proposes the following assumptions: 1) The new energy vehicle engine is a stable cycle. 2) The working medium is an ideal gas with no leakage and constant total mass. 3) The engine operates at a fixed frequency. 4) Both the compression chamber and the expansion chamber are insulated. 5) The instantaneous pressure in the compression and expansion chamber is the same. 6) The temperature of the working liquid of the heating device and cooling devices’ working liquid is constant. 7) Assume that the temperature of the heater and cooler is linear. The operating temperature of the regenerator is this. Fig. 1 shows a schematic diagram of the five construction connections for the entire engine.
Figure 1: Structure diagram of five components of the engine of a new energy vehicle
The size values of the engine parts (piston and piston rod) of the new energy vehicle engine are replaced by dimensionless numbers (Eq. (1)).
In the formula,
The volume
The total volume
Eq. (6) expresses the pressure changes in the regenerator, cooler and heater due to temperature changes (Eq. (6)).
Assuming that the pressure is constant in each device of the new energy vehicle engine, the above equation becomes the related Eq. (7):
The resistance loss power
The drag loss
Use the following formula to calculate the actual output power (Eq. (11)):
Equation:
3 Basic Structure and Working Principle of the Refrigeration Device
The closed forced circulation water cooling system is usually used in the refrigeration system of new energy vehicle engines, and its basic structure is shown in Fig. 2. Its main components include a new energy vehicle engine body, thermostat, radiator, cooling fan, water jacket, water pump, compensation bucket, etc.
Figure 2: Basic structure of engine cooling system for new energy vehicles
When the cooling water passes through the pump, the pressure rises and then flows into the engine jacket of the new energy vehicle through the branch pipe. The cooling water absorbs heat from the engine in the cylinder and flows through the cylinder head to the thermostat. The thermostat will flow into the refrigerator through the radiator’s core to exchange heat with the outside air. The final coolant returns to the inlet of the pump through the radiator. This completes a cooling. At the same time, the cooling fan can start and stop according to the temperature displayed by the temperature sensor. So repeatedly to ensure that the new energy vehicle engine outlet cooling water temperature in a suitable range.
4 Simulation Modeling of the Cooling System
4.1 Simulation of Engine Refrigeration System for New Energy Vehicles
Therefore, it is necessary to optimize the design of its key components. This paper has modeled the cooling system of the new energy vehicle engine. MATLAB is an engineering application software with extensive simulation functions developed by IMAGINE Company. It can realize multi-disciplinary and multi-domain modeling and simulation. In this paper, strict experiments must be carried out on each component, and corresponding parameters must be set to ensure simulation accuracy. MATLAB software includes a thermal hydraulic library, mechanical library, signal library, air conditioning library, heat library, and cooling system library. This paper uses MATLAB software to design and establish the new energy engine cooling system simulation model for the thermal-hydraulic library, signal library, cooling system library, heat library, and other components. The content includes sketches, submodules, parameters, and simulation models. Fig. 3 shows the engine body of the new energy vehicle, thermostat, radiator, cooling fan, water jacket, water pump, compensation bucket, cooling pipeline, etc.
Figure 3: Engine cooling simulation model
4.2 Model Predictive Control Logic
The powertrain cooling system of the sample vehicle adopts the on-off threshold control logic to control the electronic water pump and the electronic fan in the two circulating waterways. The principle of the on-off threshold control logic is that when the temperature of the radiator inlet is detected to be higher than the specified threshold temperature, the electronic water pump and the electronic fan open to increase the heat transfer of the coolant. As the electronic water pump and the electronic fan start to run at maximum power, it inevitably leads to the energy consumption of electric vehicles. This study proposes Model Predictive Control (MPC) logic to optimize the powertrain cooling system controller. Fig. 4 shows the basic schematic diagram of MPC control.
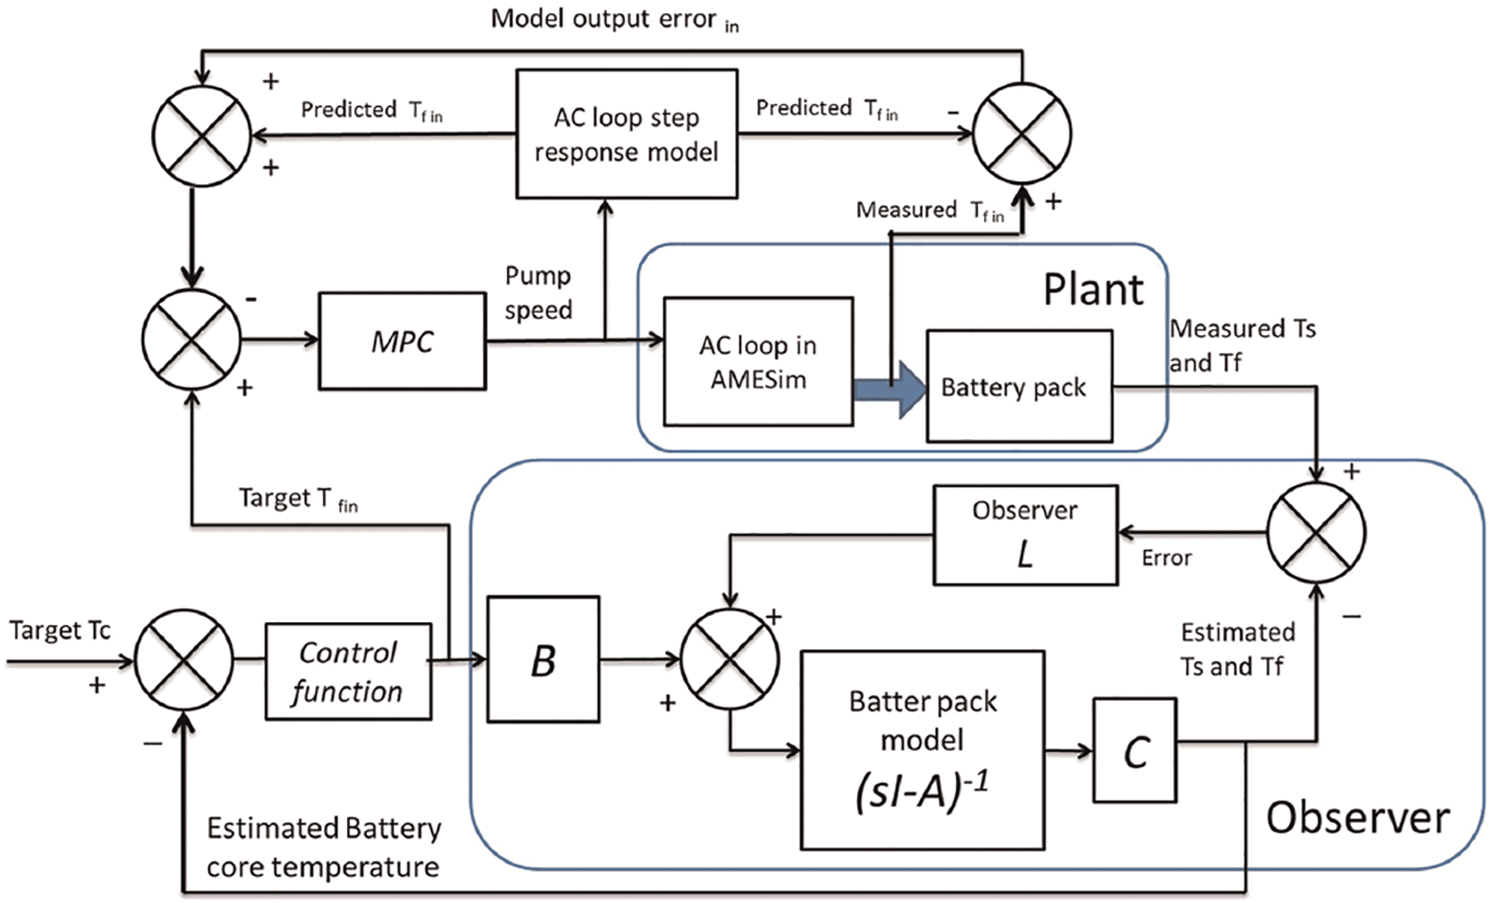
Figure 4: Mpc-based powertrain cooling system controller
The linear model, objective function, and system constraints in the dotted box in Fig. 4 are the prominent members of the MPC controller. The linear equation calculates the thermal balance of the closed-loop cold side in the dynamic cooling system. The system constraint mainly controls the opening of the electronic pump and the external fan. The objective function is the optimal control mode to keep the heating parts of the power module in the best temperature range.
4.3 Linear Calculation Model of the Heat Balance of the Cooling System
Before building the MPC-based powertrain cooling system, it is necessary to establish the thermal balance model of the cooling system. The model is shown in Eq. (12). Taking the power battery PACK cooling system as an illustration is shown in Eq. (13). The drive motor and the motor controller cooling system use the same control logic (Eqs. (12) and (13)).
In the cooling system, coolant flow rate
Eqs. (15) and (16) are obtained by discretization using Euler’s formula.
Among them
4.4 Design of Objective Function
The purpose is to keep the power battery in the best temperature range possible to reduce the deviation between the output and target values [17]. Use the control increment as the state quantity (Eq. (18)).
The following formula conditions must be met to minimize the deviation between the output and target values (Eq. (19)).
where
5 Simulation Calculation and Analysis
5.1 Simulation Results of Engine Inlet and Outlet Coolant Temperature and Radiator Inlet and Outlet Temperature
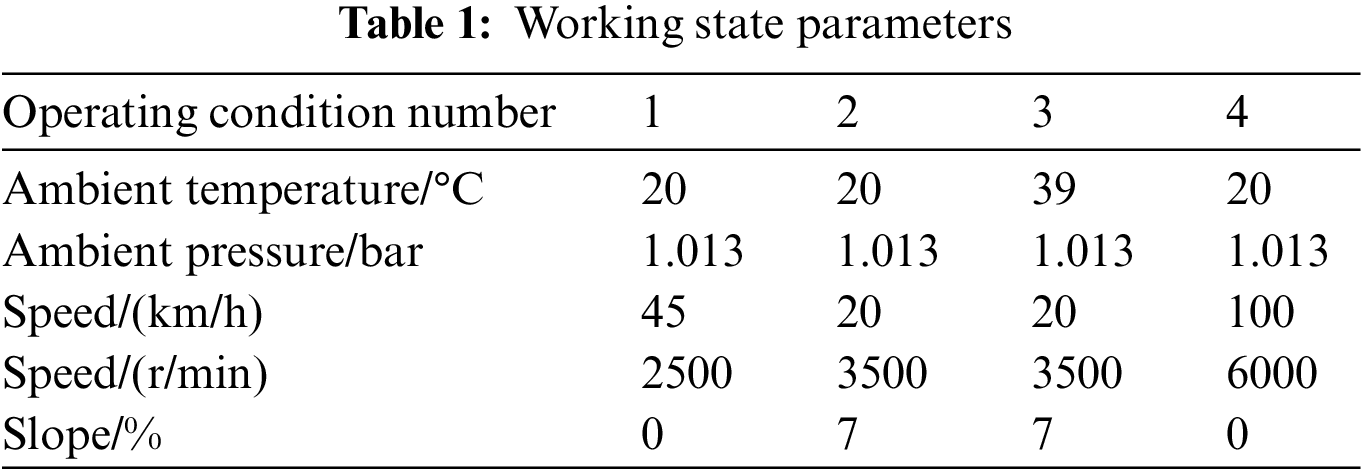
We should fully understand the cooling effect of the engine cooling system of new energy vehicles. In particular, it is necessary to ensure that the appropriate temperature of the outlet cooling water of the engine of the new energy vehicle is maintained under the worst working conditions. This paper mainly analyzes four different working states [18]. The contents are working state 1, working state 2, working state 3, and working state 3. Working state 4 is the maximum power condition. The parameter Settings of each simulation condition are shown in Table 1. Working condition 1 is the general working condition. Condition 2 is the maximum torque condition. Working condition 3 is high temperature and longtime climbing condition. Working condition 4 is the top power working condition. The ambient pressure under the four working conditions is 1.013 bar. The simulation time is 600 s. This integrator type selects the standard integrator [19]. The communication interval is 0.1 s. The engine operating parameters are expressed as follows: the clearance volume of the expansion chamber is 30.52 cm3. The clearance volume of the compression cavity is 28.68 cm3. The scavenging volume of the expansion chamber is 120.82 cm3. The scavenging volume of the compression chamber is 114.13 cm3. The mechanical efficiency was 0.90. The average pressure is 4.13 MPa. The cooling temperature is288 K. The temperature of the heat source is 977 K. The operating frequency is 41.72 Hz [20].
The simulation results use the output coolant temperature at the inlet and outlet of the new energy vehicle engine and the temperature at the inlet and outlet of the radiator as the basis for evaluating the performance of the engine cooling system of the new energy vehicle. The content of working conditions is shown in Figs. 5 and 6. Fig. 5 shows the temperature change of the cooling liquid in operatingstate 1. Fig. 6 shows the temperature distribution program of the radiator section. Most of the cooling air passes through the heat exchanger belt of the radiator. The high-temperature air movesto the engine compartment’s rear under the cooling fan’s high-speed suction. Due to the small space in the windshield, hot air builds up heat buildup at the outer ends of the cooling fan’s blades [21]. In the area between the lower air intake grille and the windward side of the radiator, the air temperature is equal to the ambient temperature. The fresh charge entering from the lower air intake grill passes directly through the radiator’s heat transfer belt. This part of the air does not absorb other heat before reaching the radiator. No high-temperature air returns to this area. Hence, the air temperature equals the ambient temperature.
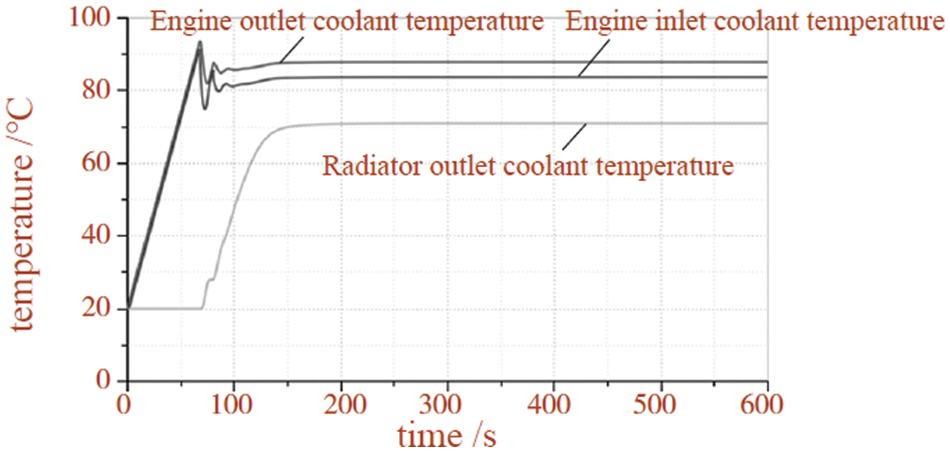
Figure 5: Temperature variation of cooling liquid in working state 1
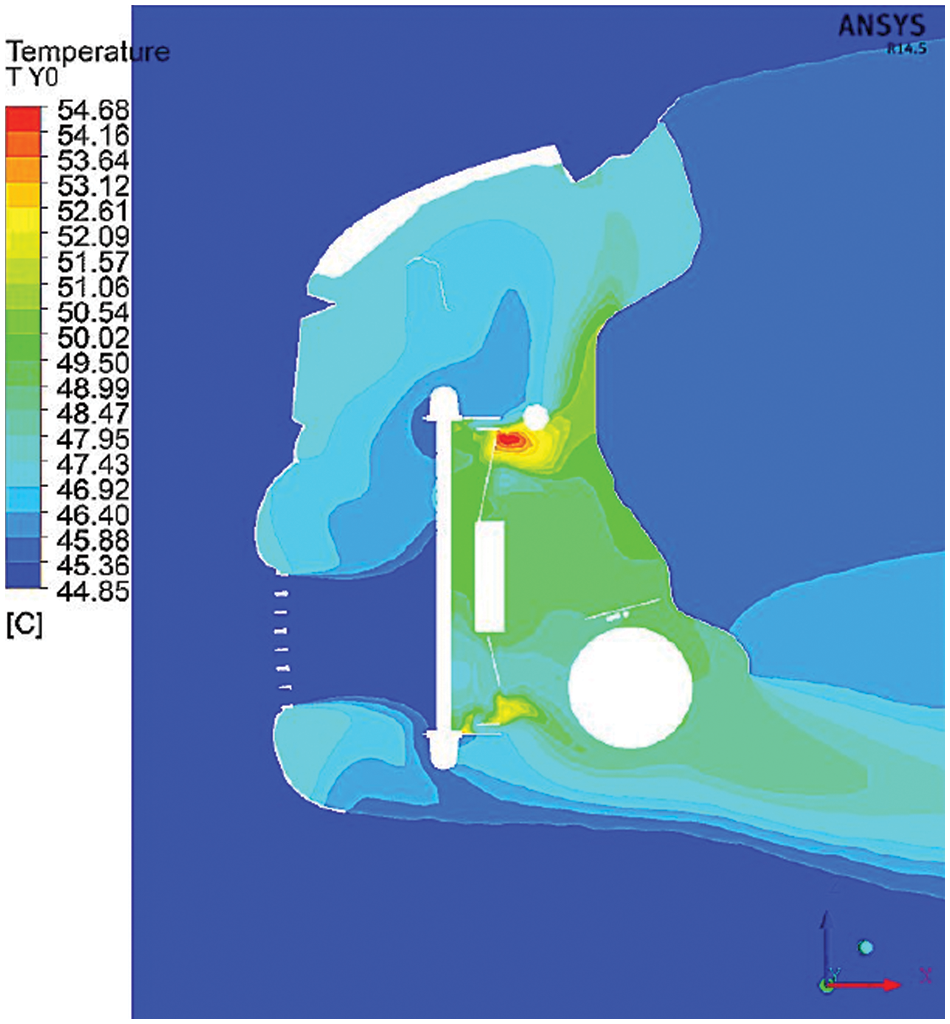
Figure 6: The temperature distribution cloud diagram of the radiator section under working state 1
The cooling liquid’s temperature change and the radiator’s cross-sectional velocity vector in working state two are shown in Figs. 7 and 8. When the cooling water temperature at the outlet of the new energy vehicle engine reaches 107 degrees Celsius. The new energy vehicle engine will “boil.” Because it cannot meet the cooling system’s needs, we must adjust the parameters of each part. The radiator continuously radiates heat to this part of the air, so the temperature is the highest. The air temperature at the upper air intake grille is equivalent to the ambient temperature because the cooling air entering this part is not hindered during the movement process, and the air entering is relatively large. Hence, the nearby air temperature is equivalent to the ambient temperature. The air temperature at the lower air intake grill is comparable to the ambient temperature because the radiator does not heat this part of the air, and no high-temperature air is returning to this area. The air temperature distribution at the rear of the power cabin is also related to the airflow [22].
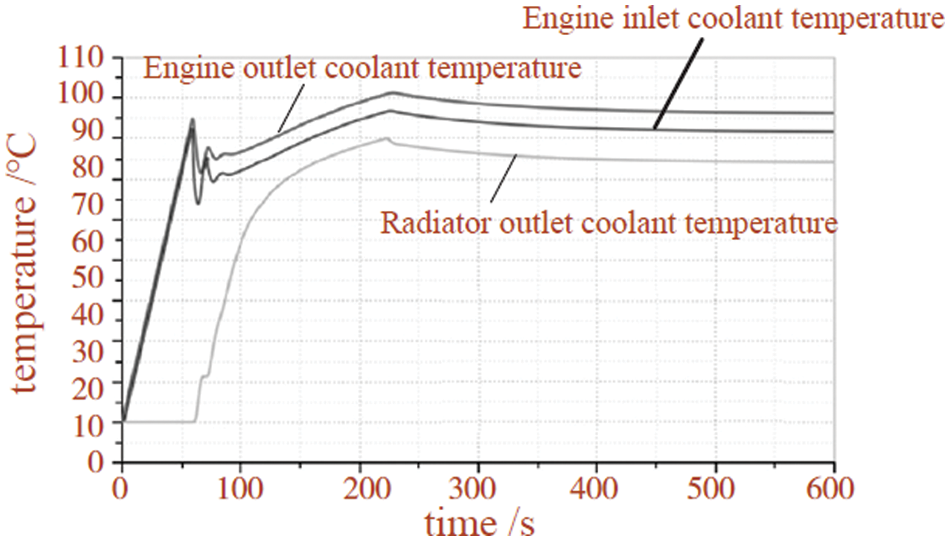
Figure 7: Temperature variation of cooling liquid in operating state 2
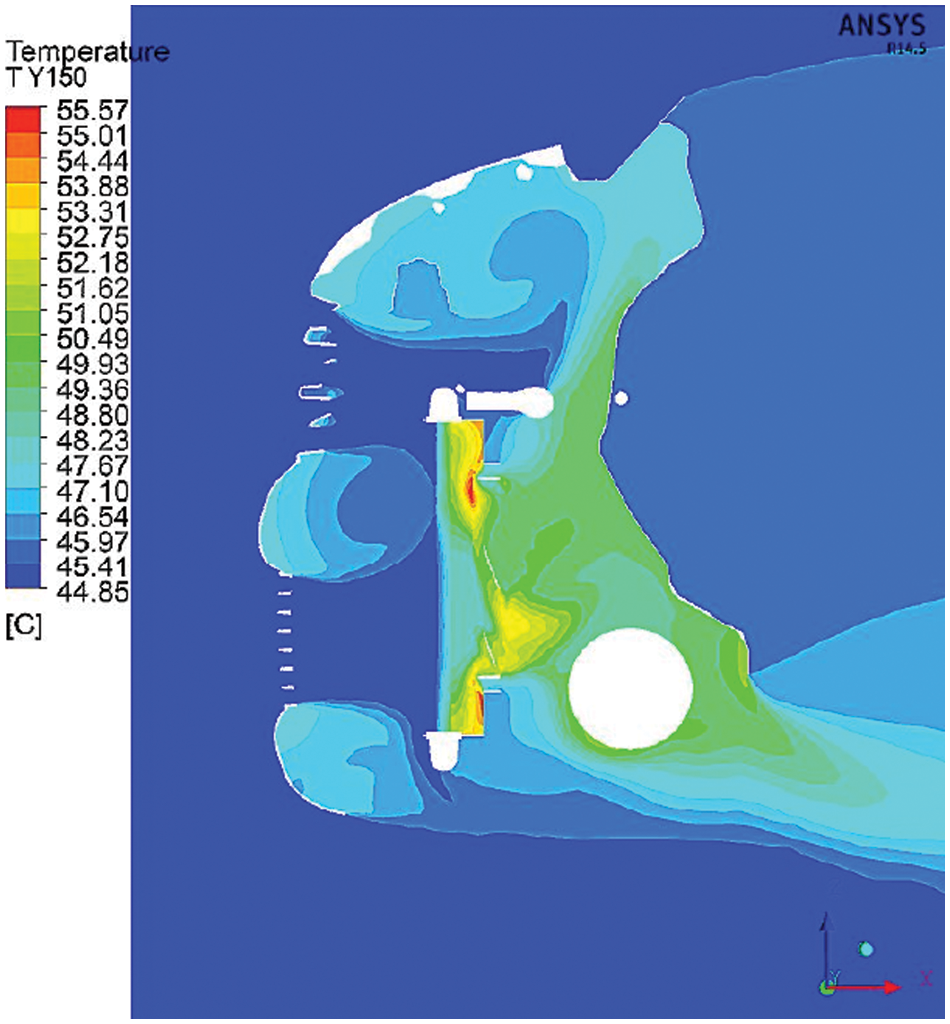
Figure 8: The temperature distribution cloud diagram of the radiator section under working state 2
The temperature change of the cooling liquid and the cross-sectional velocity vector of the radiator in working state three are shown in Figs. 9 and 10. The temperature of the cooling water at the engine outlet of the new energy vehicle will reach a stable value. This shows that the cooling system can generally work under the above conditions. The temperature of the coolant at the outlet of the new energy vehicle engine is kept within the optimum operating temperature range of the new engine. The radiator continuously radiates heat to this part of the air, so the temperature of this part of the air is the highest. The air temperature between the upper and lower air intake grills is slightly higher than the ambient temperature. The air temperature between the lower grille and the bumper is also slightly higher than the ambient temperature due to the backflow in these two areas. Some of the air above the ambient temperature returns to this area.
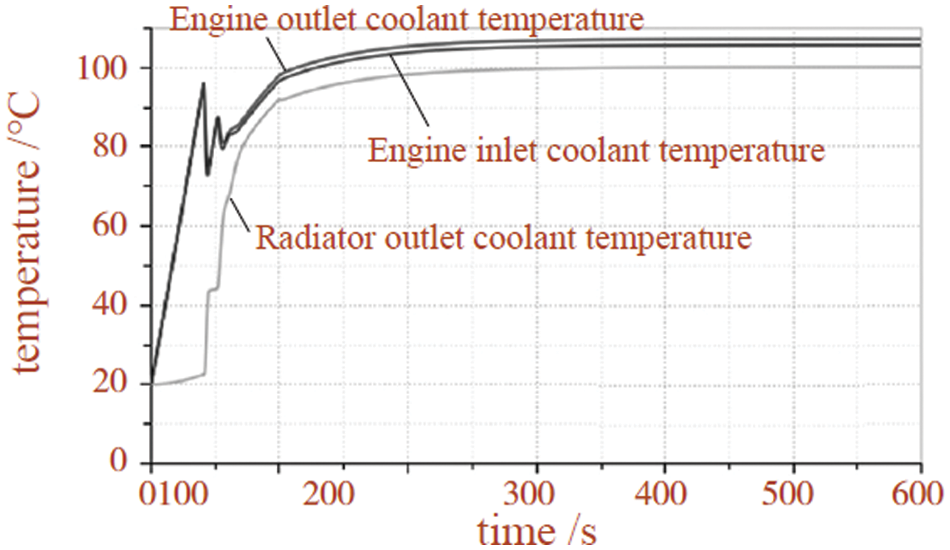
Figure 9: Temperature variation of cooling liquid in operating state 3
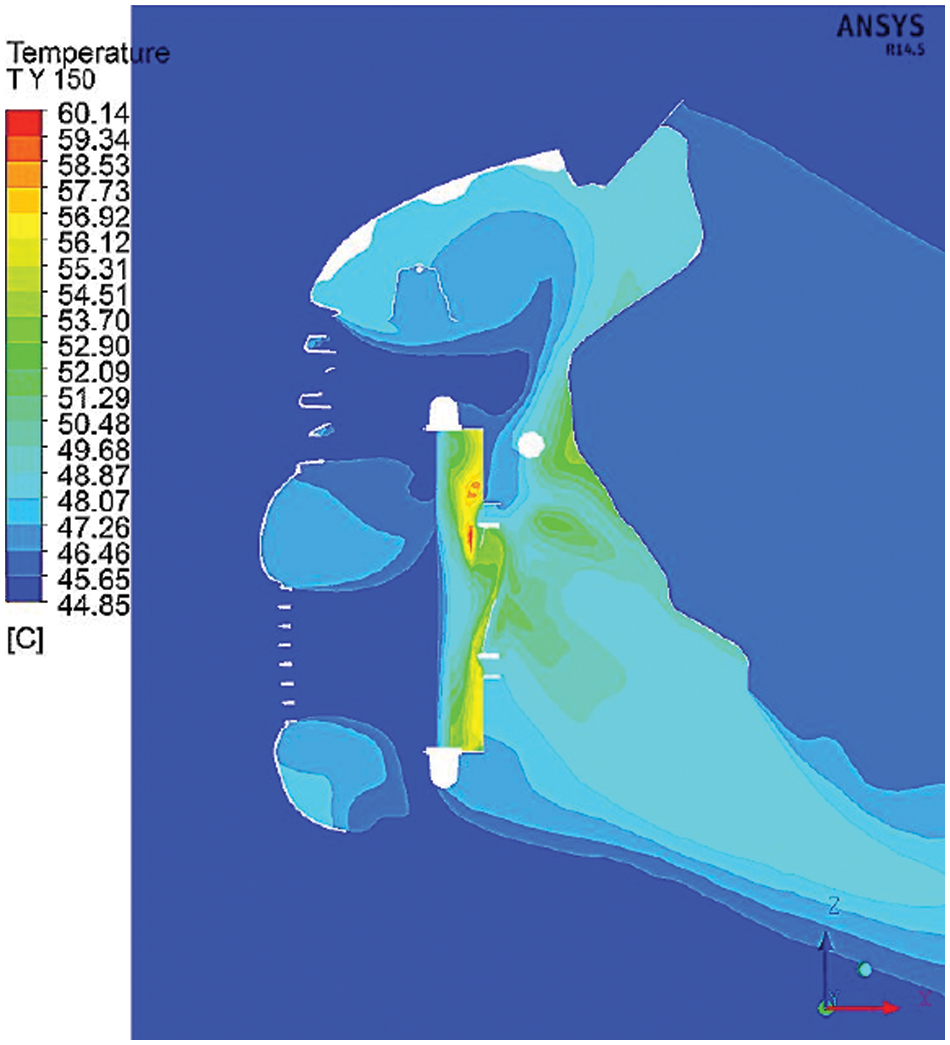
Figure 10: The temperature distribution cloud diagram of the radiator section under working state 3
The temperature change of the cooling liquid and the cross-sectional velocity vector of the radiator in working state four are shown in Figs. 11 and 12. The cooling water temperature at the engine outlet of the new energy vehicle will continue to increase with time. In contrast, the radiator outlet temperature will remain at a fixed value. At this time, the thermostat is closed. The thermostat only does a cycle, and the radiator does not work. At about 67 s, the temperature of the cooling water at the engine outlet of the new energy vehicle reached the highest. At this time, the thermostat opens, and the radiator starts to work. The action of the water pump causes the cooling water stored in the radiator to flow into the engine. This leads to a reduction in the temperature of the cooling system of the new energy vehicle engine. After several iterations of the thermostat, a stable value is finally reached. The paraffin core in the thermostat and the cooling water has a low heat transfer coefficient. This increases the temperature of the paraffin core at a slower rate than the cooling medium. The air temperature near the radiator is relatively high, and the air temperature is relatively low in places far away from the radiator and with a small flow velocity. This is because the radiator is the only heat source in the power cabin, and the air flowing through this part will be heated due to the heat generated by the radiator.
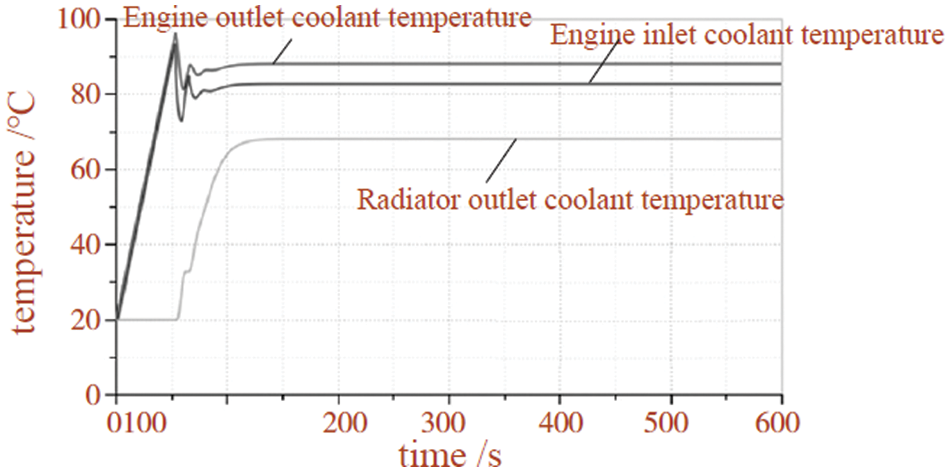
Figure 11: Temperature change of coolant in operating condition 4
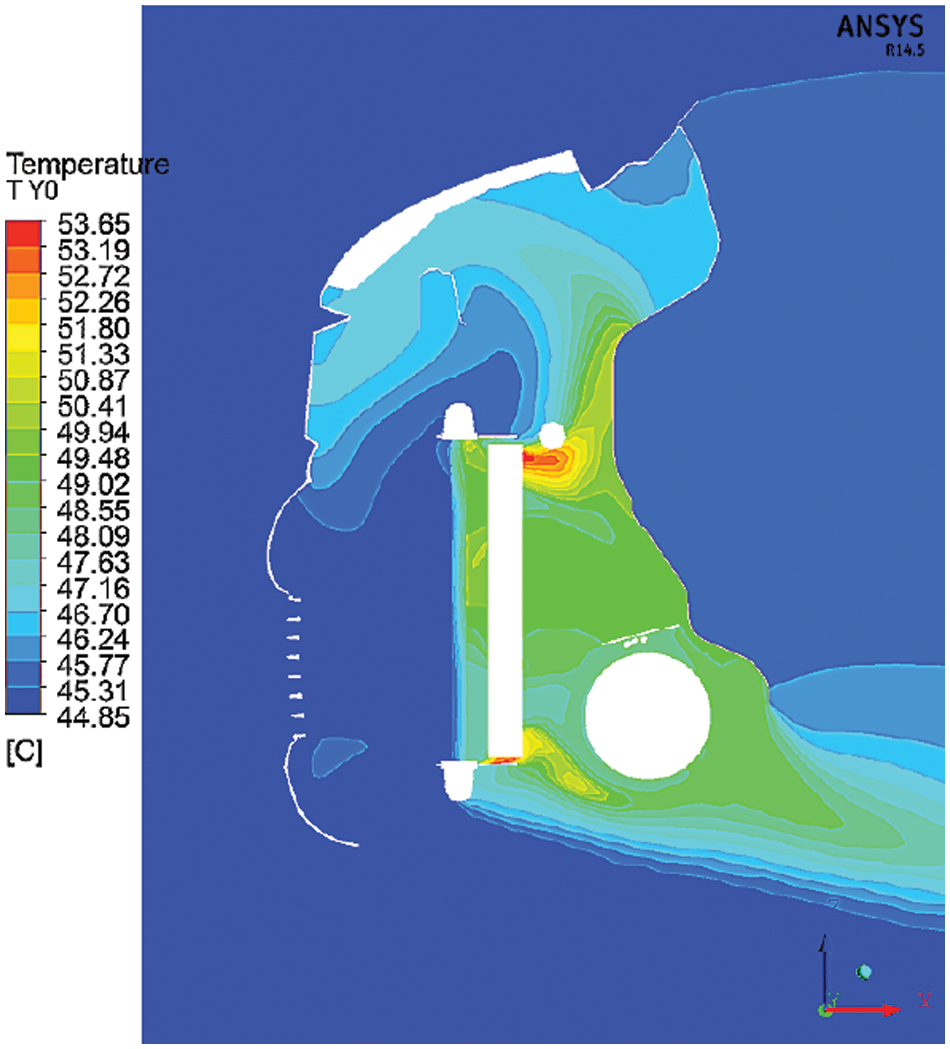
Figure 12: The temperature distribution cloud diagram of the radiator section under working state 4
The temperature of the cooling water at the engine outlet of the new energy vehicle is the highest in vehicle operating state 3 (Table 2). Because the speed of the new energy vehicle engine is high, it generates a lot of heat energy. Because the vehicle’s speed is prolonged, and the air intake is minimal, there is very little heat exchange between the radiator and the air. In addition, due to the relatively high outdoor temperature, there is less heat exchange with the outside world. At this time, the heat of the new energy vehicle engine cannot be cooled in time, causing the heat of the new engine to accumulate on the surface of the engine. At this time, the temperature of the cooling water of the new energy vehicle engine is the highest. The results show that the exhaust gas cooling temperature of the new energy vehicle engine is higher than 11°C in the operating state 3. This shows that the change in ambient temperature will significantly impact the exhaust temperature of the new energy vehicle engine. In the four cases, the engine speed of the new energy vehicle is the highest, and the heat is the most. The greater the air intake of the radiator, the greater the heat exchange with the air and the greater its value. The new energy vehicle engine can be kept in a suitable temperature range.
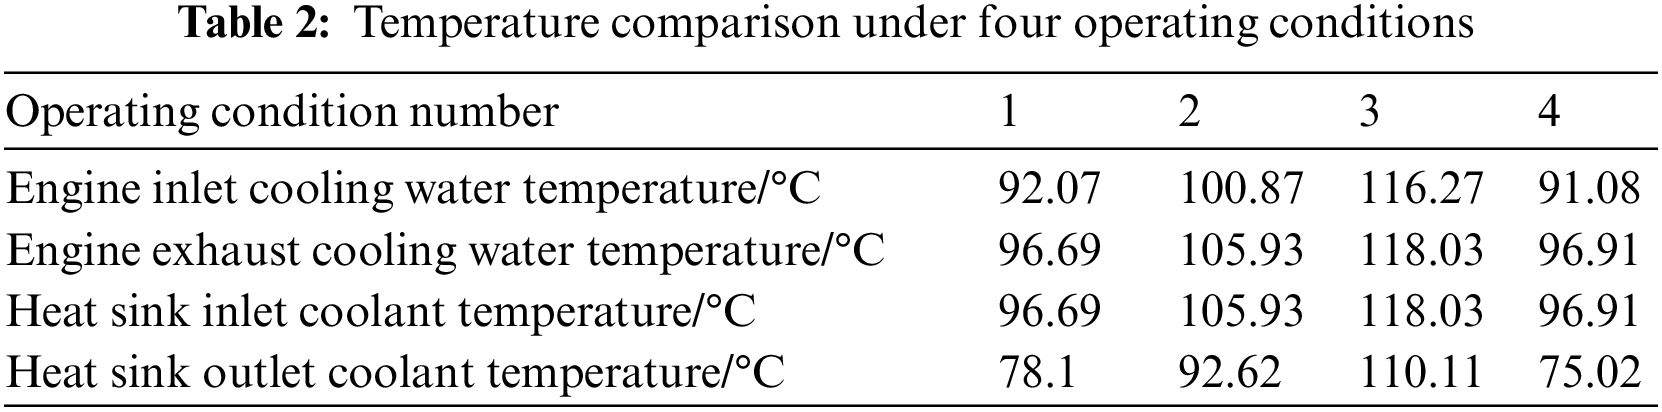
The temperature of the engine outlet coolant is the highest when the vehicle is running under condition 3. Compared with working condition 2, the engine outlet coolant temperature in working condition 3 is 11°C higher. However, in working condition 4, although the number of revolutions of the engine is the largest and the heat generated is the most, the engine’s speed is also the largest, and the air intake of the radiator is relatively large. The heat exchange with the air in the radiator becomes more extensive, and its value is greater than the heat generated due to the high number of revolutions. Therefore, the engine can be maintained within a reasonable temperature range. This paper proposes a scheme to improve the cooling effect of the cooling system. That is to say, it is a solution to increase the width of the heat dissipation core of the radiator. The width of the original cooling core is 547 cm. At this time, this paper tentatively increases the width by 14 cm. This value is that of reference [2]. At this time, reduce the opening temperature of the thermostat and set it to 82°C, and set the temperature to 93°C when fully open. This value is also the data of reference [2]. This enables the thermostat to meet the cooling effect requirements of the engine cooling system. In this paper, the engine cooling system of new energy vehicles is optimized, and the simulation results are obtained.
It can be seen from Fig. 13 that the temperature of the cooling water at the inlet and outlet of the new energy vehicle engine and the cooling water at the outlet of the radiator reached a stable value within about 250 s of operating time after the parameters were optimized. During the high temperature and long-term climbing process, the temperature of the cooling water at the engine outlet of the new energy vehicle reached 103°C. Even in the other three working states, the engine cooling system of the new energy vehicle can still be cooled well. The established model agrees with the engineering practice. It has a particular guiding significance for future optimization design research.
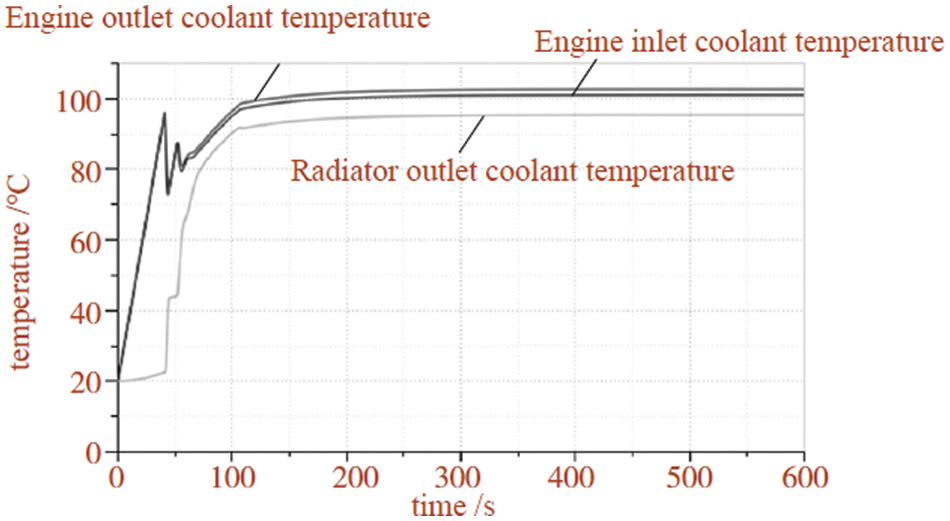
Figure 13: Variation of optimal process parameters under working condition 3
5.2 Numerical Simulation of Refrigeration System
5.2.1 Temperature Comparative Analysis
Fig. 14 shows the temperature comparison diagram of the power battery PACK and the electronically controlled cooling system of the motor under MPC-based and switch-type control.
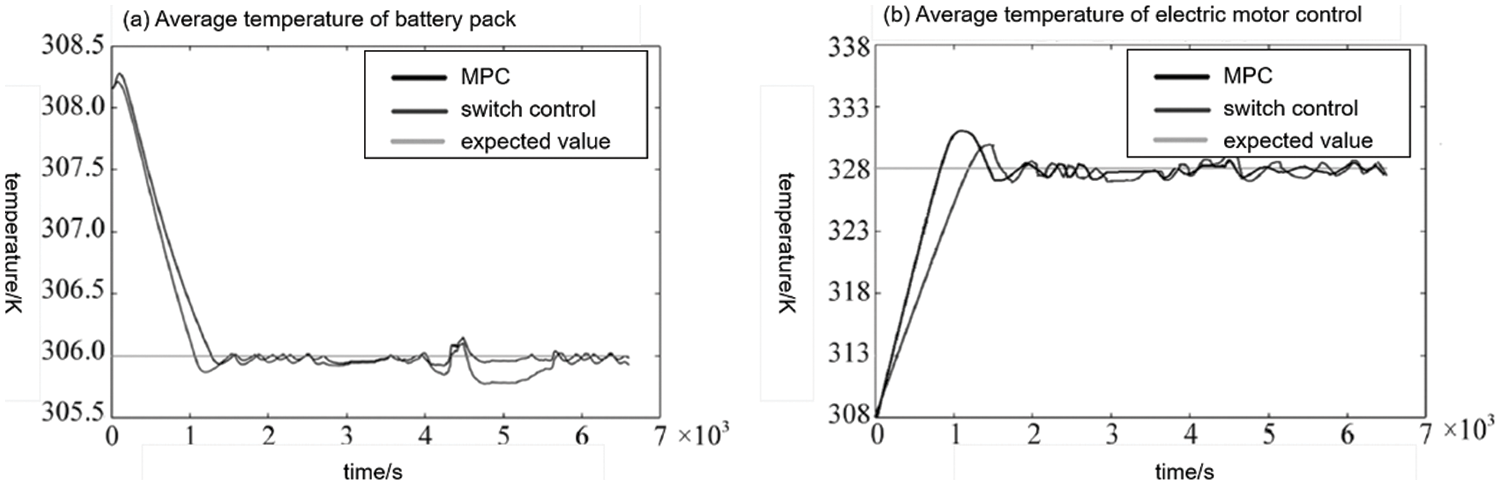
Figure 14: Comparison of temperature between power battery PACK and motor electronically controlled cooling system under MPC and switch control
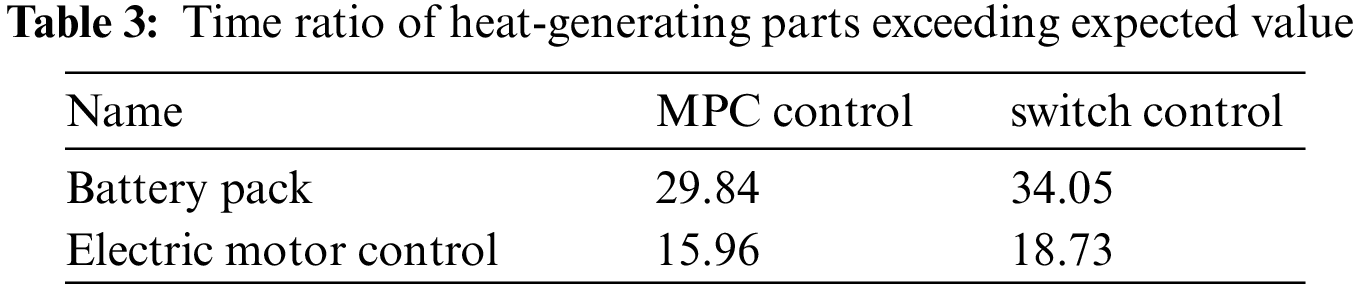
It can be seen from Fig. 14 that, under MPC’s control, the battery PACK and the electric motor cooling system reach the desired temperature in 1199 s. Under the control of the switching threshold, the battery PACK and the motor electronic control cooling system reached the expected value in 1469 s. Under the control of MPC, the power battery’s temperature and the electric motor’s electronic control will approach the desired temperature more quickly than under the control of the switching threshold. Table 3 is the statistical percentage of the time when the power battery PACK temperature and the motor’s electronic control exceed the expected value. The time ratios of the MPC-based power battery PACK and motor electronic control cooling system exceeding the expected value are 29.84% and 15.96%, respectively, under the entire cycle conditions (Table 3). The power battery PACK and electronic motor control based on switch control, the time ratios of the cooling system exceeding the expected value are 34.05% and 18.73%, respectively. By comparison, it is found that the powertrain cooling system based on MPC control has a more vital ability to control the temperature and can better meet the design requirements.
5.2.2 Analysis and Comparison of Energy Consumption
The energy consumption of the cooling system is shown in Fig. 15. It can be seen from Fig. 15 that before the cooling system reaches the expected temperature, the consumption curve of the entire cooling system based on switch control has a faster upward curvature than the energy consumption curve of the entire cooling system under MPC control. When the desired temperature is reached, the energy consumption curve of the cooling system under MPC control is slightly flatter than that of the cooling system under switch control. In the whole cycle condition, the cooling system’s energy consumption based on MPC control is 1.82 kW, while the cooling system’s energy consumption based on switch control is 4.01 kW. Using MPC control saves 54.61% compared to switching controlled cooling systems.
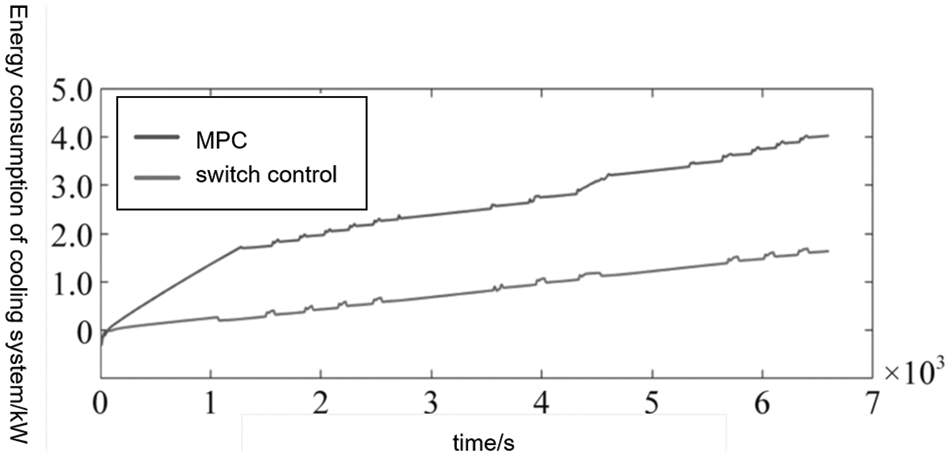
Figure 15: Cooling system energy consumption diagram
This paper uses MATLAB software to simulate the engine cooling system of new energy vehicles under four working conditions. The study found that the new energy vehicle engine will “boil” during the high temperature and long climbing process. The system can maintain an ideal working temperature in the other three cases. This method can keep the optimized solution in the best working temperature range by selecting a low-performance radiator and a low-performance cooling fan. The “boiling” phenomenon can be solved by changing the radiator’s structure and adjusting the thermostat’s parameters. The calculation of KULI shows that the heat dissipation capacity of the original radiator has a margin of 30%. The heat dissipation capacity of the original cooling fan has a margin of 60%. This provides a direction for the OEM to improve the cooling system. The research in this paper is helpful to the rational design of the cooling system.
Acknowledgement: None.
Funding Statement: The authors received no specific funding for this study.
Author Contributions: The authors confirm contribution to the paper as follows: Hongyu Mu is the first author and corresponding author, responsible for writing the main content of the outline. At the same time, he is also responsible for maintaining contact with the magazine. Chuanlei Yang, Hong Teng and Xingtian Zhao collected the data and summarized the main conclusions. Hongquan Lu and Dechun Wang organized the article content and built the model. Shiyang Hao, Xiaolong Zhang and Yan Jin are responsible for model design and revision.
Availability of Data and Materials: The data that support the findings of this study are available on request from the corresponding author. The data are not publicly available due to privacy or ethical restrictions.
Conflicts of Interest: The authors declare that they have no conflicts of interest to report regarding the present study.
References
1. Akal, D., Öztuna, S., Büyükakın, M. K. (2020). A review of hydrogen usage in internal combustion engines (gasoline-Lpg-diesel) from combustion performance aspect. International Journal of Hydrogen Energy, 45(60), 35257–35268. [Google Scholar]
2. Čekerevac, Z., Dvořák, Z., Prigoda, L. (2022). Electric or internal combustion engines for passenger cars—Environmental and economic aspects. Communications-Scientific letters of the University of Zilina, 24(1), B49–B58. [Google Scholar]
3. Alshwawra, A., Pasligh, H., Hansen, H., Dinkelacker, F. (2021). Increasing the roundness of deformed cylinder liner in internal combustion engines by using a non-circular liner profile. International Journal of Engine Research, 22(4), 1214–1221. [Google Scholar]
4. Wang, X., Zhang, Z., Chen, Y., Li, Y. (2020). Study on the coolant pressure of internal combustion engines through vibro-acoustical analysis of a real cylinder block structure. Journal of the Brazilian Society of Mechanical Sciences and Engineering, 42(4), 1–10. [Google Scholar]
5. Paula, V. B., Chun, A., Miotto, B. M., Cunha, C. C. M., Santos, J. J. C. S. (2020). Alternative design and economic feasibility of an experimental WHR for intake air conditioning of a large internal combustion engine. Revista de Engenharia Térmica, 19(2), 31–39. [Google Scholar]
6. Abdalla Elian, A., Aissa, W., Dahab, O. M., Cidek, M. F. (2020). Enhancement of water cooled internal combustion engines using Peltier effect. International Journal of Applied Energy Systems, 2(2), 65–70. [Google Scholar]
7. Walter, B. (2021). Electric counterbalanced forklift truck with features of forklift trucks with internal combustion engine. ATZ Heavy Duty Worldwide, 14(4), 56–59. [Google Scholar]
8. Falbo, L., Perrone, D., Morrone, P., Algieri, A. (2022). Integration of biodiesel internal combustion engines and transcritical organic Rankine cycles for waste-heat recovery in small-scale applications. International Journal of Energy Research, 46(4), 5235–5249. [Google Scholar]
9. Sharma, S., Sharma, D., Soni, S. L., Singh, D., Jhalani, A. (2022). Performance, combustion and emission analysis of internal combustion engines fuelled with acetylene−A review. International Journal of Ambient Energy, 43(1), 622–640. [Google Scholar]
10. Guo, P., Xu, J., Zhao, C., Zhang, B. (2022). Study of hydrogen internal combustion engine vehicles based on the whole life cycle evaluation method. Trends in Renewable Energy, 8(1), 27–37. [Google Scholar]
11. Torregrosa, A. J., Broatch, A., Olmeda, P., Dreif, A. (2021). Assessment of the improvement of internal combustion engines cooling system using nanofluids and nanoencapsulated phase change materials. International Journal of Engine Research, 22(6), 1939–1957. [Google Scholar]
12. Yildiz, I., Caliskan, H., Mori, K. (2020). Exergy analysis and nanoparticle assessment of cooking oil biodiesel and standard diesel fueled internal combustion engine. Energy & Environment, 31(8), 1303–1317. [Google Scholar]
13. Stanivuk, T., Lalić, B., Žanić Mikuličić, J., Šundov, M. (2021). Simulation modelling of marine diesel engine cooling system. Transactions on Maritime Science, 10(1), 112–125. [Google Scholar]
14. Hoang, A. T., Nguyen, X. P., Le, A. T., Pham, M. T., Hoang, T. H. et al. (2021). Power generation characteristics of a thermoelectric modules-based power generator assisted by fishbone-shaped fins: Part II–Effects of cooling water parameters. Energy Sources, Part A: Recovery, Utilization, and Environmental Effects, 43(3), 381–393. [Google Scholar]
15. Shinde, B. J., Karunamurthy, K., Ismail, S. (2020). Thermodynamic analysis of gasoline-fueled electronic fuel injection digital three-spark ignition (EFI-DTSI) engine. Journal of Thermal Analysis and Calorimetry, 141(6), 2355–2367. [Google Scholar]
16. Li, W., Wu, P., Yang, Y., Shi, W., Li, W. (2021). Investigation of the cavitation performance in an engine cooling water pump at different temperature. Proceedings of the Institution of Mechanical Engineers, Part A: Journal of Power and Energy, 235(5), 1094–1102. [Google Scholar]
17. Fonseca, L., Olmeda, P., Novella, R., Valle, R. M. (2020). Internal combustion engine heat transfer and wall temperature modeling: An overview. Archives of Computational Methods in Engineering, 27(5), 1661–1679. [Google Scholar]
18. Ghasemi Zavaragh, H., Kaleli, A., Solmuş, İ., Afshari, F. (2021). Experimental analysis and evaluation of thermostat effects on engine cooling system. Journal of Thermal Science, 30(2), 540–550. [Google Scholar]
19. Aronson, A., Kafri, R., Nusbaum, I., Kozary, M., Rabino, Y. et al. (2021). The combined effect of high temperature and Ethylene Glycol (EG) on Polyethylene Terephthalate (PET)-reinforced coolant hose failure in combustion engines. Journal of Failure Analysis and Prevention, 21(2), 462–471. [Google Scholar]
20. Mohamed, E. S. (2016). Development and analysis of a variable position thermostat for smart cooling system of a light duty diesel vehicles and engine emissions assessment during NEDC. Applied Thermal Engineering, 99(6), 358–372. [Google Scholar]
21. Golzari, R., Zhao, H., Hall, J., Bassett, M., Williams, J. et al. (2021). Impact of intake port injection of water on boosted downsized gasoline direct injection engine combustion, efficiency and emissions. International Journal of Engine Research, 22(1), 295–315. [Google Scholar]
22. Erkan, A., Tüccar, G., Tosun, E., Özgür, T. (2021). Comparison of effects of nanofluid utilization (Al2O3, SiO2, TiO2) with reference water in automotive radiators on exergetic properties of diesel engines. SN Applied Sciences, 3(3), 1–13. [Google Scholar]
Cite This Article
 Copyright © 2023 The Author(s). Published by Tech Science Press.
This work is licensed under a Creative Commons Attribution 4.0 International License , which permits unrestricted use, distribution, and reproduction in any medium, provided the original work is properly cited.
 Downloads
 Citation Tools