
 Submit a Paper
 Propose a Special lssue
 Open Access
ARTICLE
Modeling the Proposal of the Simultaneous Purchases and Sales of Electricity and Gas for the Energy Market in a Microgrid Using the Harmony Search Algorithm
Financial School, China Financial Policy Research Center, International Money Institute, Renmin University of China, Beijing, 100872, China
* Corresponding Author: Wensheng Dai. Email:
(This article belongs to the Special Issue: Application of Artificial Intelligence for Energy and City Environmental Sustainability)
Energy Engineering 2022, 119(6), 2681-2709. https://doi.org/10.32604/ee.2022.021410
Received 13 January 2022; Accepted 12 April 2022; Issue published 14 September 2022
 View Full Text
 Download PDF
Abstract
The use of different energy carriers together, known as an energy hub, has been a hot topic of research in recent years amongst scientists and researchers. The term energy hub refers to the simultaneous operation of various infrastructures for energy generation and transfer, which has gained momentum in the form of microgrids (MGs). This paper introduces a new strategy for the optimal performance of an MG consisting of different energy carriers for each day. In a smart distribution network (DN), MGs can reduce their own costs in the previous-day market by bidding on sales and purchases. The sales and purchases bidding problem is challenging due to different uncertainties, however. This paper proposes a two-stage strategy for making an optimal bid on electricity sales and purchases with electricity and gas price dependency in the previous-day and real-time markets for an energy hub. In this model, the MG behavior regarding the electricity and gas energy sales/purchase, the simultaneous effects of electricity and gas prices, as well as the energy carriers’ dependence on one another are all examined. Due to the inherent uncertainty in the sources of clean energy production, the probabilistic model and the production and reduction scenario have been used in the paper to cover this issue. In the proposed grid, energy sales/purchases are presented in a multi-carrier MG in a two-stage model. This model is solved by using the harmony search algorithm in MATLAB. Numeric results demonstrate the benefits of this model in reducing energy hub costs of operation.Keywords
Abbreviations
| c: | Price |
| po: | Energy production |
| p: | Received energy |
| T: | Transferred energy |
| E: | Storage energy |
| I: | Binary variable of storage status |
| L: | Unresponsive demand |
| M: | Charge and discharge energy of storage |
| t: | Hour |
| RP: | Distributed generation |
| Nominal power | |
| R: | Irradiation |
| v: | Wind velocity |
| Vibal selection parameters | |
| Beta selection parameters | |
| Units performance | |
| Maintenance cost ratio | |
| Storage coupling coefficient | |
| Standard deviations | |
| Average value | |
| MG numbers | |
| Scenario | |
| Pix: | Pre-purchase/sale confirmation |
| Energy purchase price | |
| Gas distribution coefficient | |
| Probability | |
| pv: | photovoltaic |
| wt: | Wind turbine |
| Ru: | Restructured units |
| chp: | Combined heat and power |
| EHP: | Electric heat pump |
| AB: | Boiler |
| ES: | Energy storage |
| Net: | Network |
| char: | Charger storage power converter |
| dischar: | Discharge storage power converter |
| trans: | Transformer |
| e: | Electricity |
| g: | Natural gas |
| h: | Heat |
| tot: | Total |
| p: | Input porter |
| l: | Output porter |
| O: | Initial value |
| stb: | Storage energy losses |
| O&M: | Operation and maintenance |
| ci: | Minimum velocity |
| co: | Maximum velocity |
| ce: | Specific radiation point |
| STAD: | Standard situation |
| RT: | Real time |
| DA: | Day ahead |
Microgrids (MGs) are a controllable set of distributed generation (DG) sources such as wind turbines, diesel generators, fuel cells, photovoltaic (PV) systems, energy storage systems (ESS) and loads that can supply electric and, if necessary, thermal power as well. MGs can be operated in grid-connected or islanded modes [1], and they confer numerous benefits for both the consumer, as well as the electricity generation companies generating. From the customers’ point of view, an MG can simultaneously supply electricity and heating, increase confidence within the society and infrastructure, reduce greenhouse gas emissions and improve life quality simultaneously. From the electricity companies’ point of view, MG use can reduce the consumer demand and, therefore, decrease transfer line development facilities, remove peak consumption points and, thus, reduce network losses [2].
Energy, and electricity in particular, is a major factor influencing the countries’ economic growth and growth opportunities in nations across the entire planet. Traditionally, meeting the demand safely requires the expansion of generation and transfer capacities of the power system [3]. Energy management has long been a fundamental aspect of power systems and has recently gained momentum in the world of MGs and their technicians and researchers too. Industrial, commercial and residential consumers are in contact with energy carrier grids such as regional electricity, natural gas, heating, or cooling systems [4]. Various previous studies have focused on energy infrastructure, but few works have investigated the combination of these systems together, which confers numerous advantages in comparison.
One such advantage is the use of combined and flexible properties of these systems. For instance, natural gas grids can store energy easily and cost-effectively. The electricity system can transfer energy from long distances with relatively little loss. Therefore, aggregating these two grids and exploiting the advantage of each will promote system confidence and efficiency and lead to optimal performances for each as well [5]. Several flexible capabilities in the structure and operation of MGs require a comprehensive framework for explaining the effects of combining various energy carriers on economic and technical indicators of energy systems.
In recent years, such a framework has, in fact, been discussed in general to provide a combination of various energy carriers, conversion and storage to supply the consumer-side load [6]. In [7], an energy management system was proposed for a grid-connected MG with different renewable energy sources (RES), at its disposal, including photovoltaic (PV) and, wind turbine (WT) systems, as well as and a battery energy storage system (BESS). A mathematical model was presented for this PV system which. This model evaluated the effects of solar irradiation in different days and seasons on the MG programming.
In [8], a bi-level energy management strategy was proposed to optimize the MG cost of operations and uncertainty management. This method was tested on a standard system with different scenarios. In [9], a combined independent MG system comprising a battery, RES such as wind and solar energy (FC), and an energy storage system (ESS) was introduced. A battery state of charge (SOC)-based energy management strategy was developed and experimentally implemented to maintain energy balance in the combined system. In [10], a multi-objective evaluation of the performance of an MCMG was presented in the presence of technologies, including CAES and P2G storage systems. This model aimed to minimize operation cost and environmental pollution.
In [11], the MG operation with a focus on ESSs was explored. This paper performed 24-h scheduling for different units, in which RES fluctuations were examined. In [12], an energy hub system comprising several parts was used. The electrical energy hub comprised a combined cooling, heating and electrical energy system integrated with RES such as WT and PV systems. ESSs were also used to coordinate and improve confidence in the entire system. The proposed model aimed to examine the effects of a time-based demand-response (DR) program on reducing operating costs and CO2 pollution.
In [13], a robust operational model and an investment model were proposed for participating in supplying the power and heating demands of a distribution system-connected MG. The optimization algorithm decided on the best investment and operation of a combined heat and power (CHP) system, boiler, PV power generation and BESS. In [14], a stochastic framework was provided for optimally scheduling MGs by considering the islanded mode. In this approach, different uncertainties were taken into account and the daily scheduling of resources was determined by considering emergency conditions.
In [15], two-level stochastic programming was introduced while considering solar and wind sources, ESS and DR under probable outages of generation units. The uncertainties in the problem were modeled through scenarios and the intended scenarios were generated by the Monte Carlo method. Constraints on the participation of units were included in the first stage and constraints on the units’ optimal distribution and DR were included in the second stage.
In [16], the participation of an aggregator of a hybrid power station comprising WT and responsiveness loads was enabled to achieve the best presentable bid to the market for maximizing profits by using risk-based three-stage programming. In [17], a two-storage energy management strategy was designed for an MG with RES, ESS, residential and industrial loads, which can predict the stochastic electricity demand and electricity price based on operational uncertainties. In [18], a two-stage stochastic model was proposed for MG energy source management based on RES generations, EVs and market price uncertainty.
In [19], a two-stage stochastic framework was presented for short-term MG operation scheduling, including electricity and natural gas grids, composed of an energy hub, RES and ESS, while considering predicted uncertainties. In [20], a probabilistic optimization model was presented on a multi-carrier MG. Dispersed generations (DGs) and converters such as transformers, simultaneous generation converters, boilers, solar and wind power stations, as well as battery and heating systems were included in the proposed MG.
In [21], a multi-objective distribution problem was solved in an MG, including cost and emission minimization, while considering DR programs and uncertainty. A probabilistic framework based on scenarios was considered to overcome the uncertainties in MG optimal energy management. In [22], a multi-energy MG that could simultaneously provide electric and thermal energy to the customers was presented to improve energy consumption efficiency. Still, the alternation and uncertainty caused by the generation of REs such as wind turbines, solar PVs, and thermal loads that depend on electricity and heat could seriously challenge and complicate the performance of these grids.
In [23], a hydrogen-based CCHP-MG (combined cooling, heating and power microgrid) was proposed. The proposed grid contained a CHP unit and other energy generation and storage units. In this grid, the CCHP-MG operator could actively participate in electricity, natural gas and heat markets. In [24], a Monte Carlo simulation method was used for stochastically modeling the real-time market price profile.
A new model based on Demand response-based microgrid planning has been proposed in [25]. The novel multi-step model is proposed in [26], in which, in the first step non-cooperative game theory is applied to illustrate the behavior of the grid, demand response and end-customers. In the second one, the optimal amount of energy transmission between the microgrid and the main grid is calculated. In the third step, the optimal resource placement for energy generation including energy storage systems based on economic factors is determined. In the final the technologies are proposed based on economic factors to energy conversion systems that have been studied.
In [27], to achieve the optimal management strategy based on cost factors, an integrated offering technique model in deregulated power market has been proposed. The novel optimal management energy system based on electric/thermal power for buildings energy has been proposed in [28]. At first, this model is applied to one building with multiple energy sources of operation, and in the next step its applied to multi-building with multi-energy sources. The model of this paper is based upon mixed-integer linear programming.
A demand-side management system based on game theory approach is proposed in [29]. In this modeling of the problem, the capacity constraints of sources and loads, environmental factors, and reliability factors are considered beside demand management. In [30], the dynamic behaviors of grid-connected microgrid systems were studied. This paper considered and contains two different systems contains; integrated PV systems and urban wind turbines.
Yet the previous literature has not adequately examined the electricity purchase/sales bid in a multi-carrier MG while considering the dependency of the electricity and gas grids. Moreover, the effects of different uncertainties in load and generation have not been investigated on the multi-carrier cost of MG operation. Since various uncertainties on MG optimal operation directly affect the forward purchase and forward sales of energy, it is important to investigate an optimal strategy for reducing the cost of MG operation. Also, in the presentation methods in the articles, the possibility of being located in local points increases with increasing the number of variables of the desired problem. Therefore, the proposed classical methods cannot guarantee an optimal answer.
Thus, the present paper presents a probabilistic optimization model for a multi-carrier MG. The levels of DGs, the electric and thermal loads as well as the electric prices in the previous-day and real-time markets have uncertainties; therefore, this paper presents a probabilistic converter compatible with the energy distribution strategy in the multi-carrier MG. The previous-day and real-time markets are also examined. In the proposed grid, energy sales/purchase bids are presented in a multi-carrier MG as a two-stage model.
Based on the provided explanations, the most important highlights of this article are:
A) Provide an extended harmonization search optimization algorithm by the local operator enhancement
B) Provide a two-step strategy to propose the optimal amount of electricity sales despite the dependence of electricity and gas prices in the market
C) Modeling the uncertainty of renewable units based on scenario generation and its reduction
The rest of the article can be organized in the following sections. In the second part, multiple microgrid hardware with the presence of related energy is expressed. In the third part, probabilistic modeling of load and renewable resources is stated. In the fourth section, the problem formulation and its objective functions and constraints are mentioned. In the fifth section, the developed algorithm of harmonic search is presented. In the sixth section, the production and reduction scenario is stated to take into account the uncertainty of renewable sources. In the eighth section, the results and analysis of the simulation are presented. Finally, the conclusion is stated in the ninth section.
2 Structure of the Multi-Carrier MG
A multi-carrier MG is defined as interconnected loads and DGs within energy infrastructure. Multi-carrier MGs are a separate region from the main grid and act in grid-connected or islanded modes. In this paper, Fig. 1 shows the multi-carrier MG with the electricity and natural gas grid infrastructure, energy hub system, RES and battery. Here, the energy hub system connects various resources, e.g., electricity, natural gas as well as electric and thermal loads. The proposed MG is connected to the upstream electricity and gas grid and can also work in the islanded mode. To facilitate the operation, a central controller is included in the MG that collects information from each local controller, e.g., the status of DG and loads and, if necessary, issues commands for optimal operation of the MG. In fact, this central controller performs the optimal operation of the MG based on the status of DG, predictswind speed, solar irradiation and loads, and then dispatches the energy distribution signal to the local controller of each MG. The independent MG operator manages this central controller.
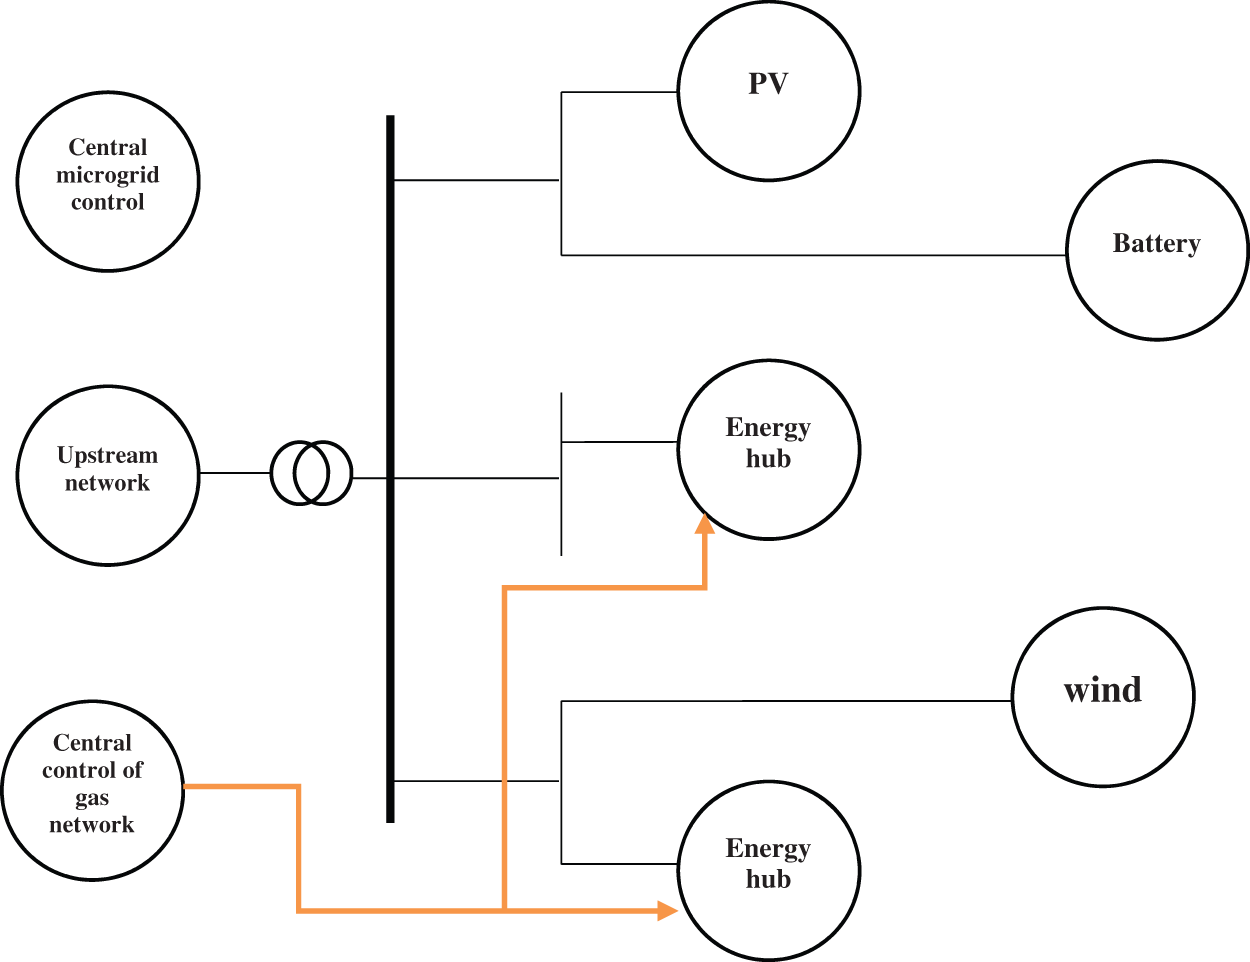
Figure 1: Multi-carrier MG
The energy hub system facilitates the conversion of energy carriers. The energy hub connects various energy sources such as electricity and natural gas, and different loads (e.g., electricity and heating) to one another. The hub comprises a transformer, boiler and simultaneous electricity and heat generator, receives natural gas and electricity from the upstream grid as the input and supplies the consumers’ demanded electricity and heating as the output.
3 Probabilistic Load, Electricity Price and RES Modeling
Herein, electric and thermal loads are modeled as follows Eq. (1) by using a normal distribution function with a mean equal to the baseline load in each period and a standard deviation (SD) of 5% of the baseline load [20].
3.2 Electricity Price Modeling in the Previous-Day Market and Real-Time Market
The statistical analysis shows that the general distribution logic is the most appropriate model and confirms the proposed strategy in the analysis. Thus, the log-normal distribution function with the mean equal to the baseline electricity price in a certain interval and the SD of 5% of the baseline price is used for modeling the electricity market in Eq. (2) [25]:
3.3 Electricity Price Modeling in the Previous-Day Market and Real-Time Market
Two distribution functions are applied to model the uncertainties in the wind and solar units. The output power of the wind generator depends on the wind speed with zero fuel costs. The wind speed changes in real-time, which highlights the importance of a probabilistic model. The literature usually uses the Weibull normal distribution function for wind speed (Eq. (3)).
The output power from the wind farm in any interval is calculated via the wind power-wind speed curve that expresses in Eq. (4) [20,21]:
The power generated from a solar unit differs with solar irradiation that depends on various factors such as environmental conditions, time, day, month, season and orientation of the solar plant towards solar irradiation. Herein, solar irradiation is modeled via a beta distribution function, expressed in Eq. (5).
The solar generator of the output power belongs to solar irradiation; therefore, output power modeling needs solar irradiation modeling. The output power of the solar station as a function of irradiation in any interval of the irradiation-power curve is calculated in Eq. (6) as:
This section deals with the proposed strategy (sales and purchase) in the previous-day and real-time energy market in stochastic conditions. The proposed strategy refers to the amount of energy purchased or sold in the previous-day market. Based on different uncertainties in the predicted system data, it is challenging to find an optimal approach to dealing with this. In the proposed model, electricity and gas can be exchanged between the proposed multi-carrier MG and the upstream grid, which plays a major role in the energy market by accessing real-time data. The price-setting entities make their bids (including the electricity sales/purchase and hourly price) the previous day to the distribution system operator.
The bids to the distribution system operator are based on the previous-day market price, and generation and consumption predictions are based on the prediction data. After settling the market with the distribution system operator, generation and consumption may vary due to the stochastic nature of the variables; thus, the consumer must actively participate in the real-time market to balance loads in real-time. Note that the prices in this secondary market differ from the previous-day market. Since the size of the multi-carrier MG is smaller than the grid, it is assumed as a price-receiving entity. In the proposed model, based on the information in the previous-day market such as the predicted electric and thermal load, RES generation, electricity and gas price in the previous-day market, the program is simulated once, and the price function and the optimal amounts of energy sales and purchase in the previous-day market are obtained. Then, first-stage variables such as the optimal energy sales and purchase in the previous-day market are assumed as second-stage parameters. In the second stage, the real-time market model is simulated based on various uncertainties such as electric and thermal loads, RES and real-time market price to strike an energy balance and settle the market each hour.
The main resources include uncertainty, previous-day price, real-time price, RES and loads. Due to the six types of uncertainty in the proposed problem, this paper uses stochastic optimization. Thus, to examine the effect of uncertainty on the MG operation strategy, a Monte Carlo simulation is performed to generate random scenarios. By using scenario reduction methods (Kantorovich distance-based backward reduction), the scenarios generated by each parameter are reduced to three scenarios in order to reduce the computational load.
4.1 First-Stage Objective Function
There are six sources of uncertainty in the proposed multi-carrier MG: previous-day and real-time prices, solar and wind generations, as well as electric and thermal loads. The proposed grid presents energy sales/purchases in a multi-carrier MG as a two-stage model. In the first stage, the MG presents the hourly energy purchase and sales to the distribution system operator without considering uncertainties. After settling the market, the MG programs generation for day-ahead MG operation is based on deterministic parameters. In the second stage (real-time operation), by considering the confirmed previous-day sales and purchase bids, the MG operator uses the resources to balance the generation and consumption due to uncertainties. In fact, this stage precedes the real-time market settlement in each hour; therefore, the units’ level of generation, ESS charge/discharge and energy sales/purchase in the real-time market are optimized. This model is a mixed-integer linear problem, in which the objective function and constraints of the proposed multi-carrier MG are modeled for 24 h in each scenario. In this model, the objective function is to minimize the energy sales and purchase costs as well as maintenance costs of the equipment. The minimization objective function is modeled as Eq. (7) [20]:
where the first term is the energy purchase costs or sales profit in the previous-day market per hour. The second term is the natural gas purchase cost to supply the gas fuel-consuming units that are in charge of supplying electricity and heating to the MG. The final term is the equipment maintenance costs modeled in Eq. (8) as follows:
In Eq. (8), each units’ maintenance cost is calculated by multiplying the generation of each unit by the maintenance cost coefficient per hour.
The following equations show the MG equipment conversion/generation equation. In this MG, energy conversion is performed by a transformer modeled in Eq. (9). The generated energy by the simultaneous generation converter and the boiler is presented in Eqs. (10) and (11), and depends on the purchased gas and equipment efficiency. The heating system is formulated in Eq. (12) [20]:
Battery modeling is formulated in Eq. (13) such that Eq. (14) prevents simultaneous battery charge/discharge. In Eq. (12), for sustainable use of the battery, the amount of energy at the first and last moments of the day must be equal, as shown by Eq. (15):
Eq. (16) presents the electric and thermal load balance that must hold for each scenario in each hour. (16) shows that the electric load and electricity required for supplying the heating system can be supplied by the upstream grid, CHP generator, wind and solar power stations and battery. Based on Eq. (17), the thermal load can be supplied by the CHP generator, absorption chiller and heating system.
The upper and lower bounds of each unit, e.g., transformer capacity, CHP generator, boiler, heating system, ESS and the battery charged/discharged energy, are in Eqs. (18)–(23):
Eq. (24) models the input gas coefficient to the CHP generator and the boiler.
4.3 Electricity Price Dependence on Gas
The high sensitivity of the previous-day and real-time electricity prices to gas supply was demonstrated vividly in the winter of 2014. Although this electricity price follows the natural gas price model, their relative dependence must be the starting point for creating proper interdependence models; still, the real-time market electricity price depends on many other factors, a few of which can be measured by available data; e.g., natural gas price in the real-time market, the effect of gas pipe capacity, load model deviations and load responsiveness, RES penetrability and previous-day market electricity price, each somehow affecting the real-time market electricity price. Finally, to determine how various factors affect future and real-time electricity prices in the mentioned periods, the correlation coefficient of electricity prices and different factors are calculated in each local hub. The carriers’ price dependence is demonstrated with Eq. (25), in which the y-axis shows the previous-day and real-time market prices. The x-axis shows the load prediction error, wind prediction error, natural gas price or previous-day electricity price.
Coefficients 1β and 2β denote the best line for carrier dependencies.
4.4 Second-Stage Objective Function
In this stage, the first-stage variable (the forward purchase/sales of electricity) is placed in the second-stage objective function as a constant parameter (first term), and the electricity shortage/surplus is traded on the real-time market (second term). In this stage, all the uncertainties are taken into account and the MG operator can sell the forward purchased surplus electricity on the market in real-time. Eq. (26) shows the second-stage objective function.
All the constraints mentioned above, except Eqs. (27) and (28) which have been changed, hold. Thus, in this stage, the electricity purchased in Eq. (27) changes, as the result of which the electricity load balance is altered based on Eq. (28).
Based on Eq. (27), the total electricity purchased from the grid is the sum of the electricity purchased from the previous-day market and the real-time market.
The harmony search algorithm (HSA), also known as the soft computing algorithm or evolutionary algorithm, is inspired by the formation and performance of an orchestra to look for the optimal solution, or simply put, the best coordination between the factors involved in leading a process. Musicians in an orchestra play musical pieces, the best combination of which creates the best final product. Likewise, HSA looks for optimal coordination when examining the result of components’ performance and looks for the best path in solving optimization problems, with which the computational cost functions can then be reduced by [25]. The stages of the HSA are:
• Determining the problem and algorithm parameters
• Initially determining the harmony memory
• Generating a new harmony
• Updating the harmony memory
• Examining the algorithm stop region
1) In the first stage, the optimization problem is determined in Eq. (29):
Here,
2) Initial determination of the HM
In this stage, the HM matrix is randomly generated with a large number of solution vectors and is filled based on the HMS, that shows in Eq. (30) [15]:
3) Generating a new harmony based on improvisation
A new vector
HSA selects the value of the decision variable from the entire range of possible values. The obtained solutions from the memory requirements are tested to determine whether this pitch adjustment is more appropriate or not, which is done using the PAR parameter, which is defined in Eq. (32):
If the decision for pitch adjustment is Yes, ‘xi is replaced in Eq. (33):
where
4) Updating the HM
If the new harmony vector
5) Checking the stop area
If the stop area, i.e., the maximum number of improvisations, is satisfied, calculations end; otherwise, Stages 3 and 4 are reiterated. The flowchart of the proposed algorithm is shown in Fig. 2.
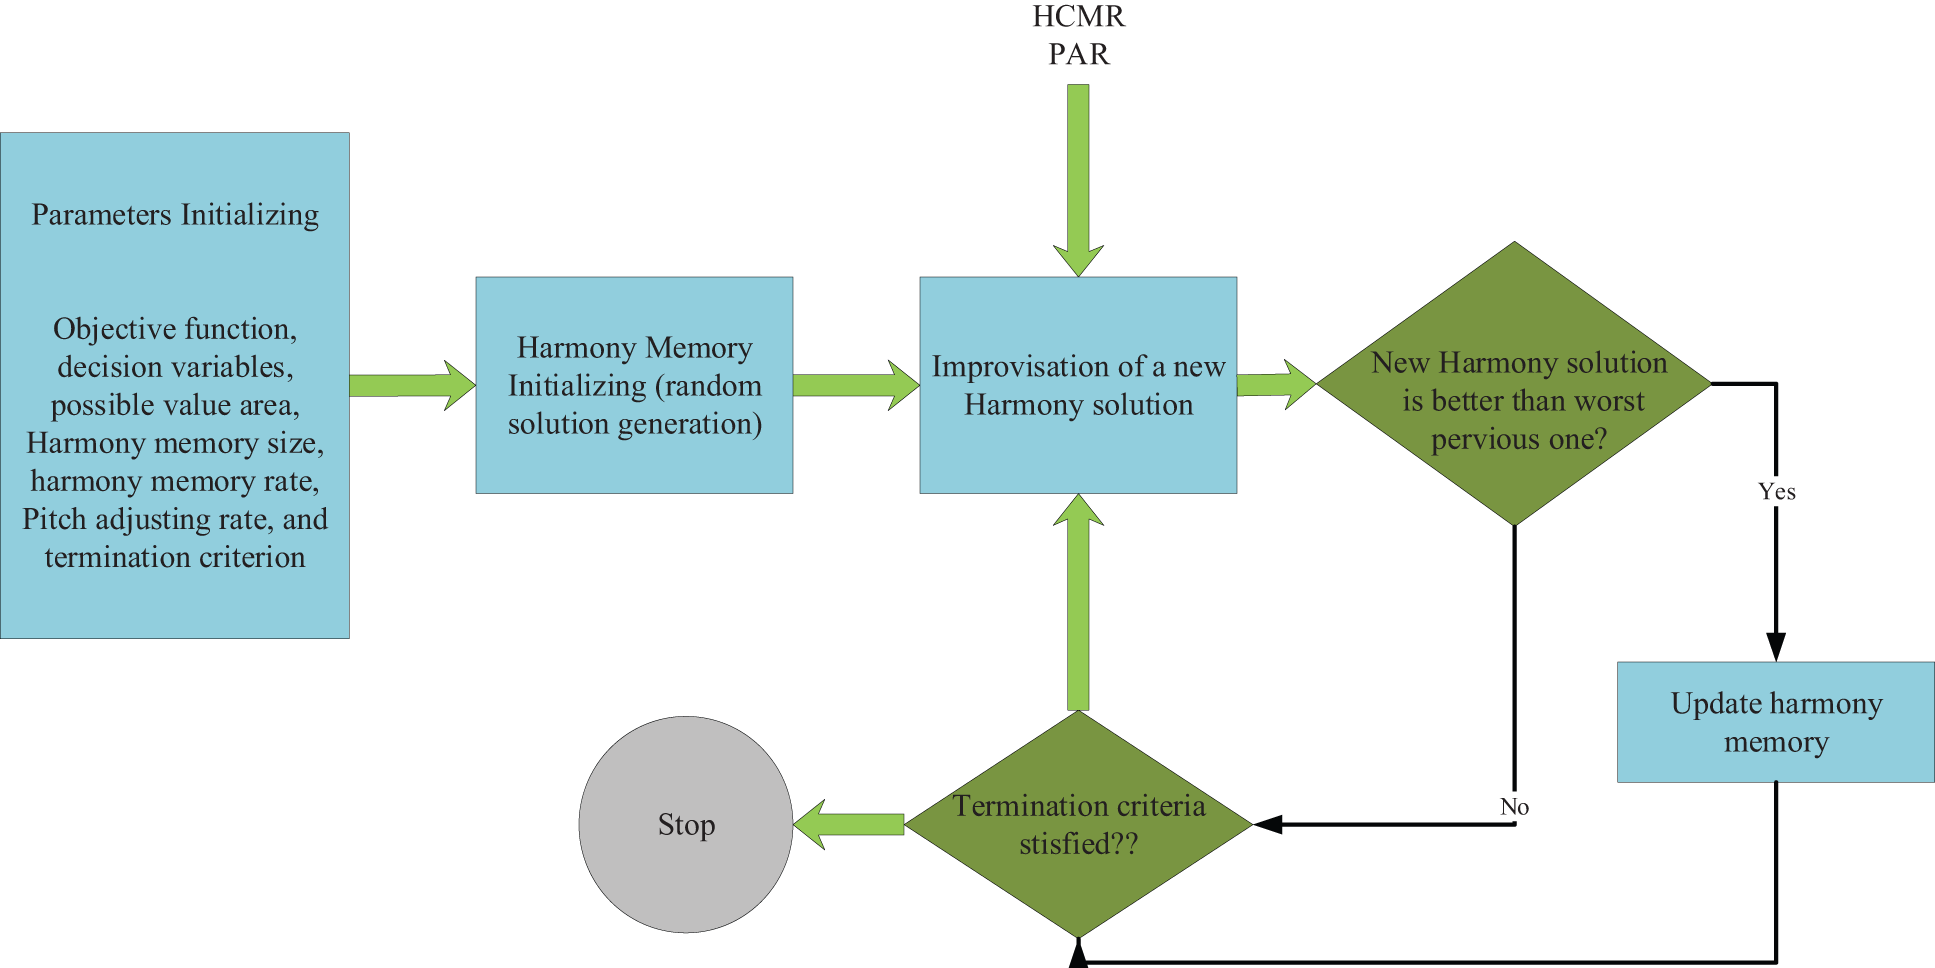
Figure 2: Flowchart of harmony search Algorithm
LHS is a group sampling method. Since the Weibull distribution function of each stochastic variable is known, the sampling stratification is done with the sampling delay mean to ensure the integrity of sampling data and increase the volume of data. For each uncertain parameter, the Weibull distribution should be classified into several parts. Herein, the LHS method is adopted for scenario generation, as shown below:
Step 1: Determining the number of scenarios and, then, dividing the probability distribution of each uncertain parameter into N levels;
Step 2: Selecting the mean value from the probabilistic distance
Step 3: Calculating the values of the sample of wind speed, solar irradiation, electricity price and electric charge based on the inverse cumulative distribution function.
To create knowledgeable choices withinside the existence of uncertainties, threat control issues of electricity utilities can be simulated through multistage stochastic packages. These packages utilize a hard and fast bevy of situations (or potential realizations), as well as taking into consideration the corresponding changes to the version of the multivariate random statistics procedure, e.g., electric demand, stream flows to hydro units, the output of production in intermittent clean sources, fuel and electricity prices. To show the involved uncertainty, the number of scenarios is demanded while, reduction scenario approaches are often used because of computational complexity and time limitations. This work suggests a novel model for to recursive backward scenario reduction is possible regarding next-day scenarios to generate wind power. Therefore, a set of the initial scenario set is determined by the following algorithm and assigns new probabilities to the stored scenarios. The output is planned to assist production scheduling of power systems employing intermittent type clean energy sources.
Backward scenario reduction is a positive method for reducing the number of scenarios. This technique provides a set of scenarios to estimate their primary set.
Considering
Step 1: Take S as the primary set of scenarios and DS is the set of scenarios that should be eliminated. The primary DS is zero. Calculate the distance of all the scenario pairs:
Step 2: For any scenario k,
Step 3: Calculate
Step 4:
Step 5: Repeat Steps 2–4 to eliminate the intended number.
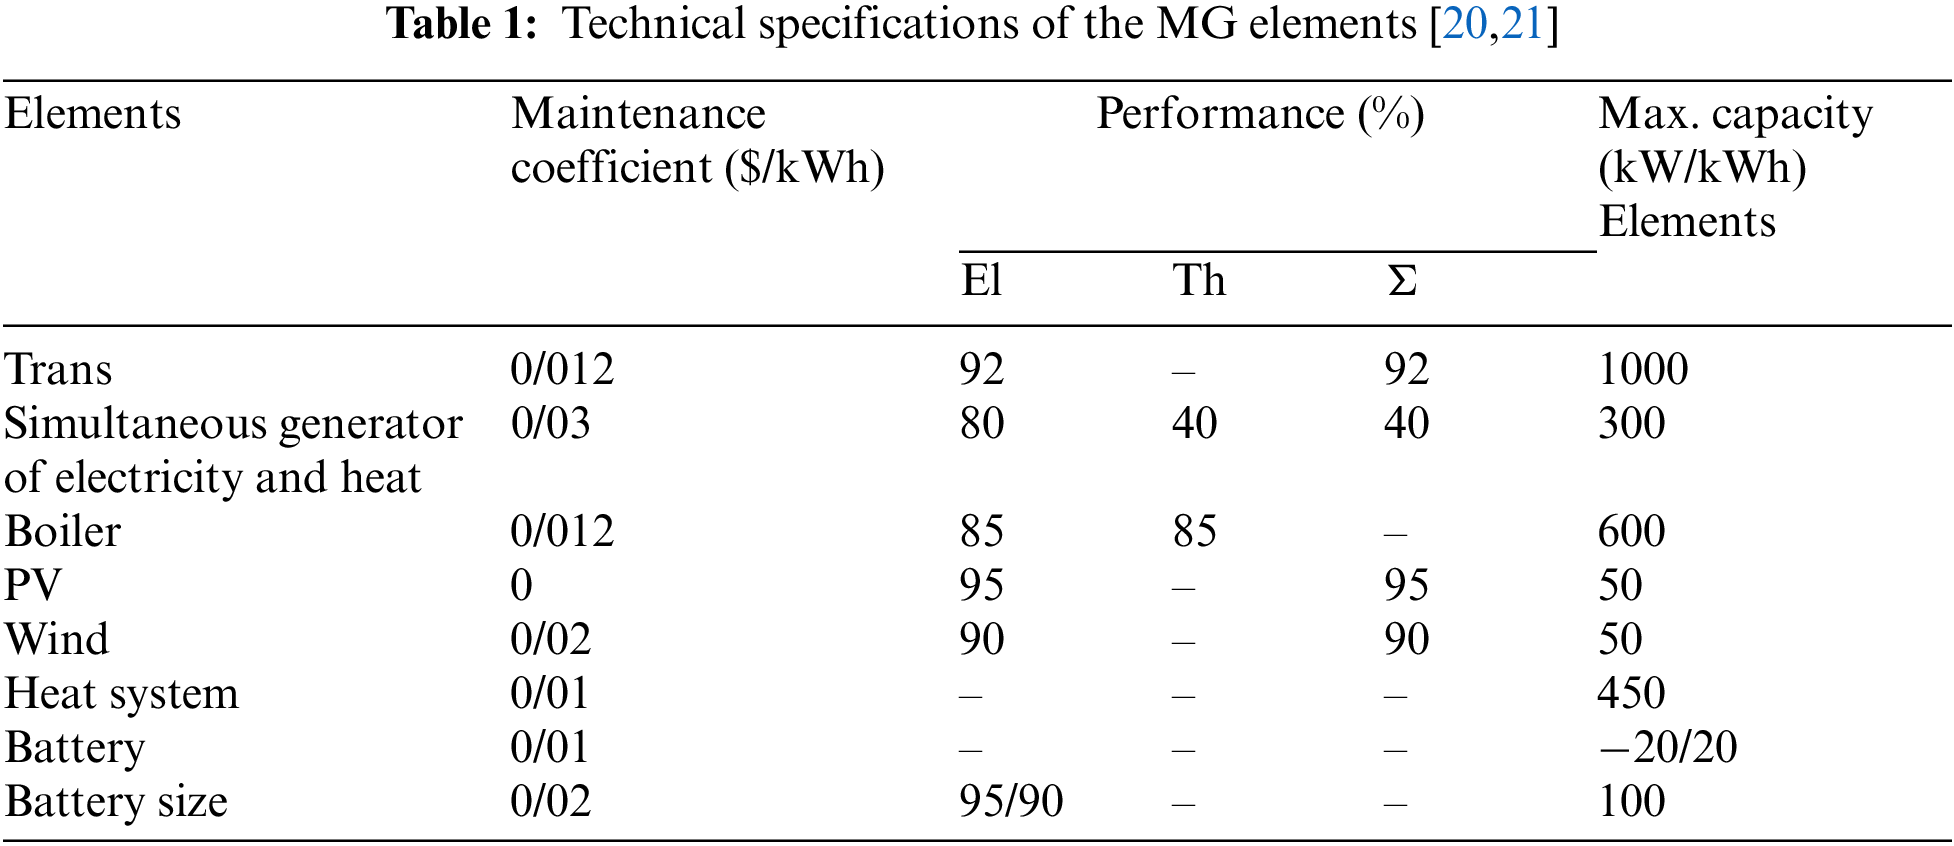
A multi-carrier MG is a system that boosts energy flexibility. To respond to different forms of demands, the multi-carrier MG is equipped with energy converters, generators, and ESS. Fig. 1 illustrates the structure of a multi-carrier MG. Each multi-carrier MG comprises small-scale energy sources, several demands and a battery. The small-scale energy sources include PV and wind power stations, a boiler, CHP generator, transformers and a heating system. Table 1 lists the technical specifications of the equipment in this MG.
In this simulation, the number of scenarios for each parameter is reduced to three scenarios by using the introduced method. The data of electric and thermal loads, wind and solar generations, previous-day electricity price, and real-time electricity price for the three scenarios are presented in Figs. 3 and 4.
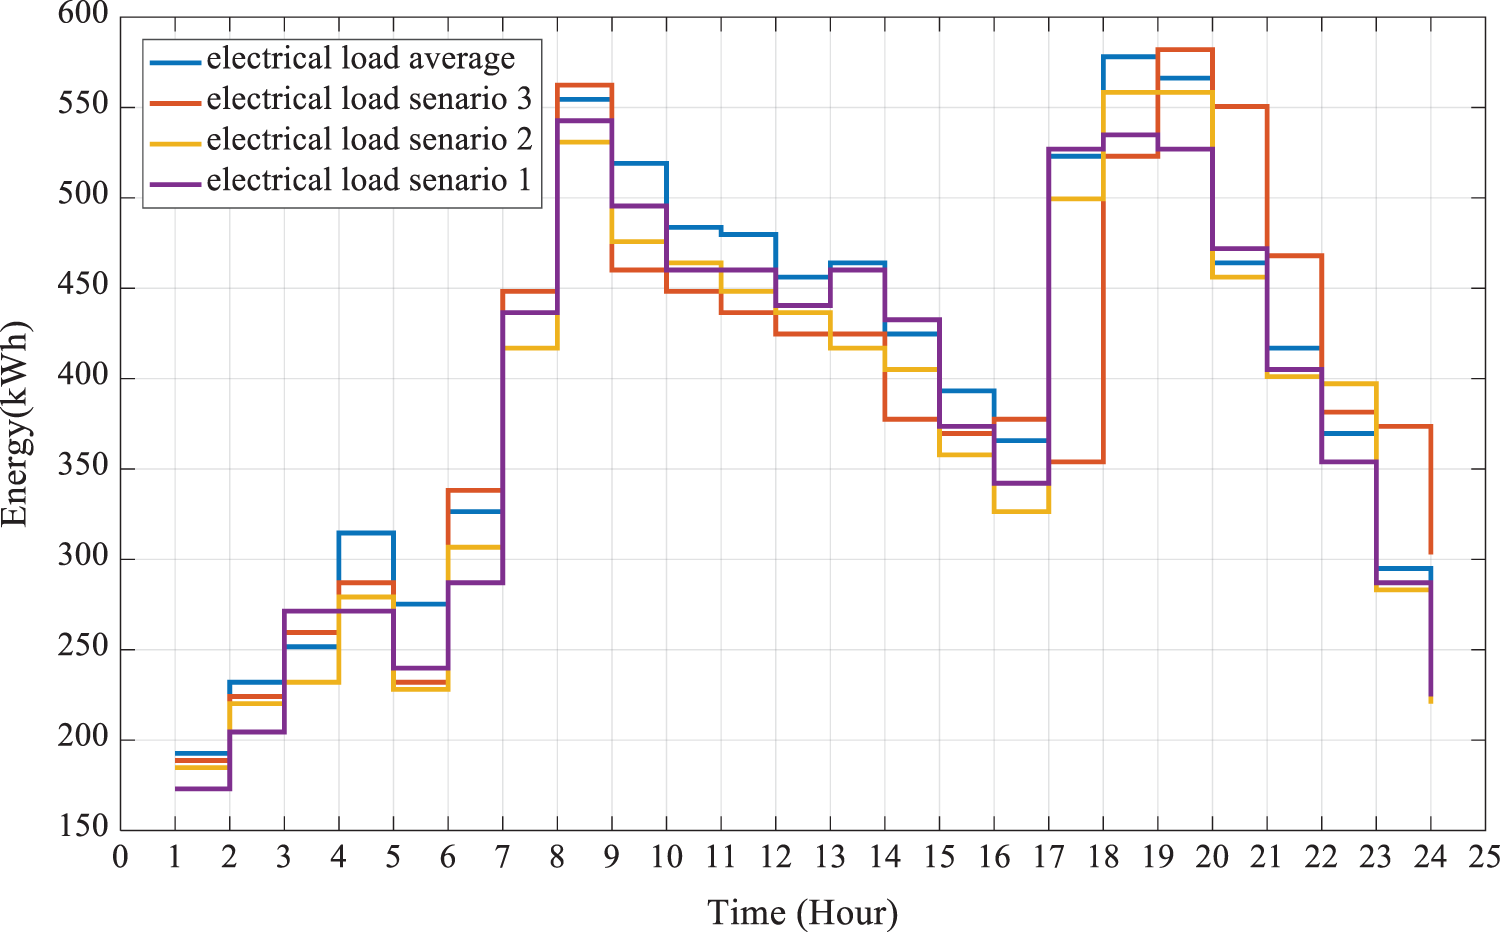
Figure 3: Electric load curve
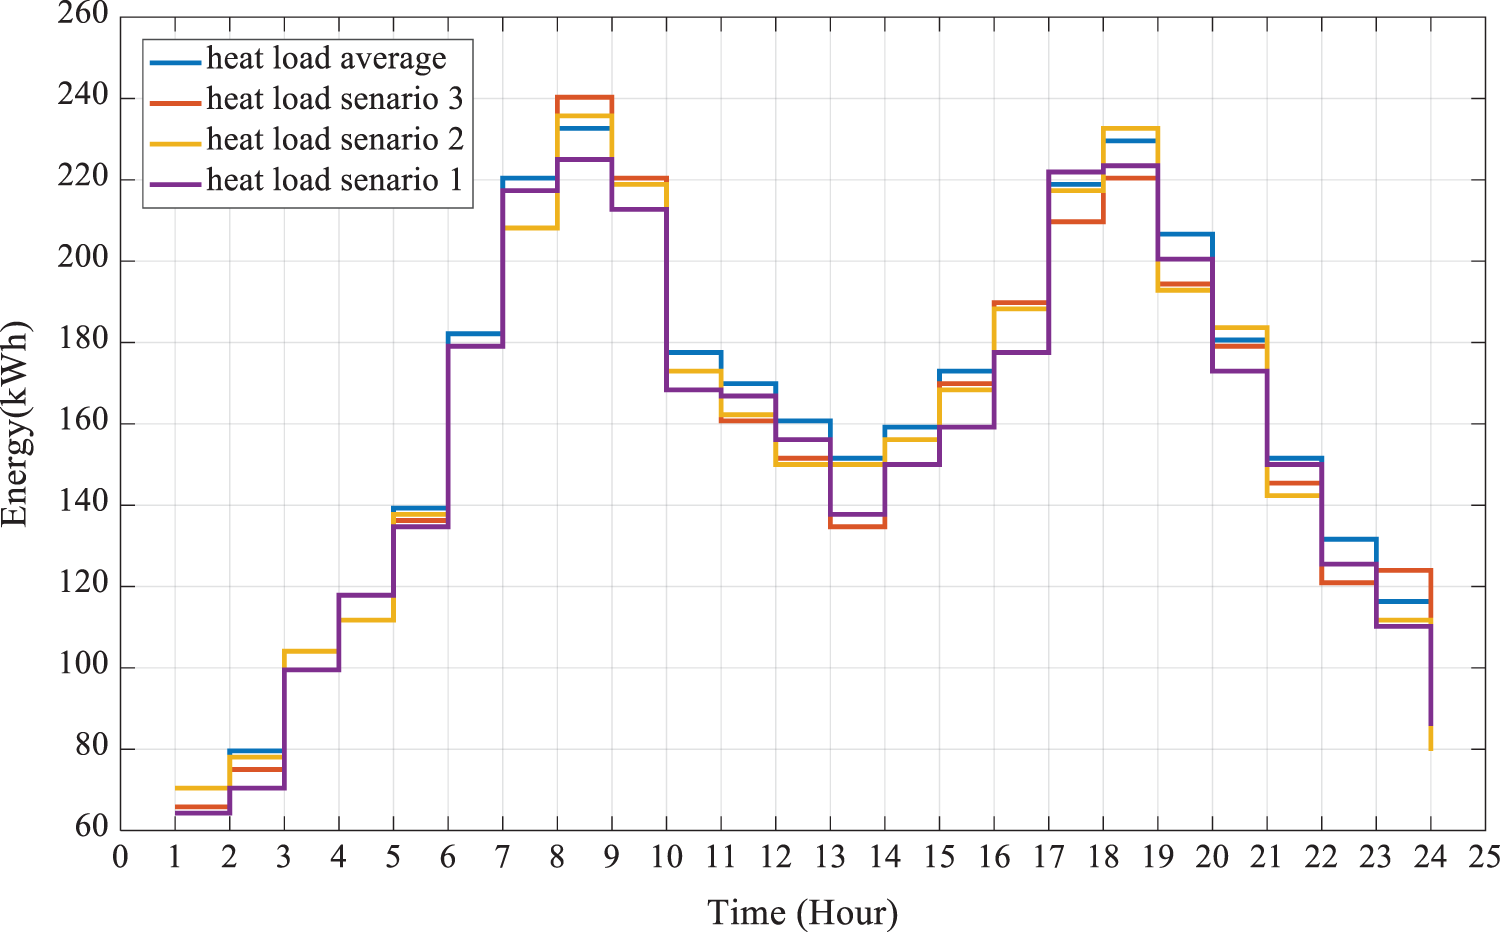
Figure 4: Thermal load curve
The electricity and natural gas prices for the three scenarios are given in Fig. 5.
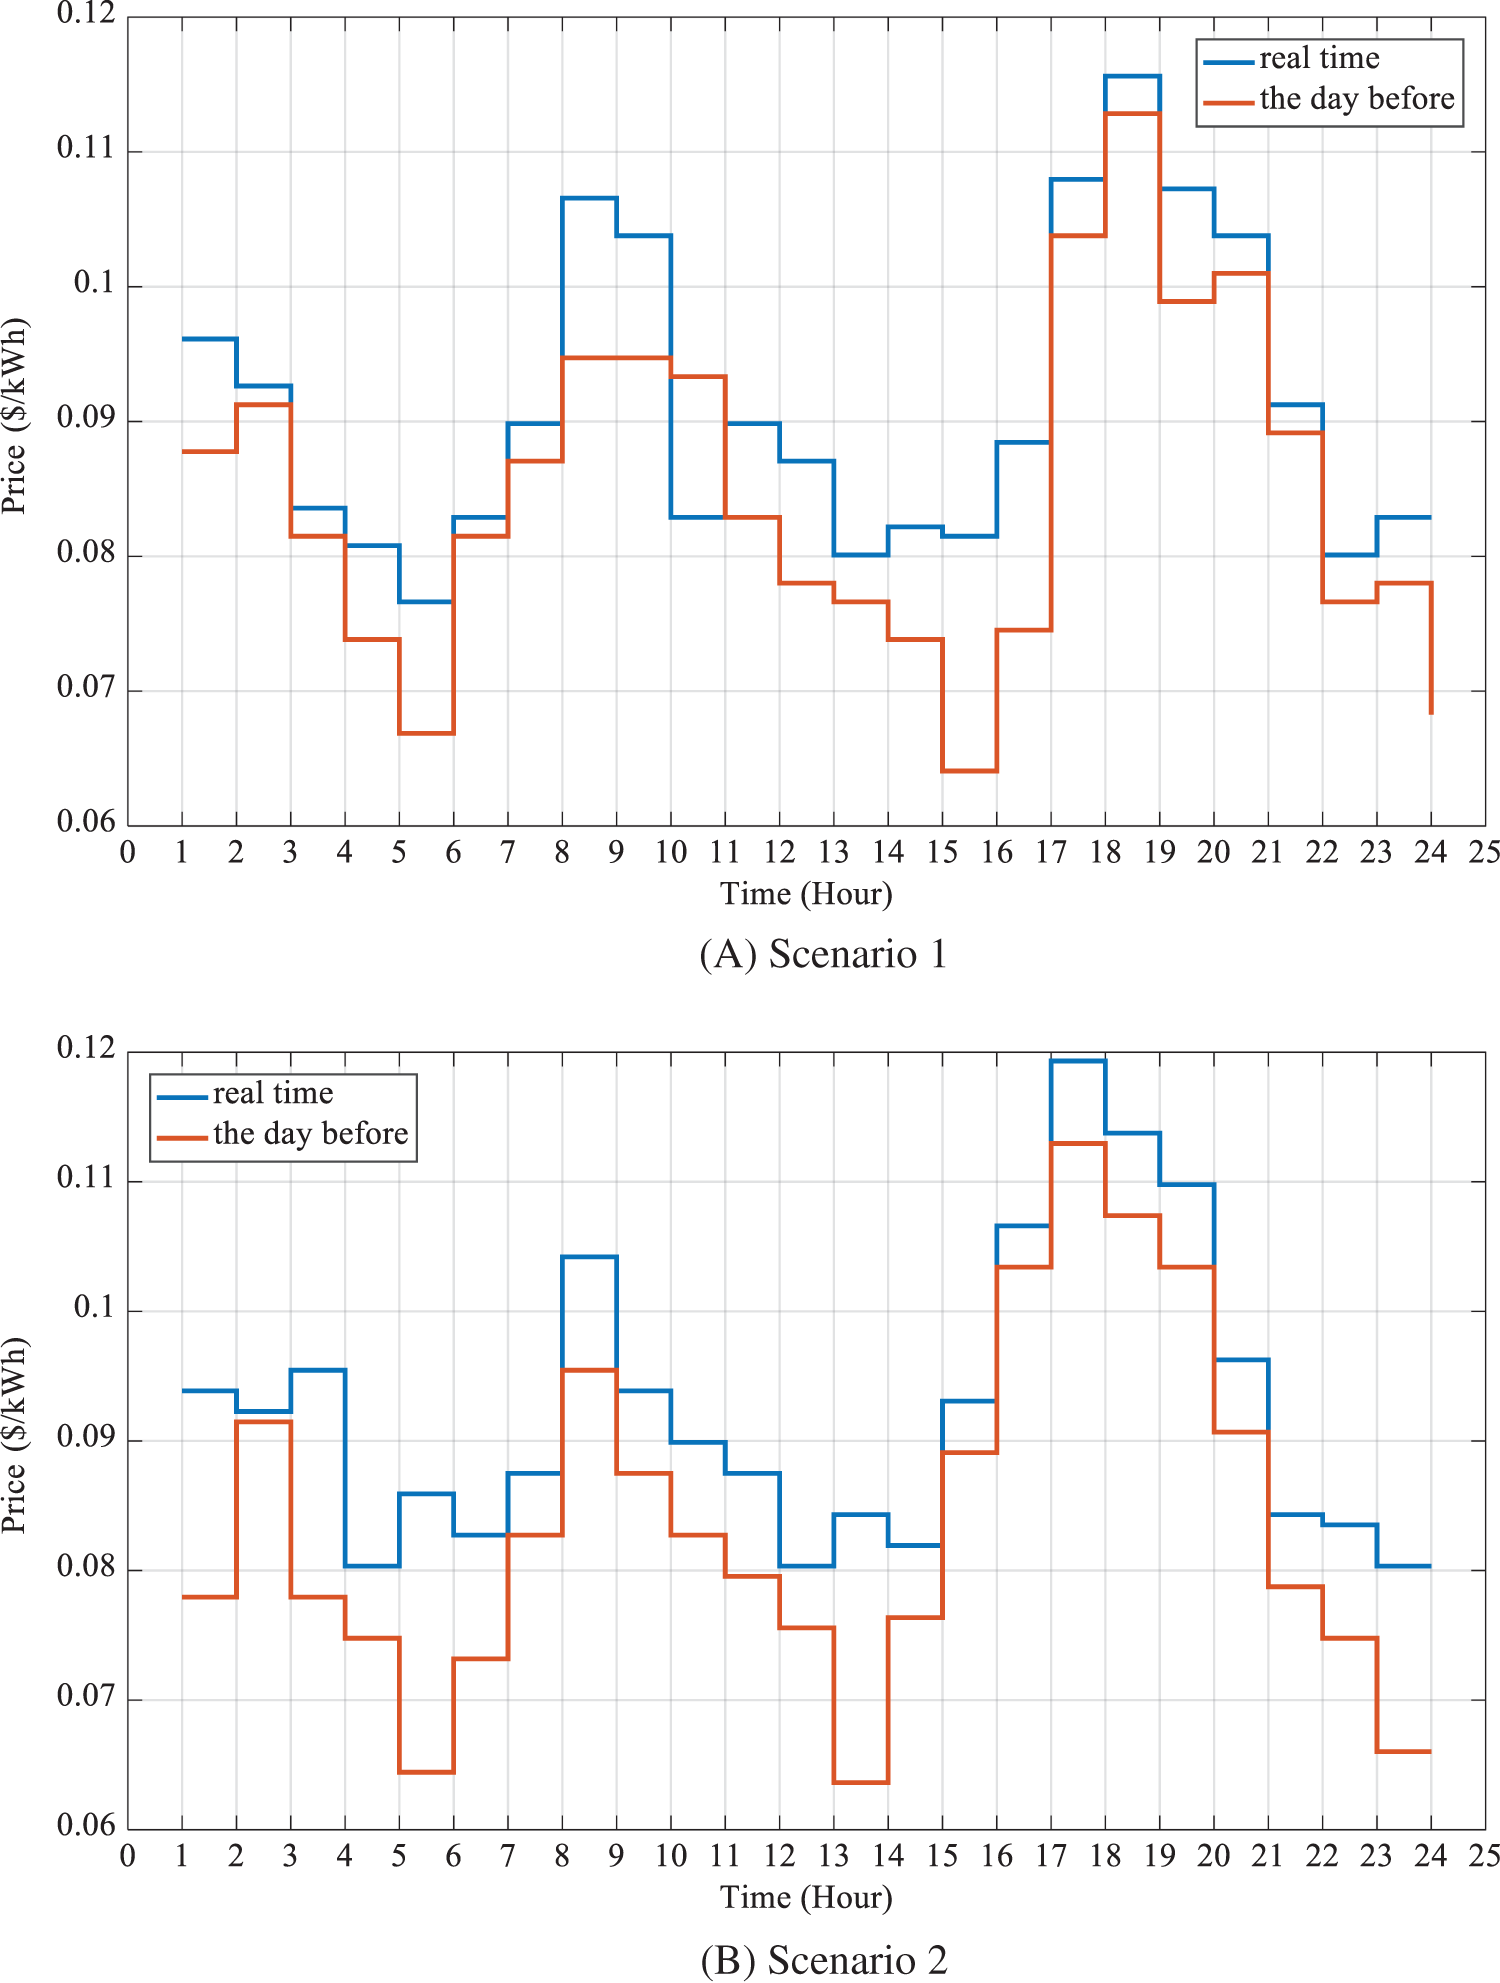
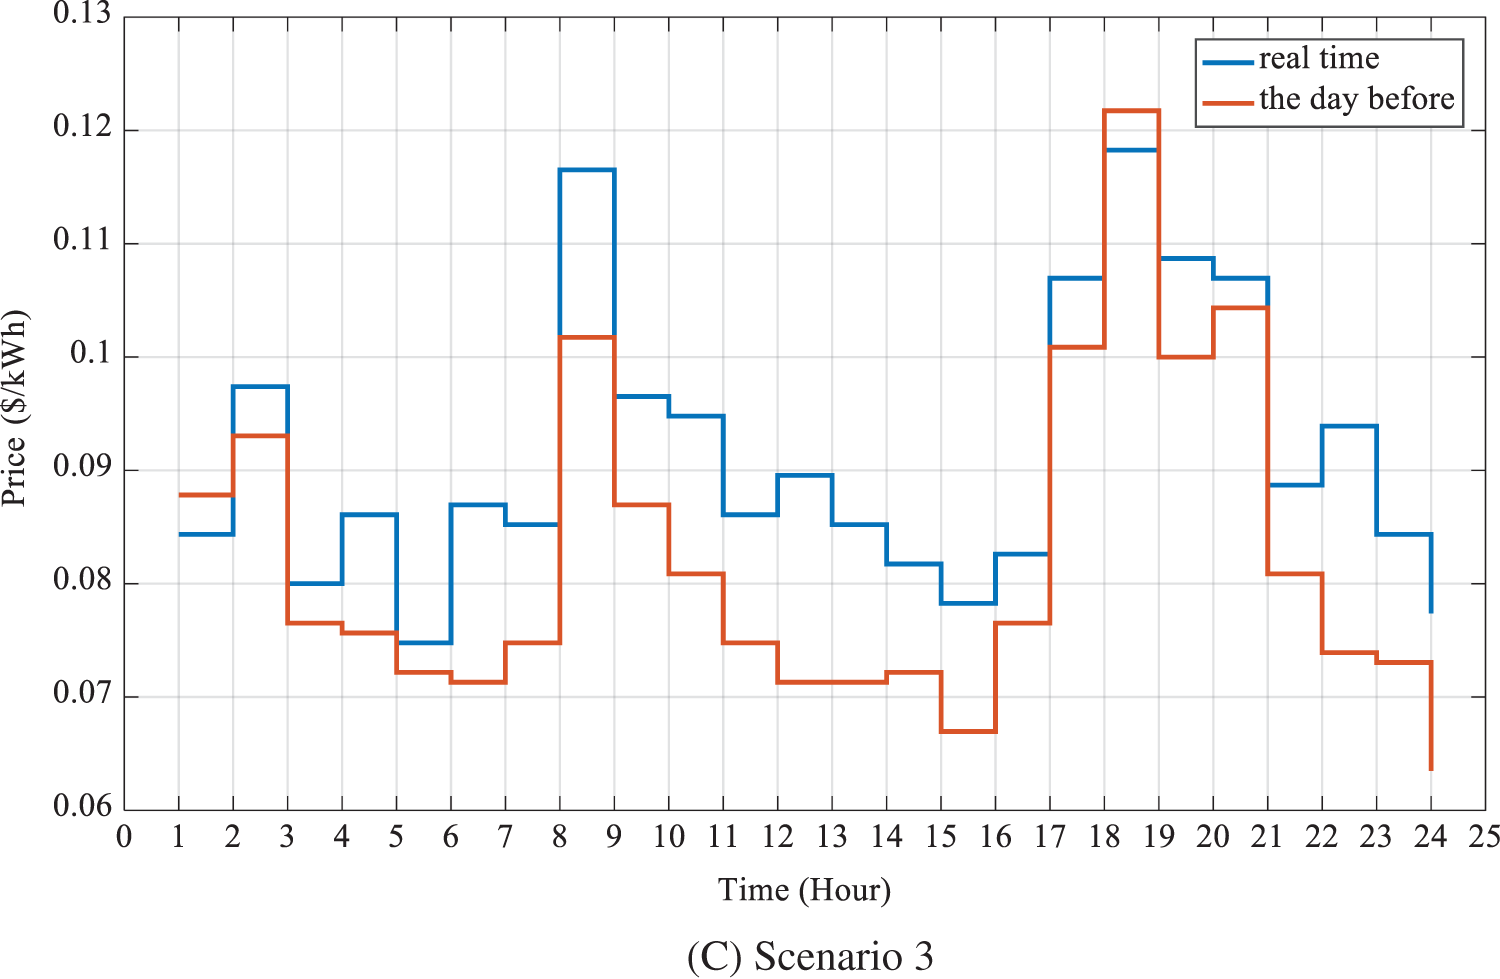
Figure 5: Electricity price for three scenarios for previous-day and real-time modes
Solar and wind units’ generation for each scenario is depicted in Figs. 6 and 7.
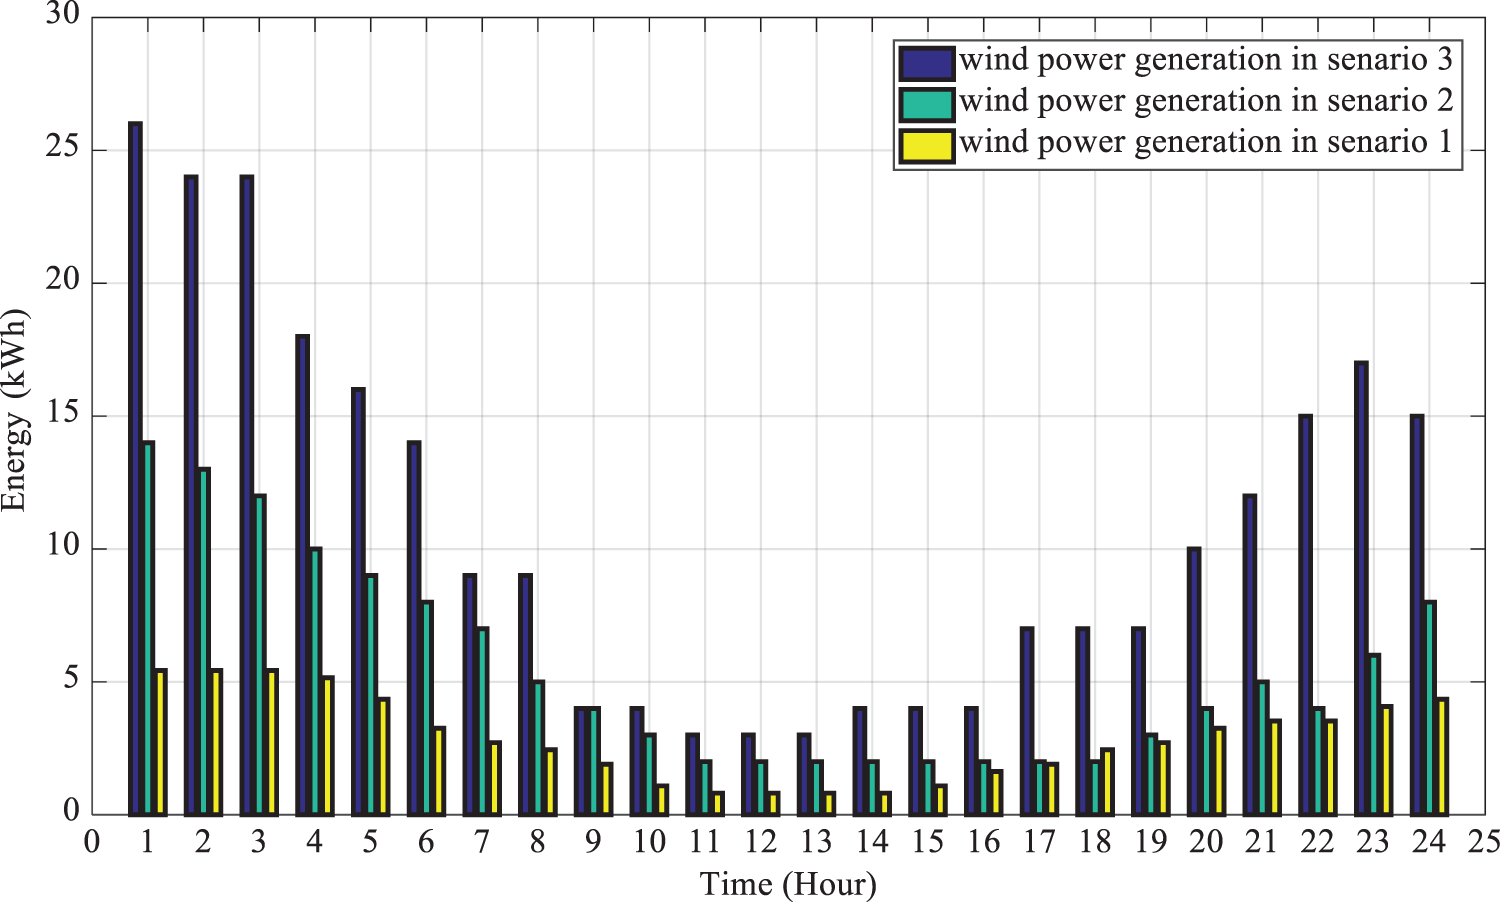
Figure 6: Power generated by the wind power station
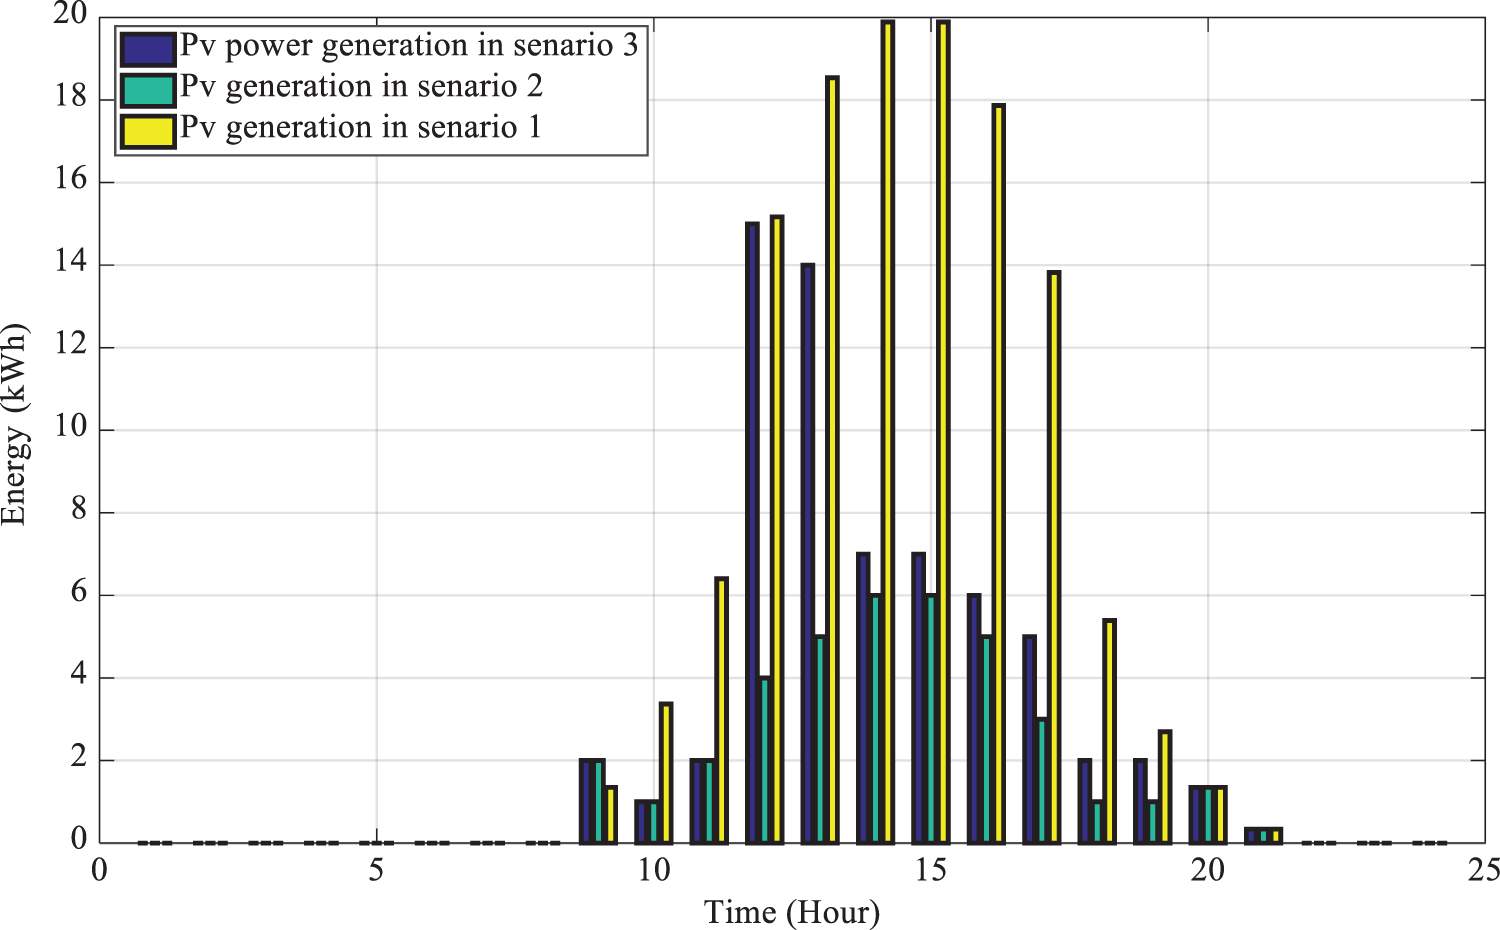
Figure 7: Power generated by the solar power station
The simulation results are presented and discussed in this section. The bidding strategy problem in the multi-carrier MG is applied to implemented on the proposed grid. Seven modes are considered to evaluate the model.
Mode 1. Purchase and sales strategy with previous-day and real-time electricity price uncertainty
Mode 2. Purchase and sales strategy with all the uncertainties in previous-day and real-time electricity price, electric and thermal loads as well as RES generation
Mode 3. Effect of previous-day electricity price variation on the purchasing and sales strategies with all the uncertainties in the paper
Mode 4. Effect of RES power station (wind and solar) on the purchasing and sales strategy with all the uncertainties in the paper
Mode 5. Effect of battery capacity on the purchasing and sales strategy with all the uncertainties in the paper
Mode 6. Effect of gas price on the purchasing and sales strategies, with all the uncertainties in the paper
Mode 7. Effect of uncertainties on the cost of MG operation
Mode 1: Here, the proposed strategy is applied to a multi-carrier MG. Fig. 8 compares the cost of MG operation in the previous-day and real-time market with previous-day and real-time market electricity price uncertainty. Based on Fig. 8, the cost of operation is considerably reduced for the dual participation model compared to the model, in which it participates only in the previous-day or real-time markets. The cost of MG operation is severely increased if it participates in the real-time market due to the high electricity price, compared to participating in the previous-day market. The comparison of optimal MG operation with/without participation in the previous-day market shows that the cost of MG operation is reduced by about 5.2% with dual participation, compared to participation only in the real-time market.
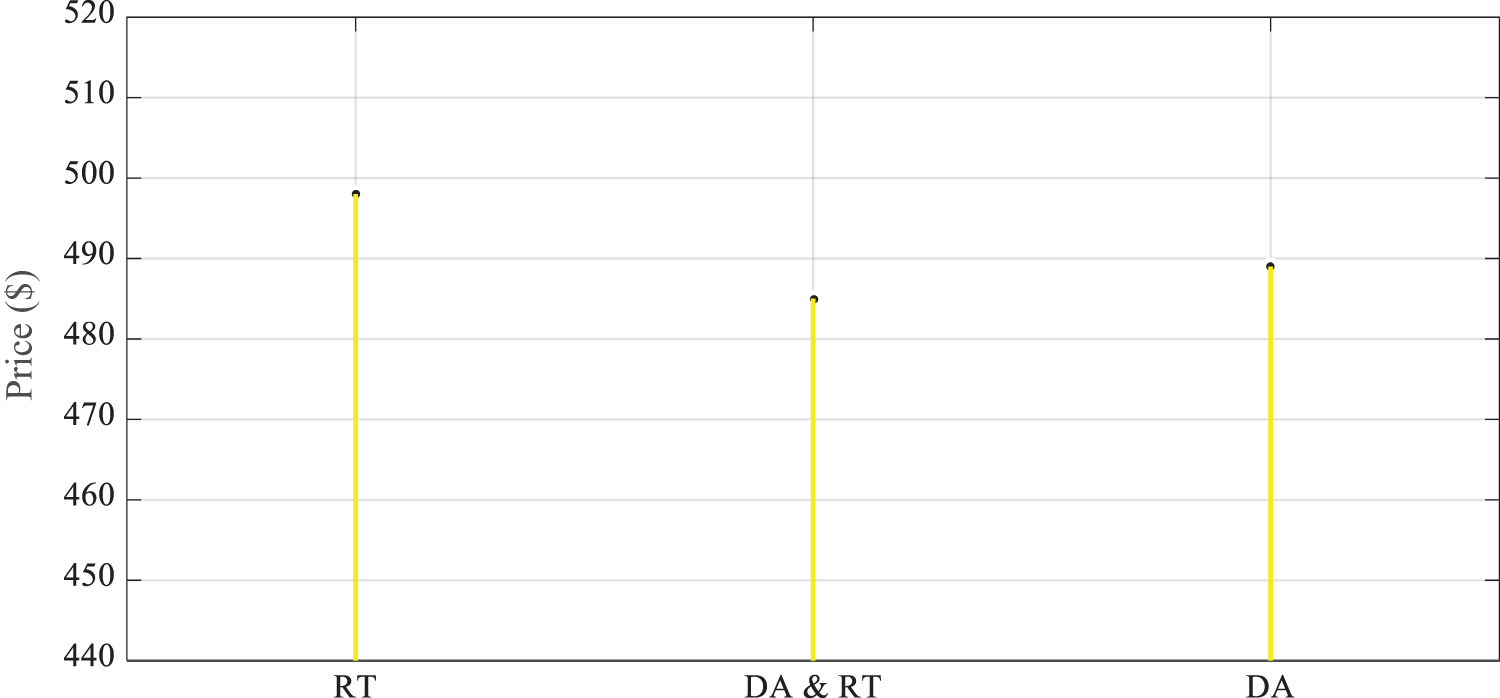
Figure 8: Cost of MG operation with uncertainty in the previous-day and real-time electricity price
Mode 2: To demonstrate the importance of the proposed strategy for a multi-carrier MG and using the proposed strategy for MG operation by considering previous-day and real-time market electricity price, the electric and thermal load and RES generation (solar and wind) are simulated in mode 2.
Fig. 9 compares the cost of MG operation in dual participation mode with the uncertainty in all previous-day and real-time market parameters. Based on Fig. 9, each cost of operation is increased in the dual participation mode compared to participating only in the previous-day market, due to a rise in electric and thermal loads and a reduction in DG prediction. Compared to the single participation in the real-time market, it has been reduced due to the expensive electricity price in the real-time market. This mode reveals that the cost of operation has increased during dual participation compared to Mode 1 due to having a more realistic model with different uncertainties. This difference in costs could seem unreasonable at first; however, due to uncertainties in DG and energy price, the MG tends to purchase energy from the previous-day market due to the low electricity price, while it tends to sell energy at a higher price on the real-time market.
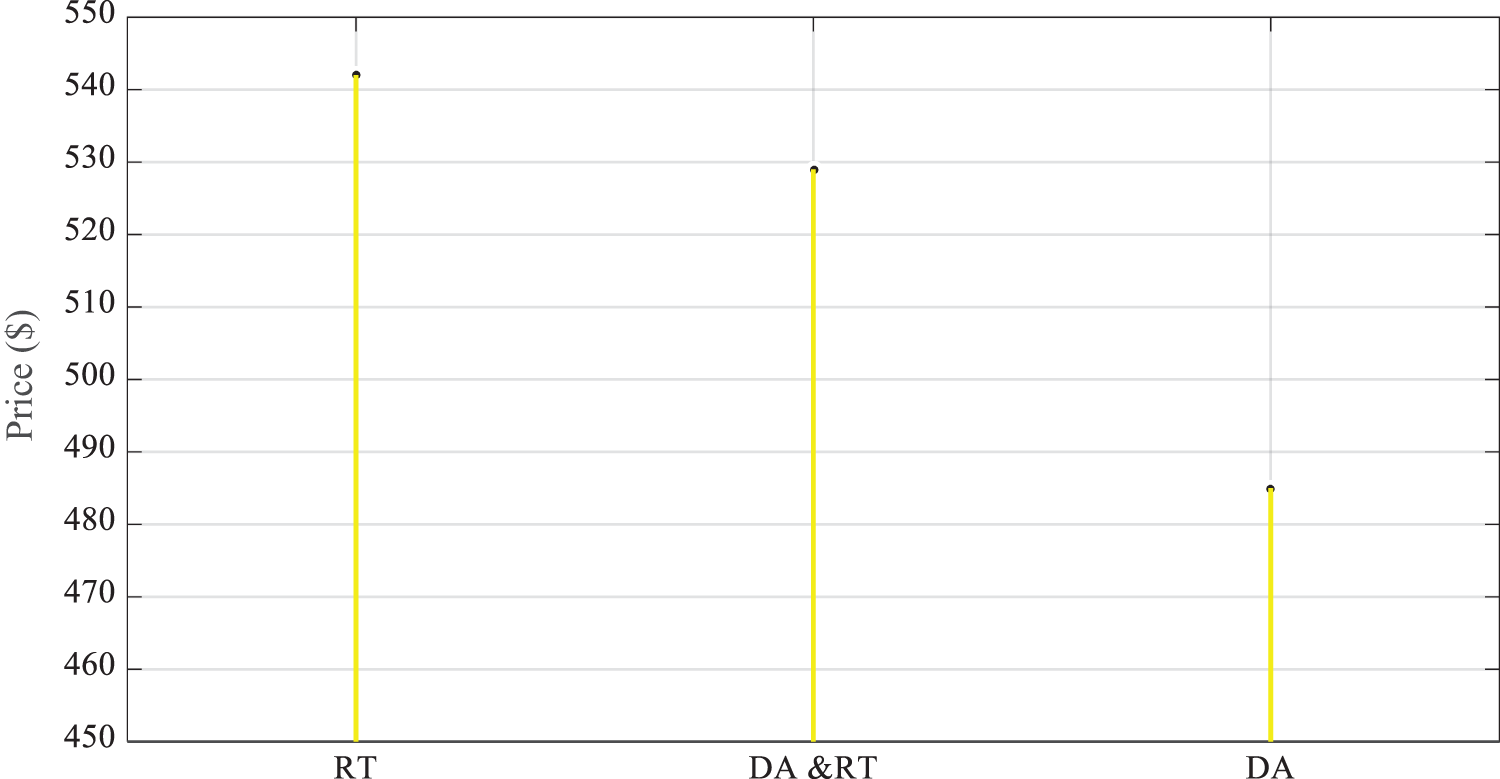
Figure 9: Comparison of the cost of MG operation in dual participation mode with the uncertainty in all previous-day and real-time market parameters
Figs. 10 and 11 display the average purchased/sold energy on the previous-day market and the energy exchanges on the real-time market to compensate for the imbalance. In Fig. 11, the image of a clock is used to display the forward sales/purchases on the previous-day market, as well as the energy sales/purchase on the real-time market to compensate for load imbalance. A binary variable is used to see whether the forward sales/purchase of energy in the first stage was cost-effective or not, denoted by 0 (no) and 1 (yes). Based on the following two figures, in the first stage, the MG tended to sell energy at 1, 2, 3, 5, 6, and 23–24 due to the low consumption and high generation, but generation or economic profit from the real-time purchase was impossible for the MG. This could be because, appraising and considering maximum generation for RES units on the previous day, less energy was generated on the real-time market due to uncertainty.
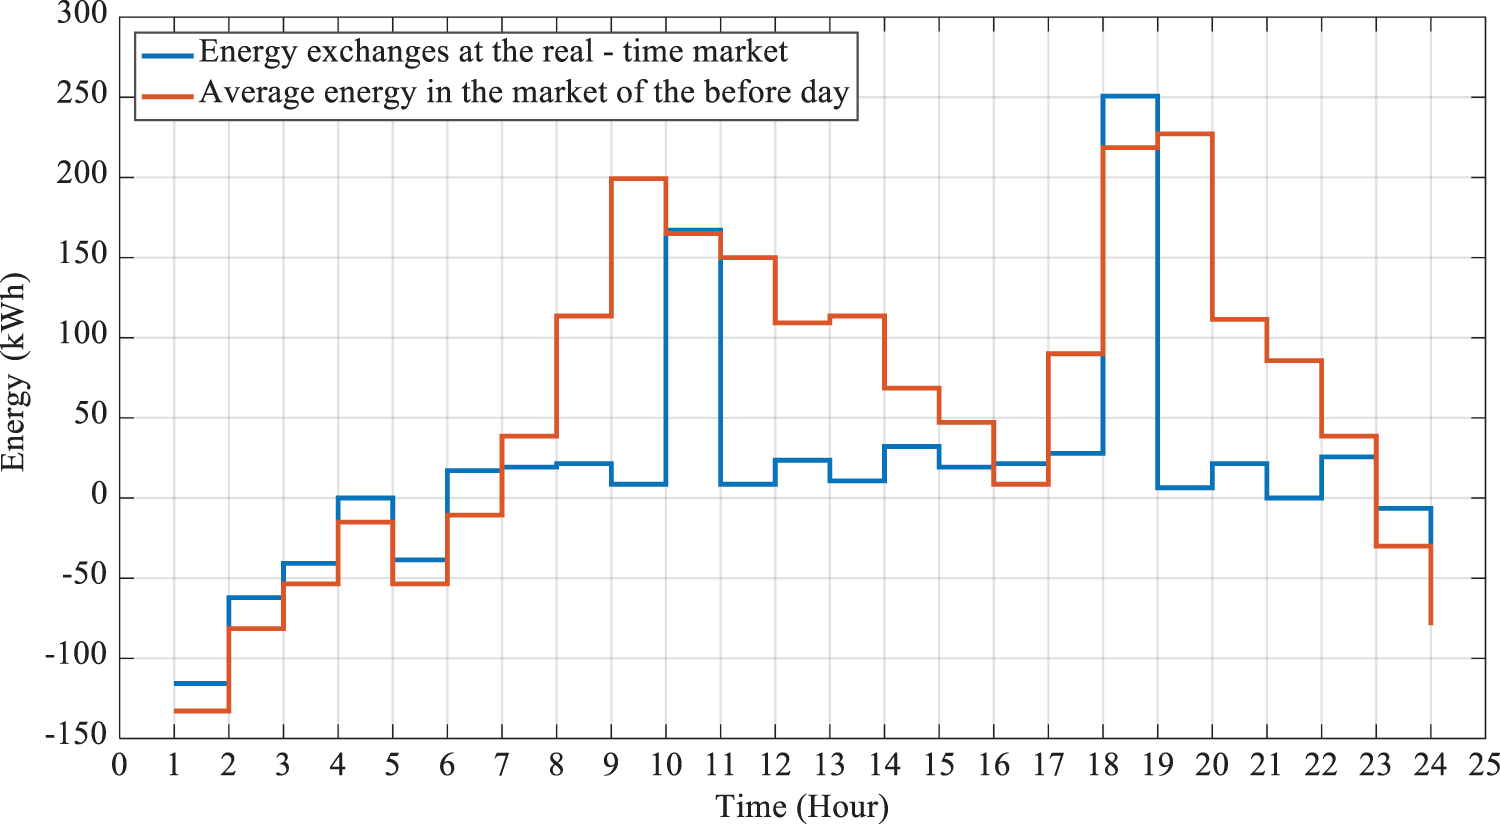
Figure 10: Average energy (purchased/sold) on the previous-day market and energy exchanges on the real-time market
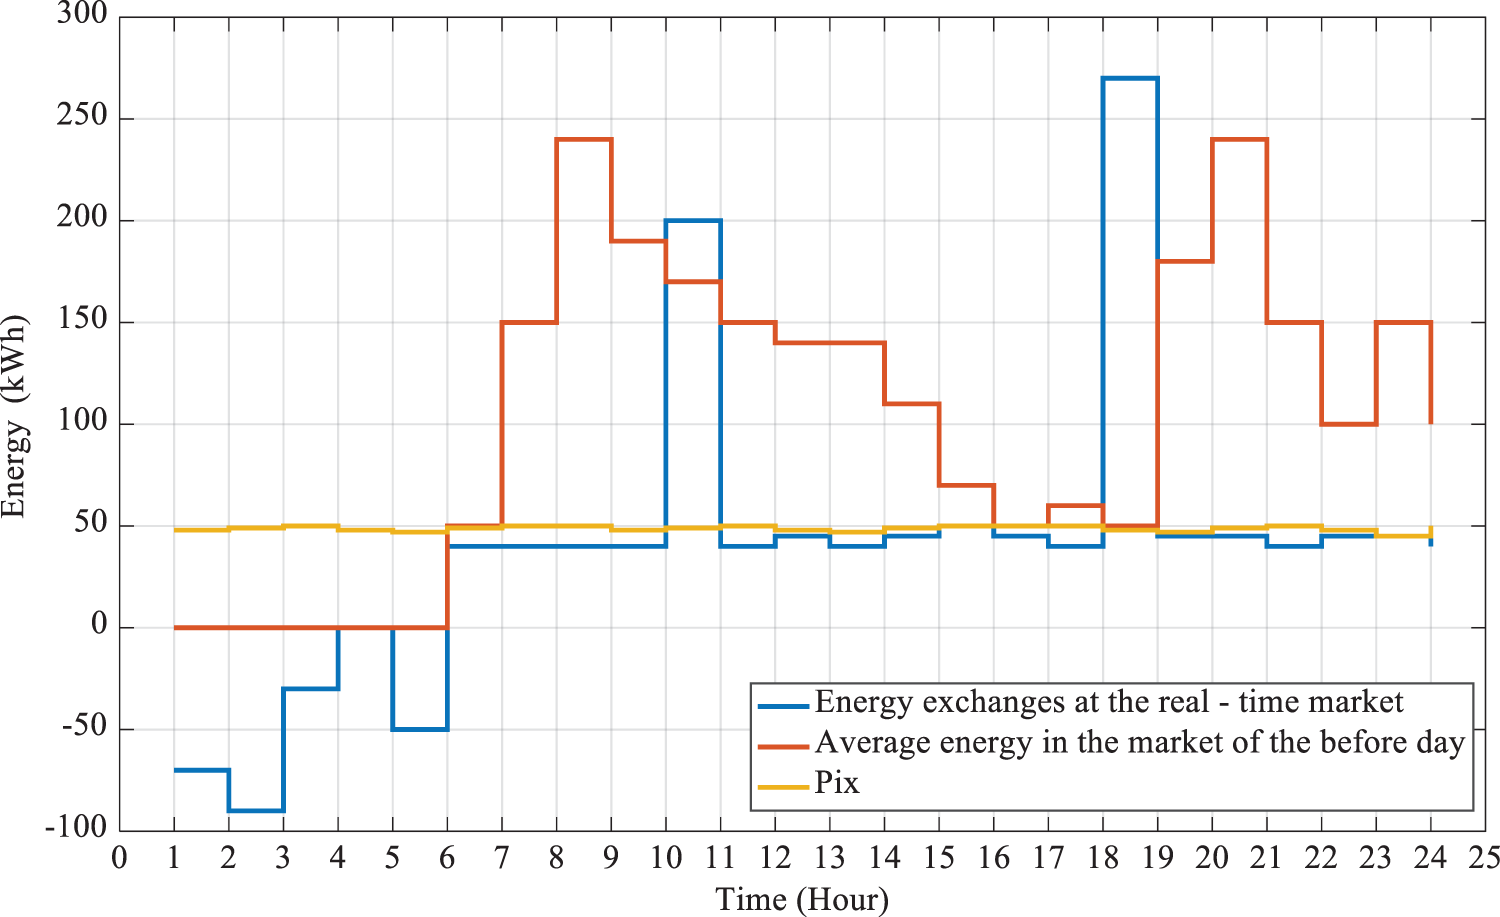
Figure 11: Average energy (purchased/sold) on the previous-day market and energy exchanges on the real-time market
After second-stage analysis and examining the defined binary variable (confirmation of sales or purchase on the previous-day market), it is concluded that the MG should sell the surplus electricity in the real-time market due to the high electricity price. Evidently, the MG operator had decided to sell energy in the forward sales and purchase strategy at 4, while it needed to purchase a small amount of electricity from the upstream grid, even at that hour in the real-time market. At 7–9, 11–15, 17, 19, and 20–22, the MG operator decided to purchase electricity from the upstream grid, which is acceptable at most hours, and even purchase a small amount of electricity from the grid to supply the surplus load on the real-time market. The rejection of the forward electricity purchase at 10 and 18 is notable; the operator has realized in the real-time stage that the electricity price has been reduced on the real-time market and found it cost-effective to purchase all the electricity on the real-time market.
Finally, it is concluded that the MG operator should forward purchase electricity at peak hours due to the uncertainties; however, it should not forward sell any electricity and, instead, sell the surplus electricity on the real-time market. Forward purchase of surplus electricity is more optimal than a little forward purchase to overcome the uncertainties because it is possible to sell the forward-purchased surplus electricity on the real-time market.
Mode 3: Fig. 12 and Table 2 show the effect of variations (increases/decreases) in the previous-day electricity price on the cost of MG operation. Evidently, if the previous-day market electricity price has a declining trend, the cost of MG operation is reduced when participating only in the previous-day market; in this case, it is cost-effective for the MG operator to forward purchase on the previous-day market.
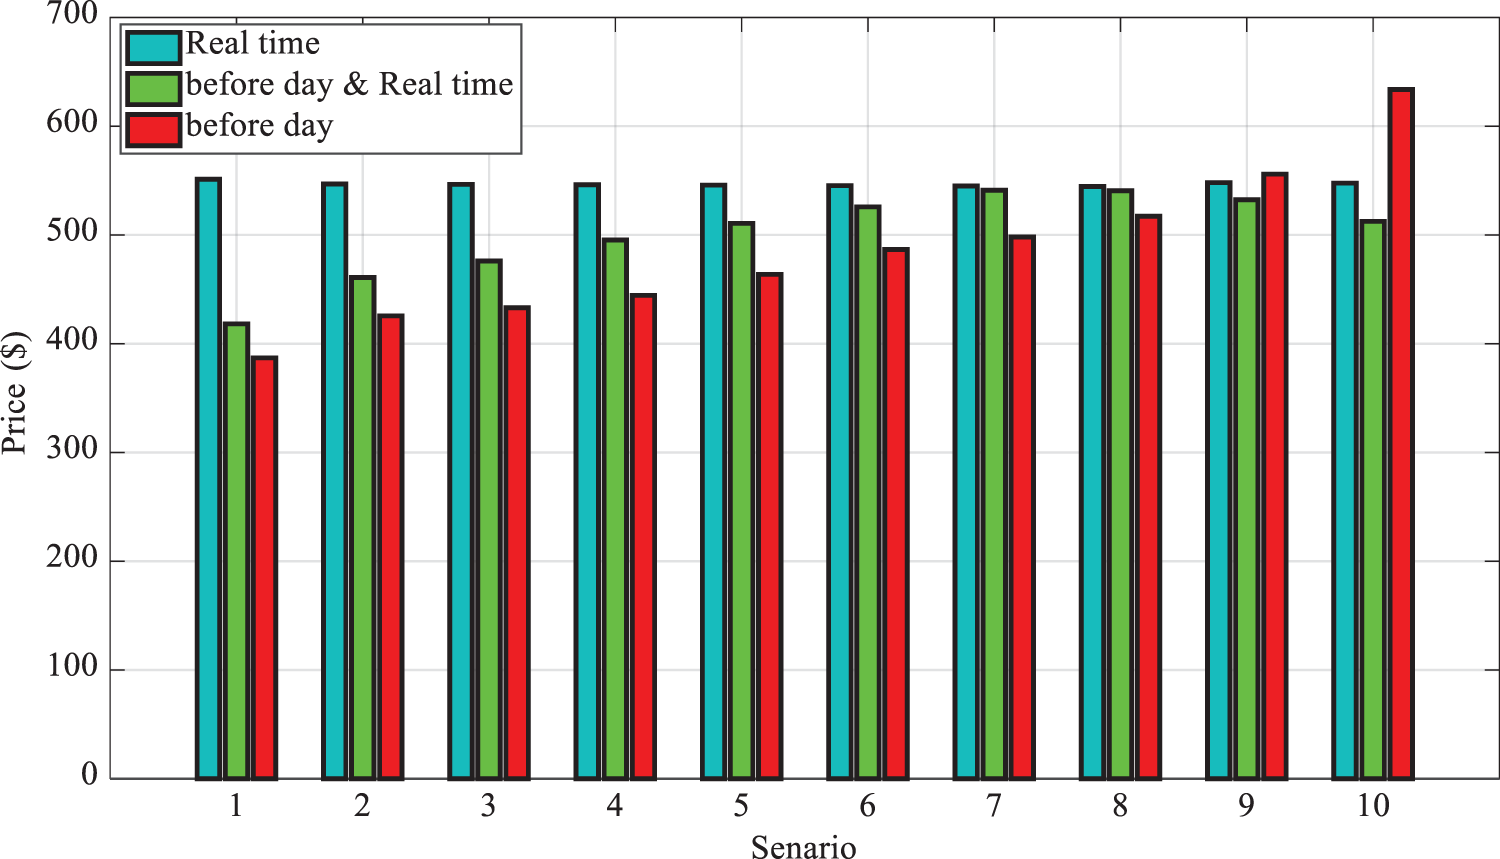
Figure 12: Effect of electricity price variations in the previous-day, real-time and dual participation on the cost of MG operation
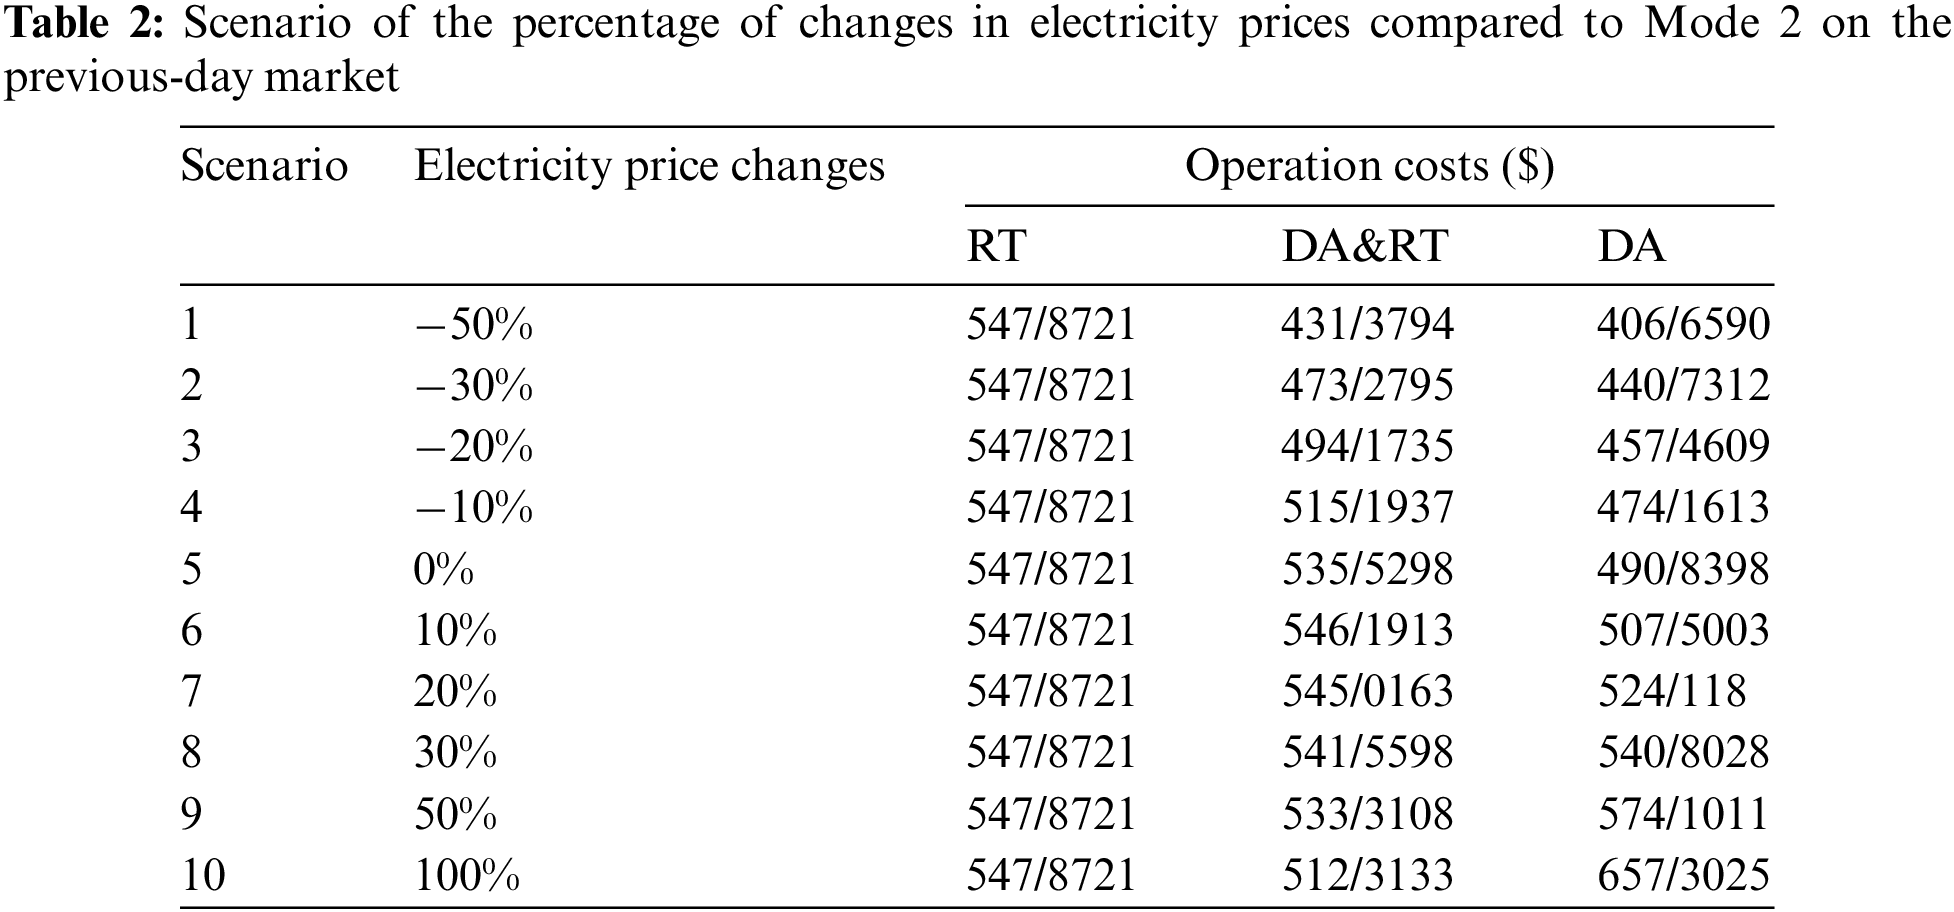
Interestingly, in this mode, the final cost of participation in the real-time market alone is more than the other two modes. Overall, if the electricity price remains unchanged, the costs of operation in the previous-day and real-time markets also remains unchanged. If the electricity price increases by 10%, then the cost of operation only in the previous-day participation model or dual participation slightly increases. Nevertheless, if the electricity price gradually increases by 20% and above, the cost of operation in the previous-day participation model rises, while it decreases during dual participation. By raising the electricity price up to 30% on the previous-day market, the cost of operation increases only when participating in the previous-day market; however, in the dual participation model, the changes were not significant; the cost of operation is still higher when participating only in the real-time market. The declining trend of the operation cost with a >30% rise in the previous-day electricity price in the dual participation model is notable, which is due to the sale of electricity on the previous-day market, only to then purchase it in the real-time market.
Based on Fig. 12, the minimum 50% rise in the electricity price in the previous-day market has led to an exponential elevation in the cost of operation in the previous-day market, but a reduction in the cost of dual participation. In this model, the operation cost of dual participation is less than participation only in the real-time market. It is shown that when the electricity price is increased by 100% in the previous-day market, to reduce the cost of MG operation, a very little amount of energy should be purchased from the previous-day market and the maximum amount of energy from the real-time market.
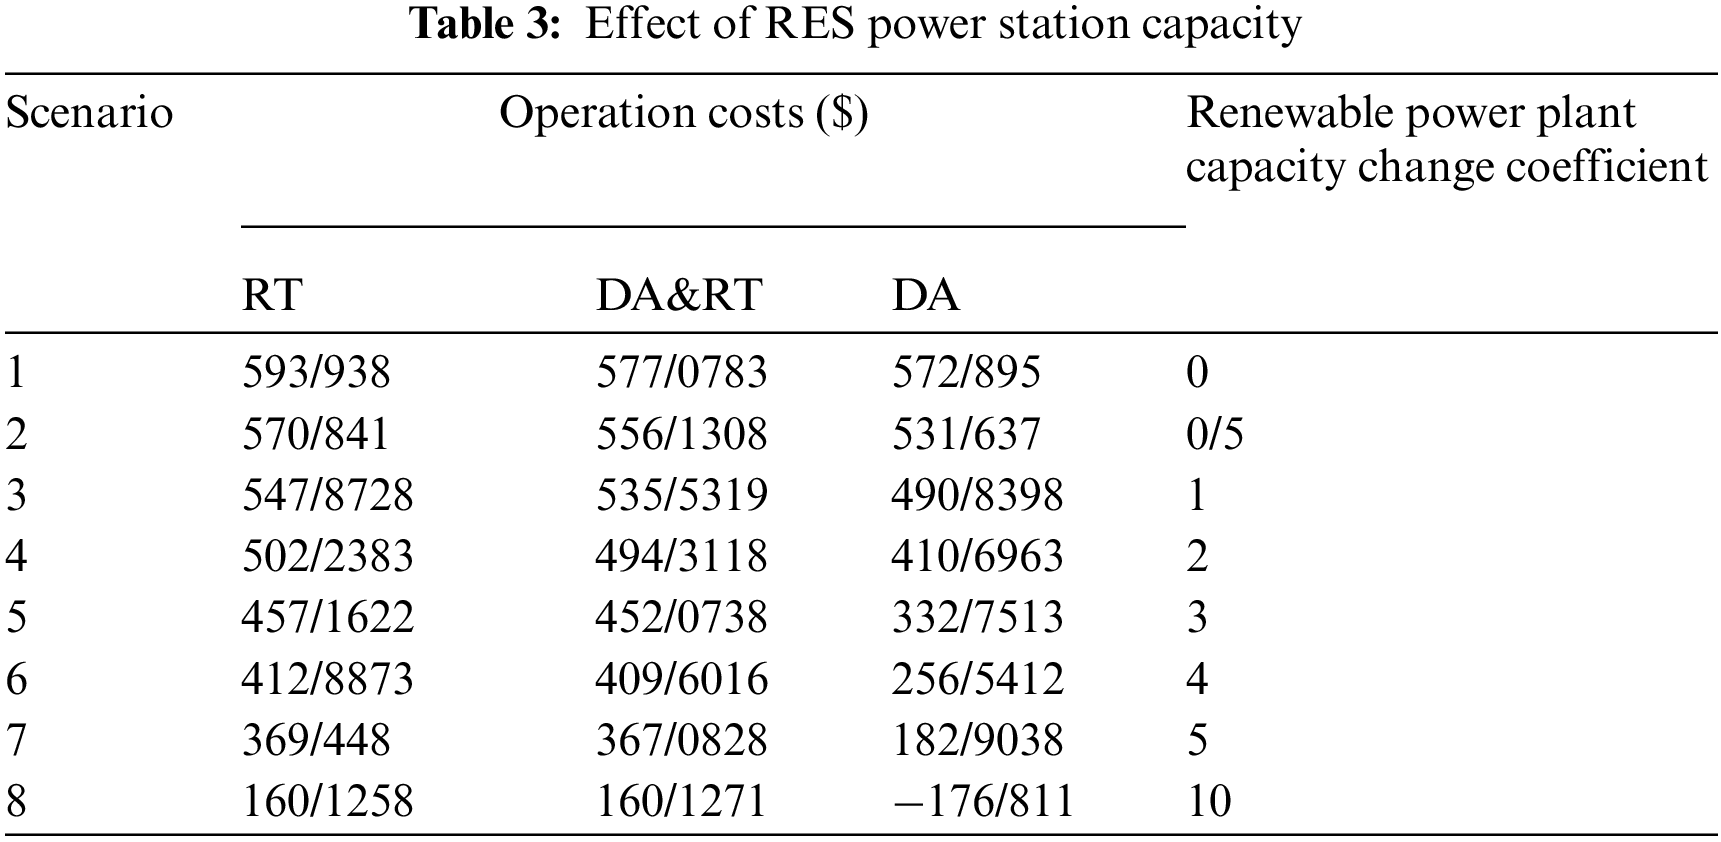
Mode 4: Fig. 13 depicts the effects of RES (wind and solar) power station capacity on the cost of operation; the more the capacity of the RES power station increases, the more the cost of operation would decrease. The notable point in this scenario is that, by increasing the RES units’ capacity by 10 times, the cost of MG operation will greatly decrease. Based on Table 3, with this extent of RES power station installation, there is no need to participate in the previous-day market and the consumer can trade all the required energy on the real-time market.
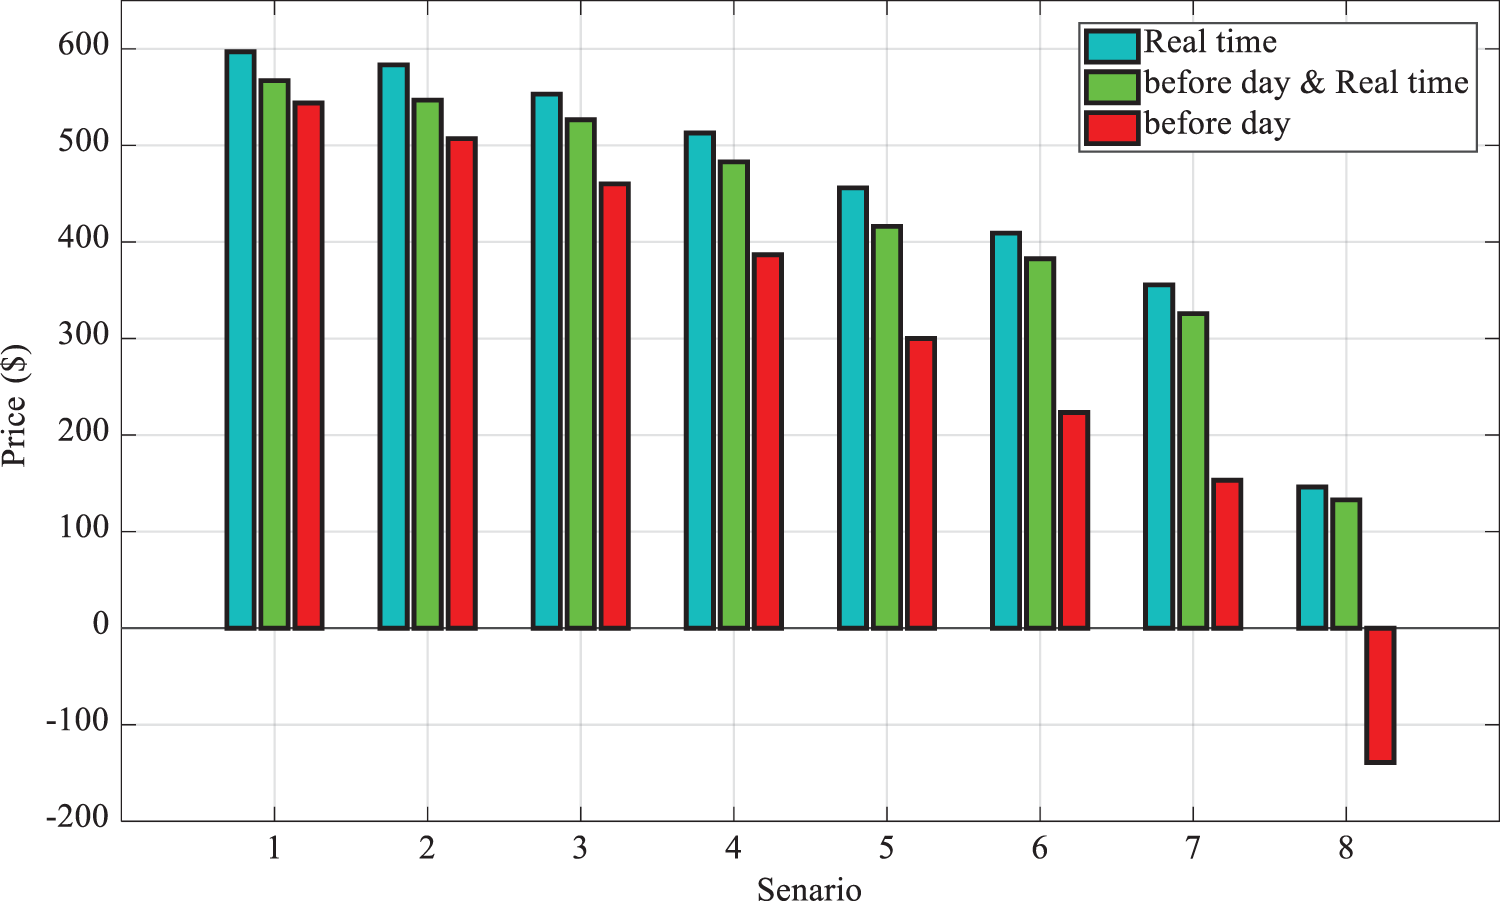
Figure 13: Capacity of RES power station in previous-day, real-time and dual participation on the cost of operation
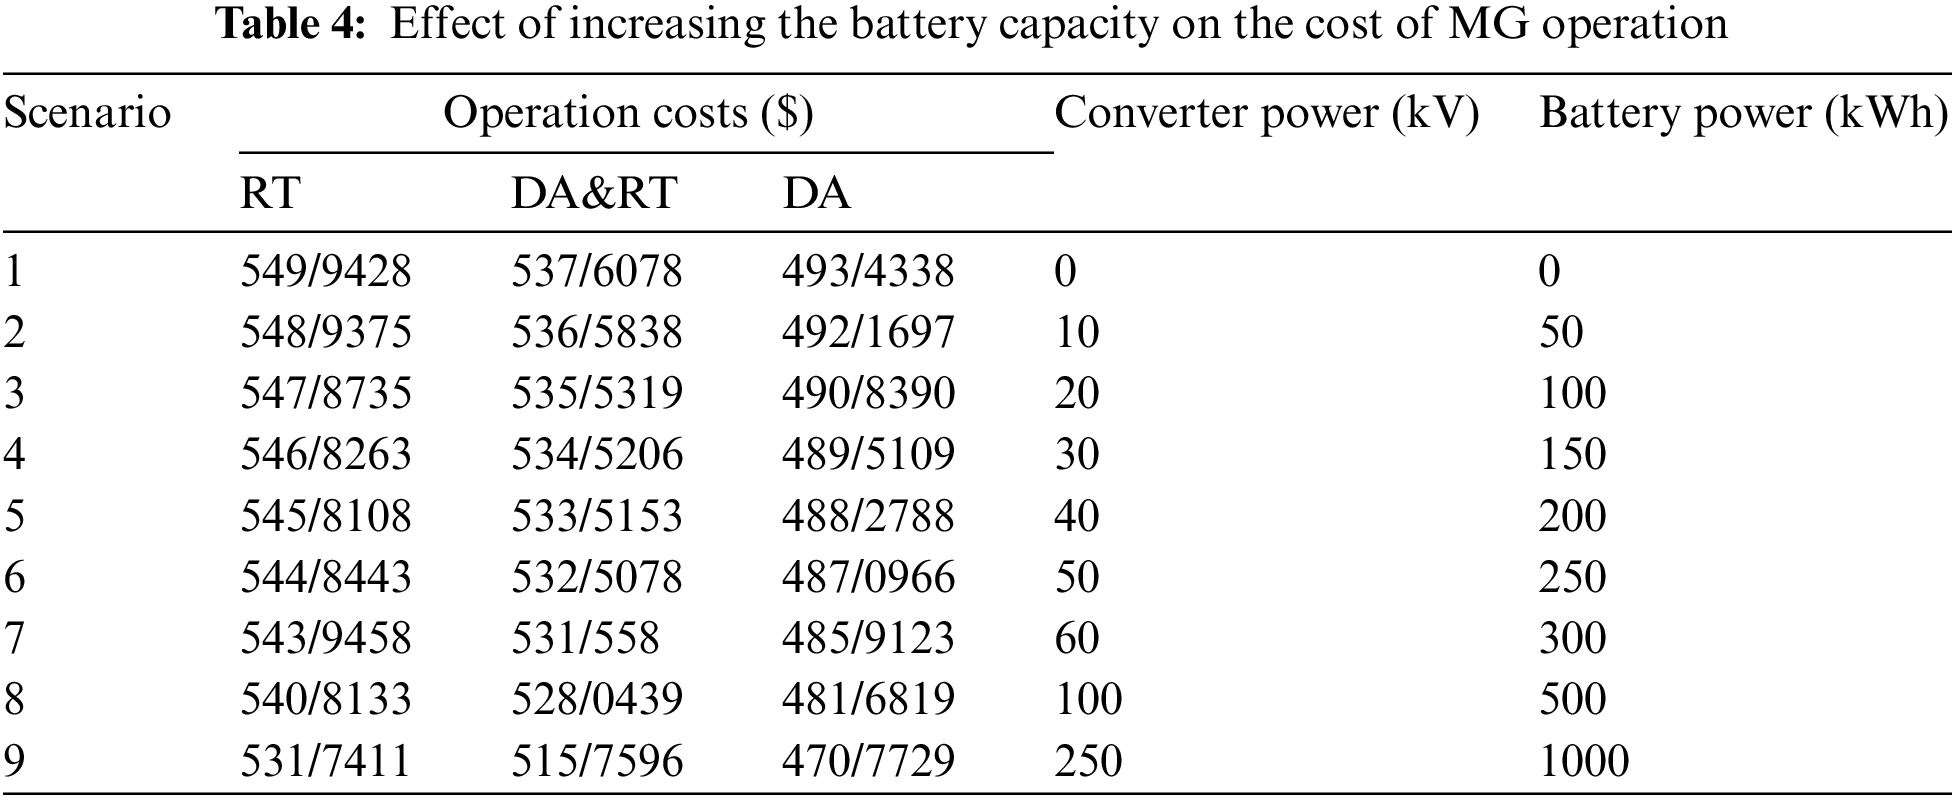
Mode 5: Fig. 14 and Table 4 present the effect of battery capacity on the cost of operation. Based on this scenario, by increasing the battery capacity, the system operator will have more flexibility in selling/purchasing energy in all three modes (participation in previous-day market, participation in day-ahead market and both), which eventually reduces the cost of MG operation.
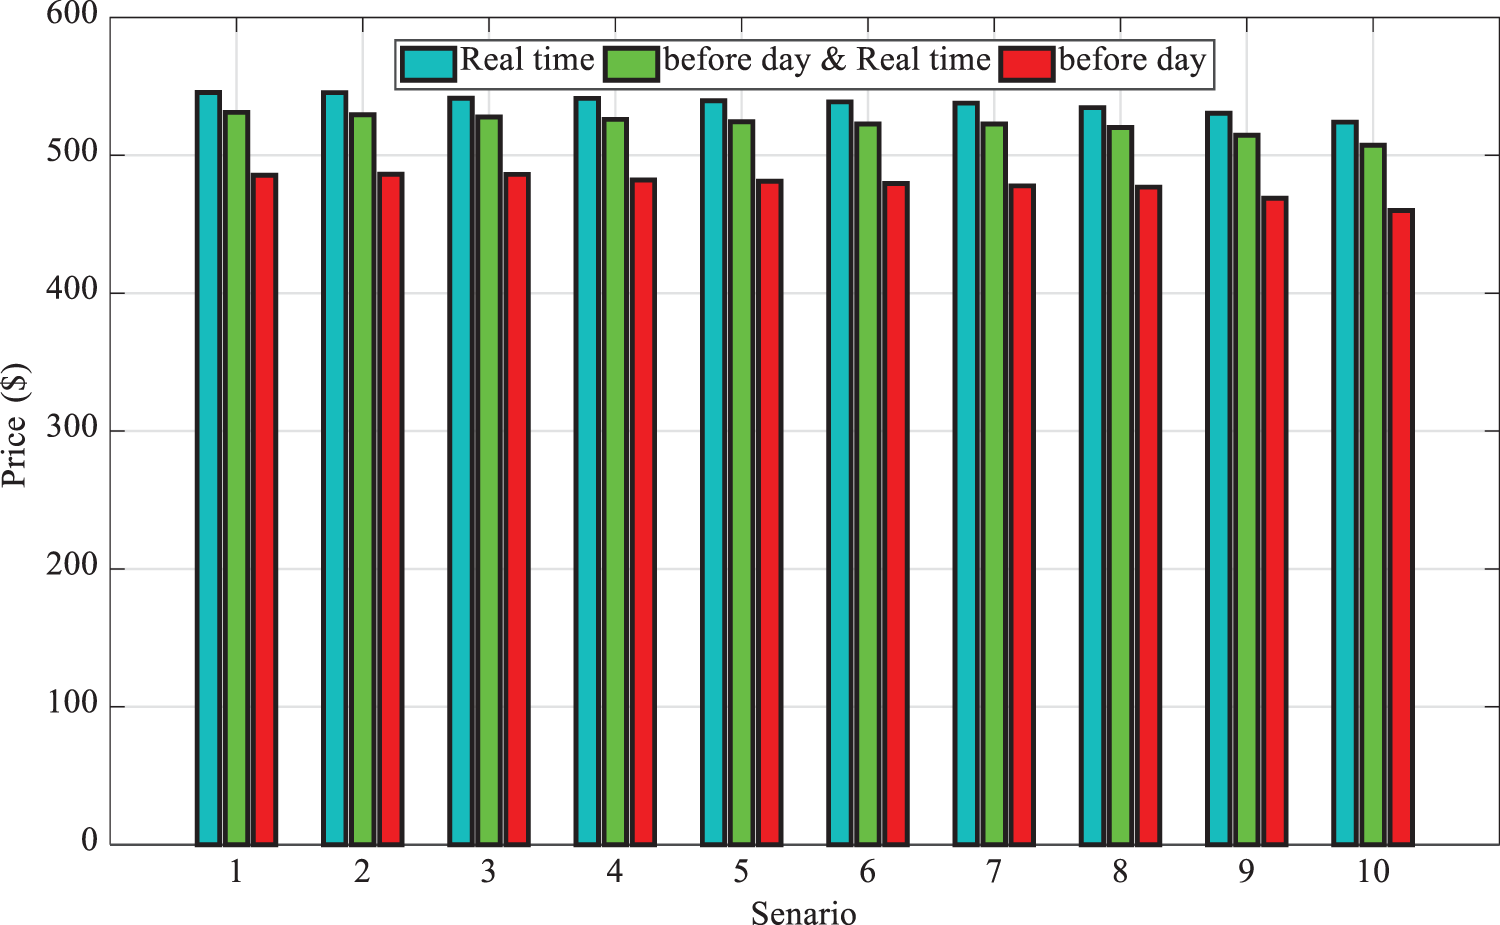
Figure 14: Effect of battery capacity in previous-day, real-time and dual participation on the cost of operation
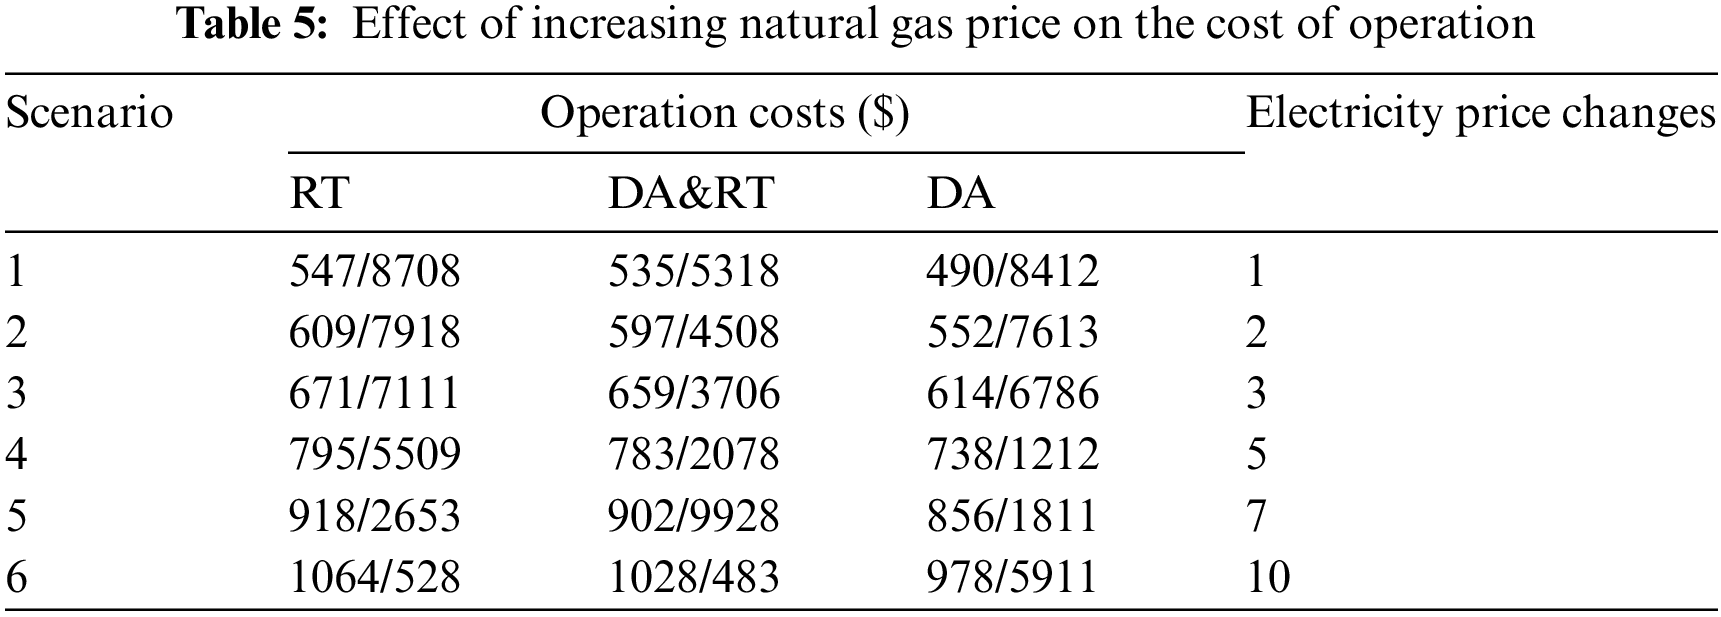
As an example, the ESS performance in the main model is illustrated in Fig. 15. The battery performance shows that the MG tends to charge in non-peak hours, while energy discharge is done to supply loads in peak hours when the electricity price is high. Also, the effect of increasing natural gas price is presented in Table 5 for the operation cost.
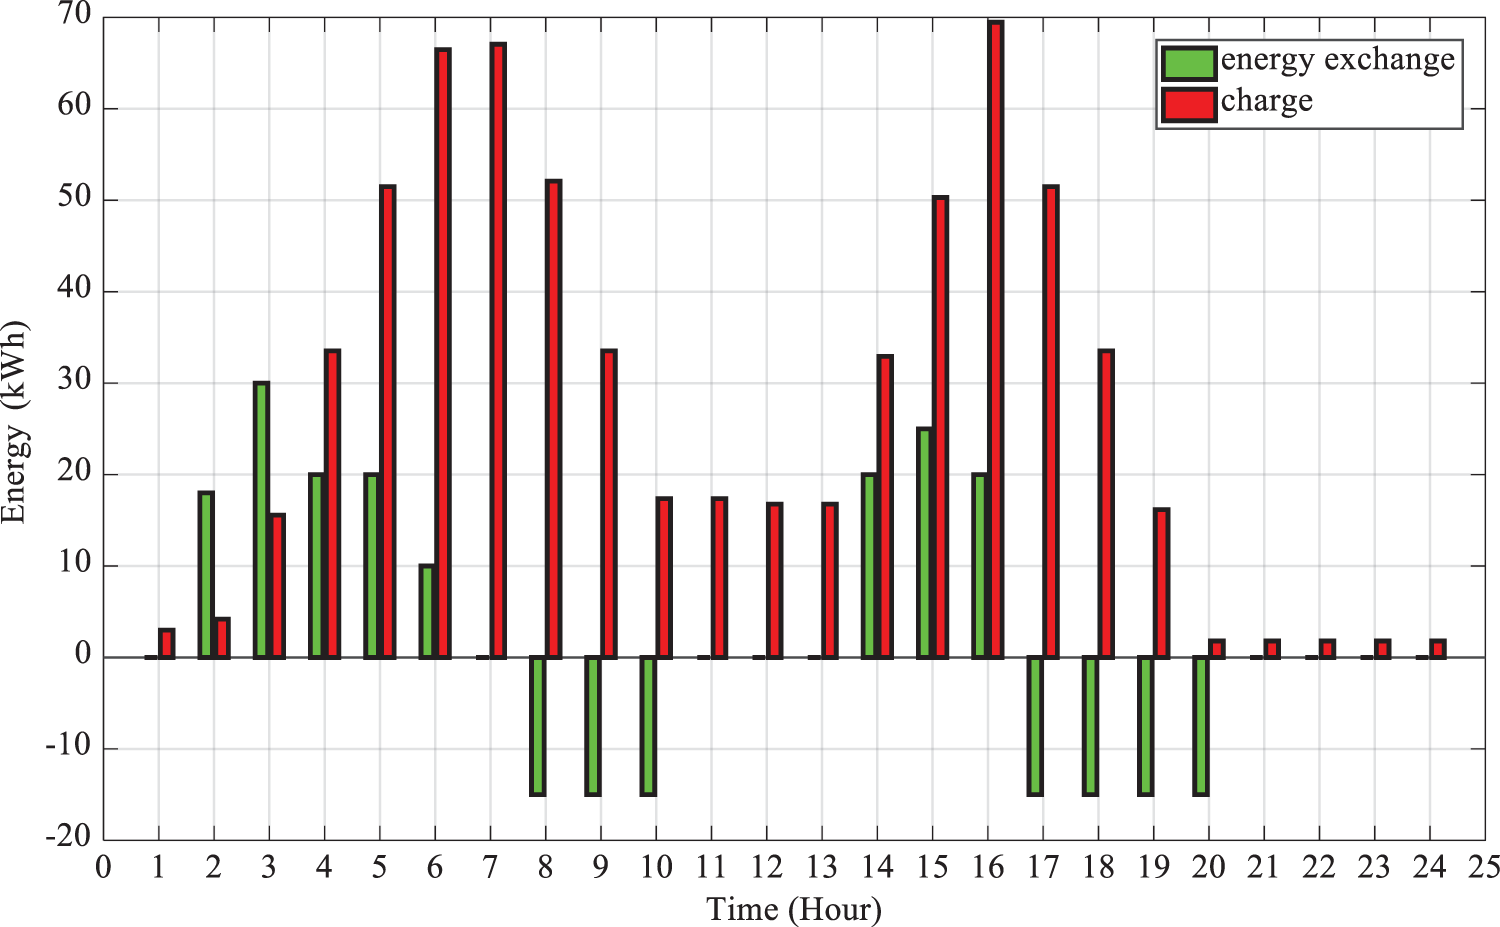
Figure 15: ESS performance in the main model
Mode 6: In Table 6 and Fig. 16, it is observed that the electricity price depends on the gas price on the previous day and in real-time; by increasing the gas price, the electricity prices also rise, thereby increasing the total cost of MG operation.
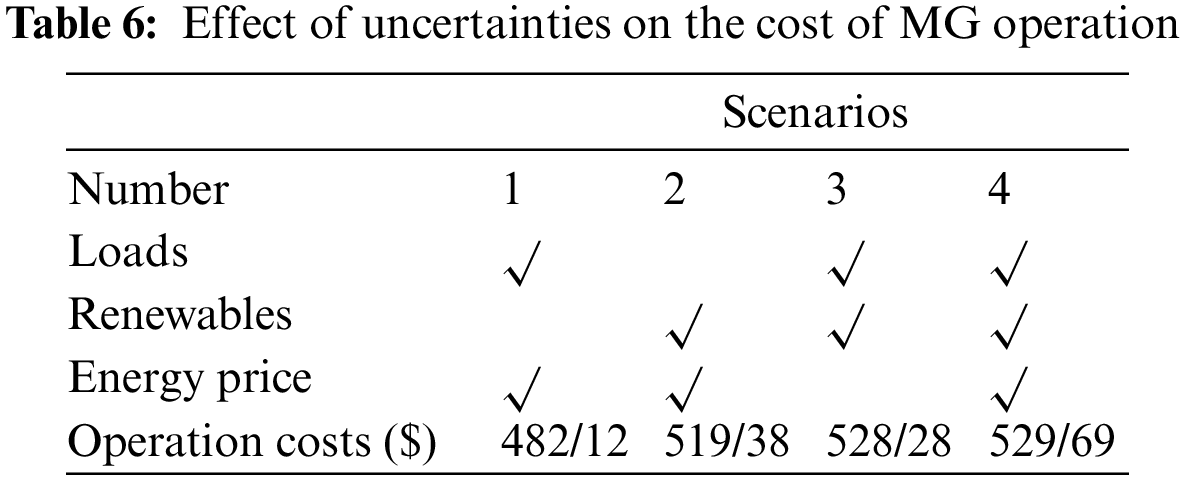
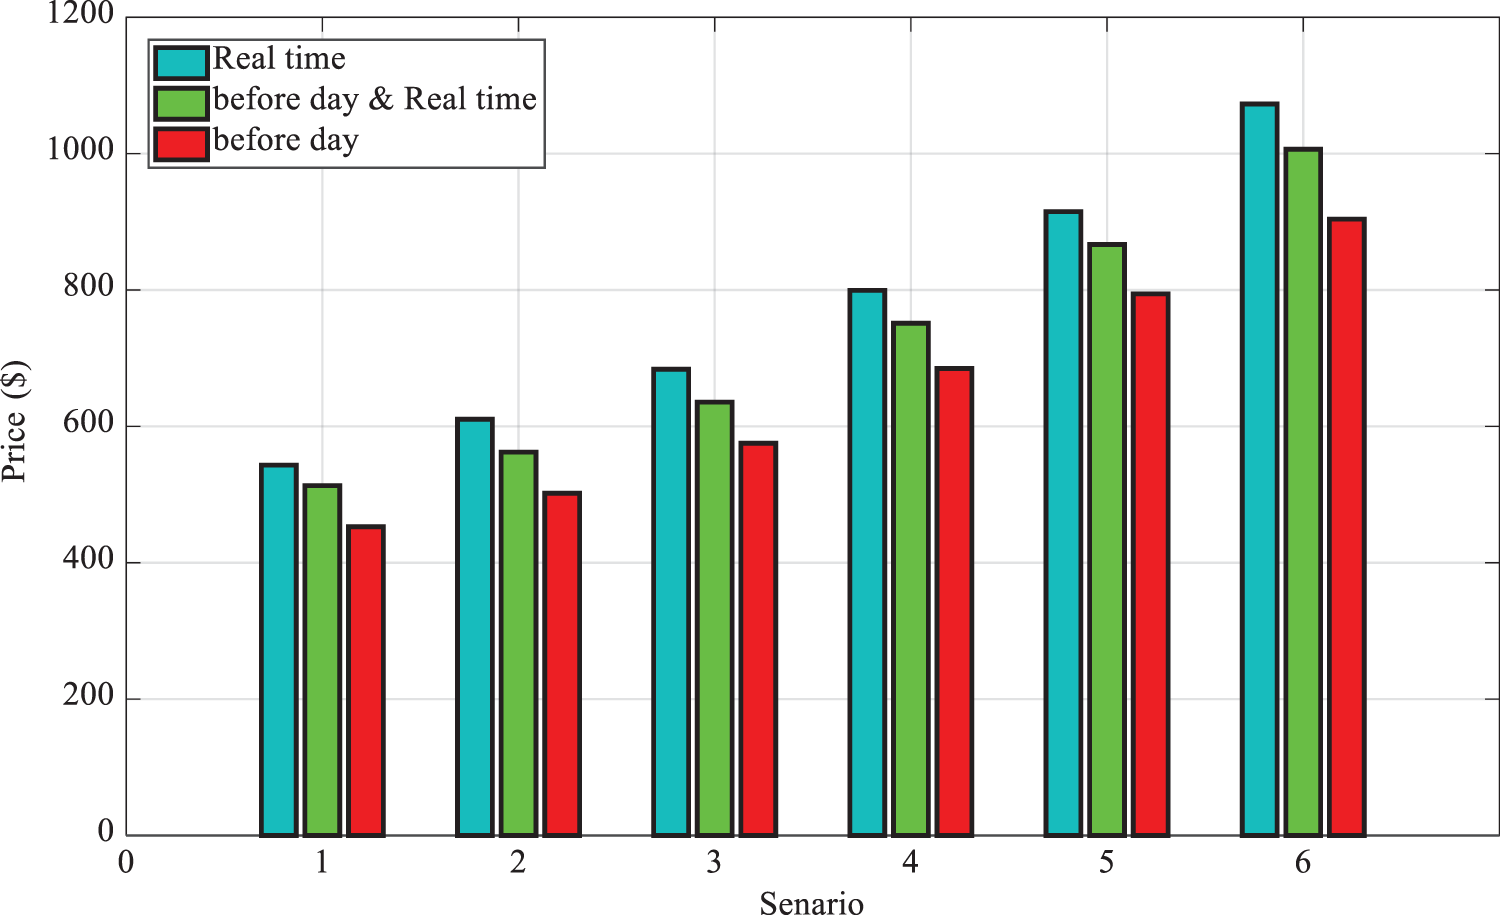
Figure 16: Electricity price to gas price in the previous-day, real-time and dual participation
Mode 7: In this model, the effect of uncertainty on the MG cost in the dual participation model is studied based on Table 6. Evidently, the absence of uncertainty in RES generation has unrealistically decreased the costs.
In Scenario 1, the importance of RES and battery uncertainty on the cost of MG operation is greater than in the other modes. If uncertainty is not included, the real cost of MG is underestimated unrealistically due to assuming maximum RES generation. Therefore, considering RES uncertainty even with low capacity in MG operation is inevitable. However, in the model that does not consider load uncertainty, the cost of operation is markedly increased compared to Scenario 1, which could partly be due to considering uncertainty in RES generation. In Scenario 3, the effect of disregarding uncertainty on price has increased the cost of operation compared to Scenario 2. Comparison of Scenarios 2 and 3 reveals it is due to the greater importance of considering load uncertainty and, to a lesser extent, disregarding price uncertainty, which has further increased the costs in the MG. Uncertainty is considered in all cases in Scenario 4, in which compared to Scenario 3, the cost of operation is slightly reduced. The important conclusion is that the simultaneous operation of several energy carriers, e.g., electricity and gas, greatly mitigates the effects of electricity price variations on the cost of MG operation; in fact, the effects of electricity price uncertainty have diminished, whether regarding the previous-day market or the real-time market.
Energy hubs play a mediating role in the entire interplay of energy resources, like that of an electrical energy retailer, with the difference being that the manager owns the equipment within the hub. By using the existing electricity and gas sources to purchase energy, CHP equipment and heating furnaces for energy conversion, greater infrastructural problems can obe overcome while those hubs can simultaneously maximize profits.
Electric and thermal energies are at the hub output, able to be sold, of which generates revenue for that hub. Electrical energy is supplied from the power pool market, and yet prices in the pool market inherently have uncertainties. Thermal energy is supplied by CHP gas units and the heating furnace. The price of this carrier is assumed to be constant due to the minor price fluctuations in the gas grid. The thermal energy generated by gas can also be assumed as having a constant price with acceptable variation in accuracy.
The electrical energy is purchased from the electrical energy market at a variable price, but sold to the consumers at a constant price. This is why selecting a proper price for selling electrical energy to maximize the profit and keep the customers is of utmost importance. This paper performed the simultaneous economic dispatch optimization of carriers’ energy for electric and hydraulic systems in a setting with uncertainties on the previous-day and real-time markets in a multi-carrier MG.
In this model, the energy management system of the multi-carrier MG bided on energy sales/purchases to the distribution system operator to participate in the previous-day market. Decision-making was defined as follows: How much energy should the hub manager purchase from the electrical energy market and the gas grid per hour, so that it can make the maximum profit by using the purchased carriers and the existing gas units? The bidding price should also be included in the decision variables. Finally, a developed optimization algorithm based on harmony search was employed to solve the problem. Based on the results, by increasing the electricity price in the real-time market, the cost of MG operation was markedly reduced due to energy sales. Furthermore, the simultaneous operation of several energy carriers, e.g., electricity and gas, considerably mitigated the effects of uncertainties on the cost of MG operation. Future work will try to focus on the storage system and demand-side management for the cost. Also, the pollution target function should be considered as a target.
Funding Statement: This work was supported as a Major Project of the Beijing Social Science Foundation “Research on Financial Support System Adapting to the Coordinated Development of Strategic Emerging Industries in Beijing-Tianjin-Hebei”, No. 20ZDA11.
Conflicts of Interest: The authors declare that they have no conflicts of interest to report regarding the present study.
References
1. Cao, W., Pan, X., Sobhani, B. (2021). Integrated demand response based on household and photovoltaic load and oscillations effects. International Journal of Hydrogen Energy, 46(79), 39523–39535. [Google Scholar]
2. Wang, C., Zhang, Z., Abedinia, O., Farkoush, S. G. (2021). Modeling and analysis of a microgrid considering the uncertainty in renewable energy resources, energy storage systems and demand management in electrical retail market. Journal of Energy Storage, 33, 102111. [Google Scholar]
3. Huang, S., Abedinia, O. (2021). Investigation in economic analysis of microgrids based on renewable energy uncertainty and demand response in the electricity market. Energy, 225, 120247. [Google Scholar]
4. Abedinia, O., Lotfi, M., Bagheri, M., Sobhani, B., Shafie-Khah, M. et al. (2020). Improved EMD-based complex prediction model for wind power forecasting. IEEE Transactions on Sustainable Energy, 11(4), 2790–2802. [Google Scholar]
5. Nurmanova, V., Bagheri, M., Abedinia, O., Sobhani, B., Mohammad, S. (2018). A synthetic forecast engine for wind power prediction. 2018 7th International Conference on Renewable Energy Research and Applications (ICRERA), pp. 732–737. Paris, France, IEEE. [Google Scholar]
6. Yang, J. C. Sobhani, B. (2021). Integration of biomass gasification with a supercritical CO2 and Kalina cycles in a combined heating and power system: A thermodynamic and exergoeconomic analysis. Energy, 222, 119980. [Google Scholar]
7. Luo, L., Abdulkareem, S. S., Rezvani, A., Miveh, M. R., Samad, S. et al. (2020). Optimal scheduling of a renewable-based microgrid considering photovoltaic system and battery energy storage under uncertainty. Journal of Energy Storage, 28(25), 101306. DOI 10.1016/j.est.2020.101306. [Google Scholar] [CrossRef]
8. Jani, A., Karimi, H., Jadid, S. (2021). Hybrid energy management for islanded networked microgrids considering battery energy storage and wasted energy. Journal of Energy Storage, 40(6), 102700. DOI 10.1016/j.est.2021.102700. [Google Scholar] [CrossRef]
9. Benlahbib, B., Bouarroudj, N., Mekhilef, S., Abdeldjalil, D., Abdelkrim, T. et al. (2020). Experimental investigation of power management and control of a PV/wind/fuel cell/battery hybrid energy system microgrid. International Journal of Hydrogen Energy, 45(53), 29110–29122. DOI 10.1016/j.ijhydene.2020.07.251. [Google Scholar] [CrossRef]
10. Hamedi, K., Sadeghi, S., Esfandi, S., Azimian, M., Golmohamadi, H. (2021). Eco-emission analysis of multi-carrier microgrid integrated with compressed air and power-to-gas energy storage technologies. Sustainability, 13(9), 4681. DOI 10.3390/su13094681. [Google Scholar] [CrossRef]
11. Ma, Y., Li, C., Zhou, J., Zhang, Y. (2020). Comprehensive stochastic optimal scheduling in residential micro energy grid considering pumped-storage unit and demand response. Journal of Energy Storage, 32, 101968. DOI 10.1016/j.est.2020.101968. [Google Scholar] [CrossRef]
12. Garcia-Torres, F., Bordons, C., Ridao, M. A. (2018). Optimal economic schedule for a network of microgrids with hybrid energy storage system using distributed model predictive control. IEEE Transactions on Industrial Electronics, 66(3), 1919–1929. DOI 10.1109/TIE.2018.2826476. [Google Scholar] [CrossRef]
13. Angarita, J. L., Jafari, H., Mohseni, M., Al-Sumaiti, A. S., Heydarian-Forushani, E. et al. (2021). Optimal investment and operation of a microgrid to provide electricity and heat. IET Renewable Power Generation, 15(12), 2586–2595. DOI 10.1049/rpg2.12190. [Google Scholar] [CrossRef]
14. Vahedipour-Dahraie, M., Rashidizadeh-Kermani, H., Anvari-Moghaddam, A., Siano, P. (2020). Flexible stochastic scheduling of microgrids with islanding operations complemented by optimal offering strategies. CSEE Journal of Power and Energy Systems, 6(4), 867–877. [Google Scholar]
15. Mazidi, M., Zakariazadeh, A., Jadid, S., Siano, P. (2014). Integrated scheduling of renewable generation and demand response programs in a microgrid. Energy Conversion and Management, 86(12), 1118–1127. DOI 10.1016/j.enconman.2014.06.078. [Google Scholar] [CrossRef]
16. Aghaei, J., Barani, M., Shafie-Khah, M., de La Nieta, A. A. S., Catalão, J. P. (2015). Risk-constrained offering strategy for aggregated hybrid power plant including wind power producer and demand response provider. IEEE Transactions on Sustainable Energy, 7(2), 513–525. DOI 10.1109/TSTE.2015.2500539. [Google Scholar] [CrossRef]
17. Sedighizadeh, M., Mohammadpour, A. H., Alavi, S. M. M. (2019). A two-stage optimal energy management by using ADP and HBB-BC algorithms for microgrids with renewable energy sources and storage. Journal of Energy Storage, 21(5), 460–480. DOI 10.1016/j.est.2018.12.010. [Google Scholar] [CrossRef]
18. Beer, S., Gómez, T., Dallinger, D., Momber, I., Marnay, C. et al. (2012). An economic analysis of used electric vehicle batteries integrated into commercial building microgrids. IEEE Transactions on Smart Grid, 3(1), 517–525. DOI 10.1109/TSG.2011.2163091. [Google Scholar] [CrossRef]
19. Shams, M. H., Shahabi, M., Khodayar, M. E. (2018). Stochastic day-ahead scheduling of multiple energy carrier microgrids with demand response. Energy, 155(3), 326–338. DOI 10.1016/j.energy.2018.04.190. [Google Scholar] [CrossRef]
20. Haddadipour, S., Amir, V., Javadi Arani, S. (2020). A strategy proposing the simultaneous purchase and sale of electricity to exploit of a multi-agent micro-grid energy market. Computational Intelligence in Electrical Engineering, 11(4), 93–110. [Google Scholar]
21. Nazari-Heris, M., Abapour, S., Mohammadi-Ivatloo, B. (2017). Optimal economic dispatch of FC-CHP based heat and power micro-grids. Applied Thermal Engineering, 114, 756–769. DOI 10.1016/j.applthermaleng.2016.12.016. [Google Scholar] [CrossRef]
22. Zhang, C., Xu, Y., Li, Z., Dong, Z. Y. (2018). Robustly coordinated operation of a multi-energy microgrid with flexible electric and thermal loads. IEEE Transactions on Smart Grid, 10(3), 2765–2775. DOI 10.1109/TSG.2018.2810247. [Google Scholar] [CrossRef]
23. Mansour-Saatloo, A., Mirzaei, M. A., Mohammadi-Ivatloo, B., Zare, K. (2020). A risk-averse hybrid approach for optimal participation of power-to-hydrogen technology-based multi-energy microgrid in multi-energy markets. Sustainable Cities and Society, 63(24), 102421. DOI 10.1016/j.scs.2020.102421. [Google Scholar] [CrossRef]
24. Kienzle, F., Ahčin, P., Andersson, G. (2011). Valuing investments in multi-energy conversion, storage, and demand-side management systems under uncertainty. IEEE Transactions on Sustainable Energy, 2(2), 194–202. DOI 10.1109/TSTE.2011.2106228. [Google Scholar] [CrossRef]
25. Mohseni, S., Brent, A. C., Kelly, S., Browne, W. N., Burmester, D. (2021). Strategic design optimisation of multi-energy-storage-technology micro-grids considering a two-stage game-theoretic market for demand response aggregation. Applied Energy, 287(4), 116563. DOI 10.1016/j.apenergy.2021.116563. [Google Scholar] [CrossRef]
26. Golmohamadi, H., Larsen, K. G., Jensen, P. G., Hasrat, I. R. (2022). Integration of flexibility potentials of district heating systems into electricity markets: A review. Renewable and Sustainable Energy Reviews, 159(3), 112200. DOI 10.1016/j.rser.2022.112200. [Google Scholar] [CrossRef]
27. Ge, S., Li, J., He, X., Liu, H. (2021). Joint energy market design for local integrated energy system service procurement considering demand flexibility. Applied Energy, 297(2), 117060. DOI 10.1016/j.apenergy.2021.117060. [Google Scholar] [CrossRef]
28. Ghilardi, L. M. P., Castelli, A. F., Moretti, L., Morini, M., Martelli, E. (2021). Co-optimization of multi-energy system operation, district heating/cooling network and thermal comfort management for buildings. Applied Energy, 302, 117480. DOI 10.1016/j.apenergy.2021.117480. [Google Scholar] [CrossRef]
29. Noor, S., Yang, W., Guo, M., van Dam, K. H., Wang, X. (2018). Energy demand side management within micro-grid networks enhanced by blockchain. Applied Energy, 228, 1385–1398. DOI 10.1016/j.apenergy.2018.07.012. [Google Scholar] [CrossRef]
30. Chen, T., Cao, Y., Qing, X., Zhang, J., Sun, Y. et al. (2022). Multi-energy microgrid robust energy management with a novel decision-making strategy. Energy, 239(4), 121840. DOI 10.1016/j.energy.2021.121840. [Google Scholar] [CrossRef]
Cite This Article
 Copyright © 2022 The Author(s). Published by Tech Science Press.
This work is licensed under a Creative Commons Attribution 4.0 International License , which permits unrestricted use, distribution, and reproduction in any medium, provided the original work is properly cited.
 Downloads
 Citation Tools